



Kirenol
Based on 1 publication(s) in Google Scholar
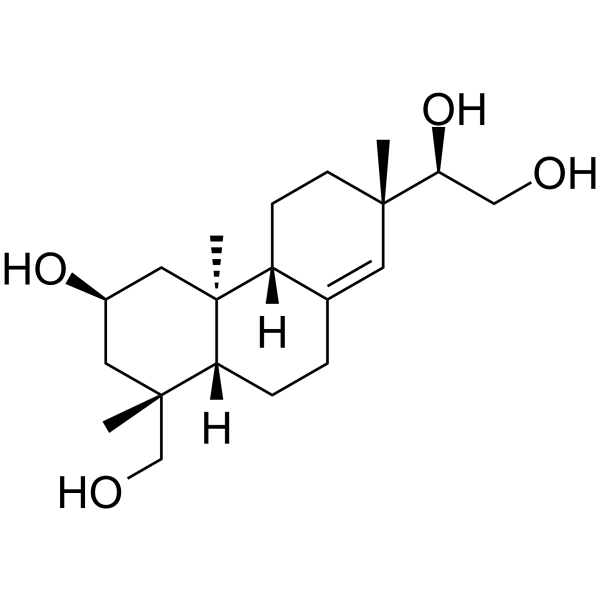
Kirenol is a diterpenoid compound, an orally active apoptosis inducer and signaling pathway regulator, with a Kd value of 5.47 μM against the target CK2. Kirenol promotes the cleavage of Bid into tBid, regulates the protein levels/phosphorylation of Bax, Bcl-2, p53 and p21, and induces caspase-independent apoptosis, S-phase cell cycle arrest, ROS accumulation and cytotoxicity in cancer cells. Kirenol activates the CK2/AKT and AMPK-mTOR-ULK1 pathways, inhibits the signaling of NF-κB, TGF-β/Smads and NLRP3 inflammasome, and regulates the GSK3β, BMP and Wnt/β-catenin pathways. Kirenol induces autophagy, mitophagy and osteoblast differentiation, promotes mitochondrial fusion, and exerts antioxidant, anti-inflammatory, antifibrotic, renoprotective, cardioprotective, neuroprotective and analgesic effects. Kirenol is applicable to research related to chronic myeloid leukemia, ischemic stroke, diabetic nephropathy, heart failure, acute lung injury and osteoporosis.
For research use only. We do not sell to patients.
- Purity : 99.82%
- CAS No.: 52659-56-0
- Formula: C20H34O4
- Molecular Weight:338.48
-
Storage:
-20°C, protect from light
* In solvent : -80°C, 6 months; -20°C, 1 month (protect from light)

To place orders, for customer services and technical support, please contact: MedChemExpress USA
Tel: 609-228-6898 E-mail: [email protected] [email protected]


-
 Biological Activity
-
Chemical Information
-
Solvent & Solubility
- Protocols
- Purity & Documentation
- References
-
 Help & FAQs


-
HY-N0156
Oleanolic acidAutophagy Inducer -
HY-N0197
BaicalinAutophagy Inducer -
HY-N0529
Rosmarinic acidAnti-Inflammatory Agent -

HY-N0559R
Kirenol (Standard)Analytical Standard -
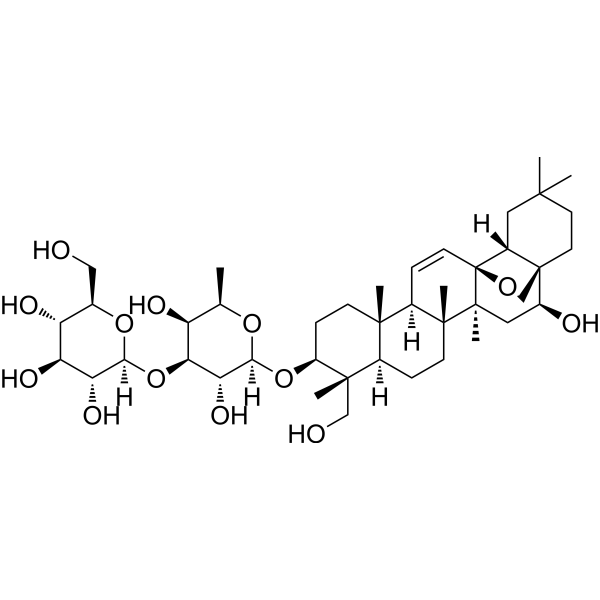
HY-N0246
Saikosaponin AAnti-inflammatory Agent -
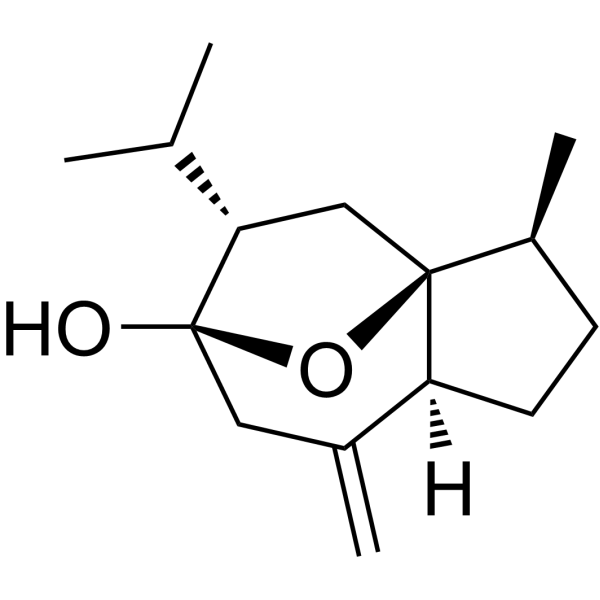
HY-N0104
CurcumolApoptosis Inducer -
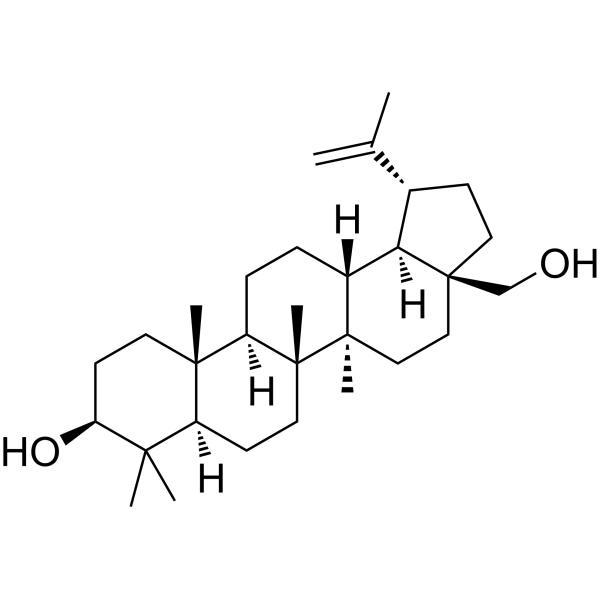
HY-N0083
BetulinEndogenous Metabolite -
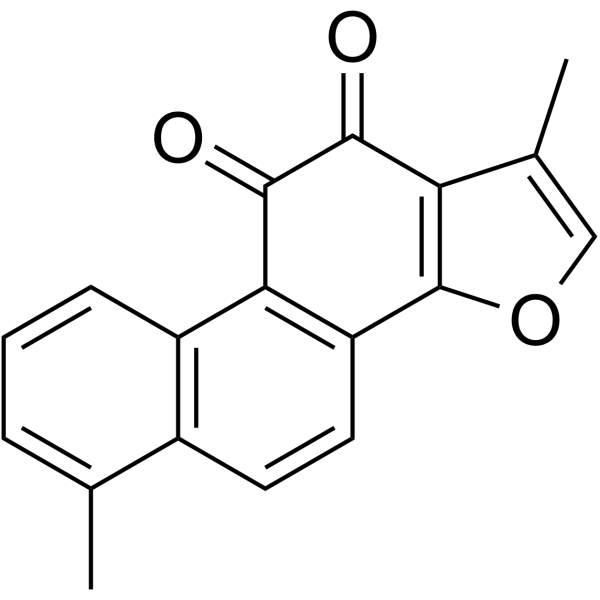
HY-N0134
Tanshinone IPhospholipase Inhibitor -
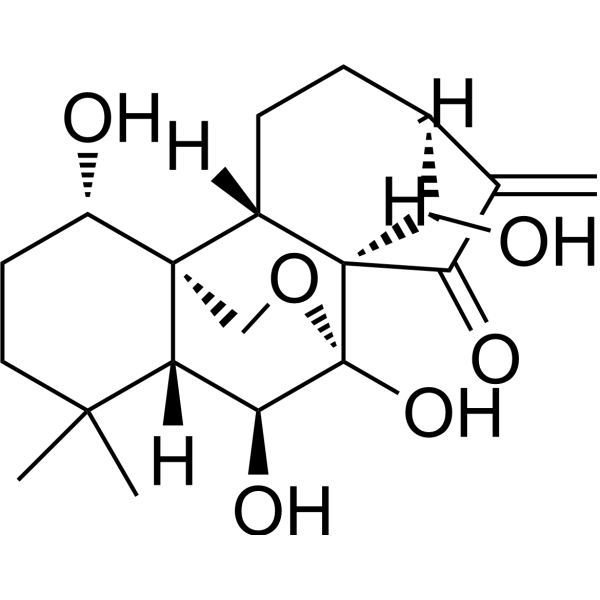
HY-N0004
OridoninBacterial Inhibitor -
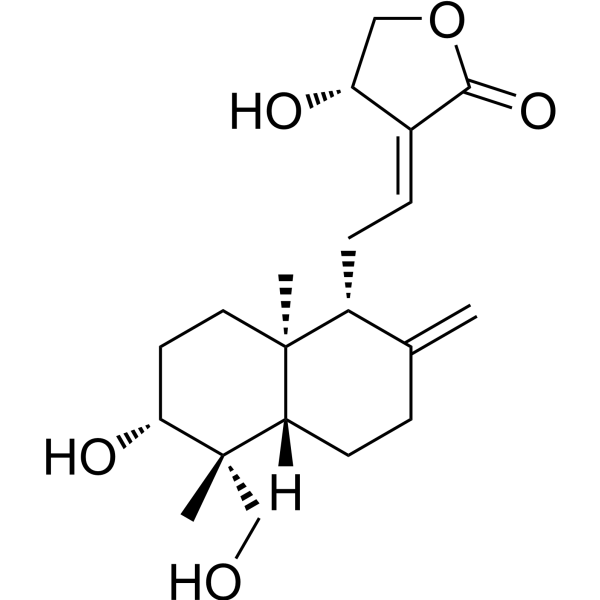
HY-N0191
AndrographolideNF-κB Inhibitor -

HY-N0156R
Oleanolic acid (Standard)Autophagy Inducer
Publications Citing Use of MedChemExpress (MCE) Kirenol
More Customer Validation & Images

-
RT-PCR
-
IF

-
IHC

-
ELISA

-
Flow Cytometry

All AMPK Isoforms
More

Biological Activity
Description
Cellular Effect
|
Cell Line

|
Type | Value | Description | References |
|---|---|---|---|---|
| B16 | IC50 |
>100 μg/mL
Compound: 5
|
Cytotoxicity against mouse B16 cells after 44 hrs by MTT assay
Cytotoxicity against mouse B16 cells after 44 hrs by MTT assay
|
[PMID: 19928884] |
| HSC-T6 | IC50 |
>100 μg/mL
Compound: 5
|
Cytotoxicity against rat HSC-T6 cells after 44 hrs by MTT assay
Cytotoxicity against rat HSC-T6 cells after 44 hrs by MTT assay
|
[PMID: 19928884] |
| MDA-MB-231 | IC50 |
>10 μM
Compound: 19
|
Antiinvasive activity in human MDA-MB-231 cells assessed as inhibition of EGF-induced cell invasion after 3.5 hrs
Antiinvasive activity in human MDA-MB-231 cells assessed as inhibition of EGF-induced cell invasion after 3.5 hrs
|
[PMID: 28009521] |
| RAW264.7 | IC50 |
>100 μM
Compound: 19
|
Antiinflammatory activity in mouse RAW264.7 cells assessed as inhibition of LPS-induced nitric oxide production after 24 hrs by Griess assay
Antiinflammatory activity in mouse RAW264.7 cells assessed as inhibition of LPS-induced nitric oxide production after 24 hrs by Griess assay
|
[PMID: 28009521] |
In Vitro
Kirenol (10-40 μg/mL; 24-72 h) potently inhibits proliferation of human chronic myeloid leukemia K562 cells in a time- and dose-dependent manner, with IC50 values of 53.05 μg/mL (24 h), 18.19 μg/mL (48 h), and 15.08 μg/mL (72 h)[1].
Kirenol (10-40 μg/mL; 24 h) induces dose-dependent apoptosis in human chronic myeloid leukemia K562 cells, with apoptosis rates ranging from 8.29% to 51.85%[1].
Kirenol (40 μg/mL; 12-48 h) induces time-dependent loss of mitochondrial membrane potential in human chronic myeloid leukemia K562 cells over 12, 24, and 48 h[1].
Kirenol (40 μg/mL; 12-48 h) induces time-dependent accumulation of ROS in human chronic myeloid leukemia K562 cells over 12, 24, and 48 h[1].
Kirenol (40 μg/mL; 12-48 h) modulates Bcl-2 family protein expression in human chronic myeloid leukemia K562 cells, reducing Bcl-2 levels and increasing Bax and tBid levels over 12, 24, and 48 h, and upregulating phosphorylation of p53 (Ser 6 and Ser 37) and p21 protein expression[1].
Kirenol (10-40 μg/mL; 48 h) induces dose-dependent S-phase cell cycle arrest in human chronic myeloid leukemia K562 cells[1].
Kirenol (1.25-5% Kirenol-containing serum; 24 h (prior to TBHP treatment)) exerts anti-apoptotic and antioxidant effects in TBHP-injured HT22 cells by modulating apoptotic proteins, reducing ROS, and restoring antioxidant/oxidative stress marker balance[2].
Kirenol (1.25-5% Kirenol-containing serum; 24 h (prior to TBHP treatment)) preserves mitochondrial function and promotes Opa1-mediated mitochondrial fusion in TBHP-injured HT22 cells, reversing fragmentation, increasing ATP production, restoring MMP, and upregulating Opa1 expression[2].
Kirenol (10-80 μM pre-incubated 30 min then co-treated with 30 mM glucose for 24 h; 20 μM pre-incubated 30 min then co-treated with 10 ng/mL TGF-β1 for 24 h) inhibits activation of the TGF-β/Smads pathway and reduces extracellular matrix protein accumulation in primary mouse mesangial cells[3].
Kirenol (20 μM; 3 h pre-incubation prior to 24 h Ang II stimulation) suppresses Ang II-induced NLRP3 inflammasome activation and mitochondrial ROS production in mouse bone marrow-derived macrophages by enhancing mitophagy, as these effects are reversed by mitophagy inhibition[4].
Kirenol (50-200 μg/mL; 24 h post-LPS challenge) dose-dependently inhibits TNF-α mRNA expression in LPS-challenged A549 cells[6].
Kirenol (50-200 μg/mL; 24 h post-LPS challenge) dose-dependently enhances autophagy in LPS-challenged A549 cells, as shown by increased LC3-II and decreased p62 protein levels[6].
Kirenol (200 μg/mL; 24 h post-LPS challenge) activates the AMPK-mTOR-ULK1 pathway in LPS-challenged A549 cells, as shown by increased p-AMPK and p-ULK1, and decreased p-mTOR protein levels[6].
Kirenol (10-40 μM; 3 days) dose-dependently upregulates the mRNA expression of key osteoblast differentiation markers (ALP, ColA1, OPN) in MC3T3-E1 cells, with significant increases of 67.8%, 40.0%, and 67.7% respectively at 40 μM after 3 days of treatment[7].
Kirenol (10-40 μM; 3 days) dose-dependently activates the BMP signaling pathway in MC3T3-E1 cells after 3 days of treatment at 10, 20, and 40 μM by upregulating the mRNA expression of BMP2, Runx2, and Osx[7].
MedChemExpress (MCE) has not independently confirmed the accuracy of these methods. They are for reference only.
-
Cell Line:human chronic myeloid leukemia K562 cells
-
Concentration:40 μg/mL
-
Incubation Time:24 h
-
Result:Induced marked nuclear condensation and fragmentation in K562 cells, as indicated by fluorescent staining.
-
Cell Line:human chronic myeloid leukemia K562 cells
-
Concentration:40 μg/mL
-
Incubation Time:12, 24, 48 h
-
Result:Caused a significant decrease in mitochondrial cytochrome c levels at 12 and 24 h. Induced a marked increase in cytosolic cytochrome c levels at 24 h.
Decreased Bcl-2 protein levels at 24 and 48 h. Upregulated Bax and tBid (cleaved Bid) protein levels at 12, 24, and 48 h.\nIncreased phosphorylation of p53 at Ser 6 and Ser 37 at 24 and 48 h, with no change in total p53 levels. Significantly increased p21 protein levels at 12, 24, and 48 h.
-
Cell Line:human chronic myeloid leukemia K562 cells
-
Concentration:10-40 μg/mL
-
Incubation Time:48 h
-
Result:Induced dose-dependent S-phase cell cycle arrest, with S-phase population increasing from 48.99% (untreated) to 52.89% (10 μg/mL), 56.05% (20 μg/mL), and 70.04% (40 μg/mL).
-
Cell Line:Primary mouse mesangial cells
-
Concentration:10-80 μM
-
Incubation Time:24 h (co-treatment); 30 min (pre-incubation)
-
Result:Reduced high glucose-induced increases in fibronectin and collagen IV levels. Inhibited high glucose-induced phosphorylation of Smad2/3. Suppressed TGF-β1-induced phosphorylation of Smad2/3. Attenuated TGF-β1-induced increases in fibronectin and collagen IV levels. Did not alter baseline levels of these proteins when treated alone at 20 μM.
-
Cell Line:A549 (LPS-challenged acute lung injury cell model)
-
Concentration:50-200 μg/mL
-
Incubation Time:1 h pre-incubation, then 24 h with LPS
-
Result:Dose-dependently reduced LPS-induced TNF-α mRNA expression.
-
Cell Line:A549 (LPS-challenged acute lung injury cell model)
-
Concentration:200 μg/mL
-
Incubation Time:1 h pre-incubation, then 24 h with LPS
-
Result:Increased the number of LC3 dots per cell relative to LPS-only treated cells.
Decreased p62 fluorescence intensity per cell relative to LPS-only treated cells.
Decreased mTOR fluorescence intensity per cell relative to LPS-only treated cells.
Decreased p-mTOR fluorescence intensity per cell relative to LPS-only treated cells.
-
Cell Line:MC3T3-E1 pre-osteoblastic cells
-
Concentration:10-40 μM
-
Incubation Time:24 h
-
Result:Showed no significant cytotoxicity at 10, 20, and 40 μM.
-
Cell Line:MC3T3-E1 pre-osteoblastic cells undergoing osteoblast differentiation
-
Concentration:10-40 μM
-
Incubation Time:3 days
-
Result:Increased mRNA expression of ALP, type I collagen (ColA1), and osteopontin (OPN) in a dose-dependent manner; increased ALP mRNA expression by 67.8%, ColA1 by 40.0%, and OPN by 67.7% at 40 μM compared to control.
Increased mRNA expression of osteoprotegerin (OPG), while decreased receptor activator of nuclear factor kappa B ligand (RANKL) mRNA expression, resulting in an increased OPG/RANKL ratio.\nSignificantly increased mRNA expression of BMP2, runt-related transcription factor 2 (Runx2), and osterix (Osx) in a dose-dependent manner.
Significantly increased mRNA expression of low density lipoprotein receptor related protein 5 (LRP5), disheveled 2 (DVL2), β-catenin, and cyclin D1 (CCND1) in a dose-dependent manner.
In Vivo
Kirenol (2 mg/kg; p.o.; daily; 3 months) alleviates diabetic nephropathy in male C57BL/6J mice by reducing phosphorylation of Smad2/3 (0.64-fold) and NF-κB (0.43-fold), restoring IκBα levels, decreasing ECM accumulation and inflammatory cytokine expression, and improving renal structural and functional markers[3].
Kirenol (50 mg/kg; i.p.; daily; starting 1 day pre-surgery until study end) exerts cardioprotective effects in pressure overload-induced heart failure by improving cardiac function, reducing hypertrophy and fibrosis, suppressing inflammatory responses, and enhancing macrophage mitophagy, with these benefits abrogated by mitophagy inhibition[4].
Kirenol (0.1-0.5% (w/w); topical; single application of 0.3 g cream) dose-dependently inhibits carrageenan-induced acute paw edema and reduces local pro-inflammatory cytokine (IL-1β, TNF-α) levels[5].
Kirenol (100 mg/kg; i.p.; daily; 7 days) significantly reduces LPS-induced acute lung injury in Balb/c mice by enhancing autophagy and inhibiting inflammation, as evidenced by reduced inflammatory cytokine levels, improved lung histopathology, and decreased lung edema and leukocyte infiltration[6].
MedChemExpress (MCE) has not independently confirmed the accuracy of these methods. They are for reference only.
-
Animal Model:Sprague-Dawley (male, 200-240 g, ischemic stroke model via MCAO/R)[2]
-
Dosage:1.25 mg/kg; 2.5 mg/kg; 5 mg/kg
-
Administration:i.p.; daily; 7 days
-
Result:Significantly reduced modified Neurological Severity Scores (mNSS), increased paw grip tension, and reduced right turn frequency on days 5 and 7 post-treatment.
Significantly reduced cerebral infarct volume, with the 5 mg/kg group showing reduction to ~18% infarct volume (vs ~40% in MCAO controls), corresponding to up to ~55% reduction.
Reduced neuronal nuclear contraction and cell spacing in the ischemic cortex, with improved cell structure organization.
Significantly increased levels of superoxide dismutase (SOD), glutathione (GSH), glutathione peroxidase (GPx), and SOD2 protein expression, while significantly reducing levels of malondialdehyde (MDA) and lactate dehydrogenase (LDH) in peri-infarct brain tissue.\nSignificantly increased optic atrophy 1 (Opa1) protein expression without altering levels of Fis1, Drp1, MFN1, MFN2.\nSignificantly increased CK2 protein levels and AKT phosphorylation (p-AKT/AKT ratio) in peri-infarct brain tissue.
-
Animal Model:C57BL/6J (male, ~20 g, diabetic nephropathy induced via 2 months high-fat diet + 5 consecutive days 100 mg/kg streptozotocin i.p. injection)[3]
-
Dosage:2 mg/kg
-
Administration:p.o.; daily; 3 months
-
Result:Did not lower blood glucose but improved the kidney/body weight ratio.
Ameliorated serum creatinine and blood urea nitrogen levels.
Alleviated diabetes-induced mesangial expansion, focal interstitial inflammation, glomerular atrophy, and glomerular sclerosis.
Reduced glomerular basement membrane thickness and podocyte foot process fusion.
Decreased phosphorylation of Smad2/3 by 0.64-fold, and reduced accumulation of fibronectin (FN) and collagen IV (Col IV) by 0.58-fold and 0.35-fold, respectively.
Restored IκBα expression to normal levels.
Decreased phosphorylation of NF-κB by 0.43-fold.
Reduced IL-6 and TNF-α expression by 0.57-fold and 0.46-fold, respectively.
Reduced FN-positive area and collagen fiber accumulation in renal tissue.
-
Animal Model:C57BL/6J (8-week-old male)[4]
-
Dosage:50 mg/kg
-
Administration:i.p.; daily; starting 1 day pre-surgery until study end
-
Result:Increased left ventricular ejection fraction (LVEF) and left ventricular fractional shortening (LVFS) compared to vehicle-treated TAC mice.
Reduced end-diastolic left ventricular internal dimension (LVIDd) compared to vehicle-treated TAC mice.
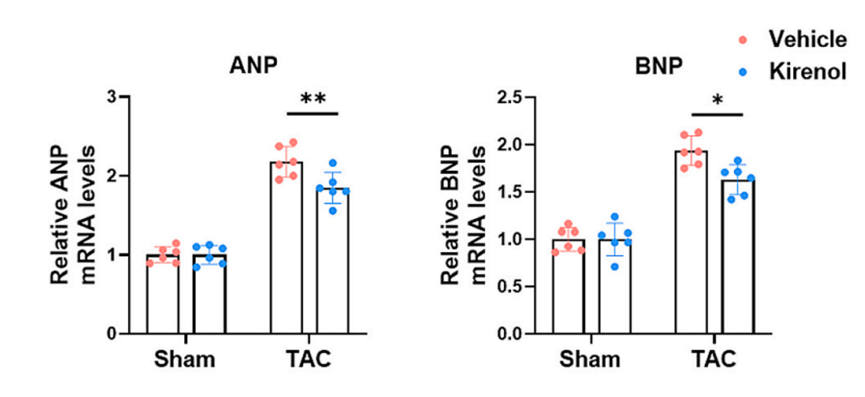
Reduced mRNA levels of cardiac stress biomarkers ANP and BNP compared to vehicle-treated TAC mice.
Lowered heart weight to body weight (HW/BW) ratios compared to vehicle-treated TAC mice.
Decreased cardiomyocyte cross-sectional area compared to vehicle-treated TAC mice.
Reduced cardiac collagen deposition (fibrosis) measured by Masson's trichrome staining compared to vehicle-treated TAC mice.
Lowered mRNA expression of fibrosis markers α-SMA, COL1, and COL3 compared to vehicle-treated TAC mice.
Decreased cardiac infiltration of CD11b+F4/80+ macrophages compared to vehicle-treated TAC mice.
Reduced NLRP3 protein expression in heart tissue compared to vehicle-treated TAC mice.
Lowered serum levels of pro-inflammatory cytokines TNF-α, IL-6, IL-18, and IL-1β compared to vehicle-treated TAC mice.
-
Animal Model:Wistar rats (male, SPF, 250-300 g)[5]
-
Dosage:0.1% (w/w); 0.2% (w/w); 0.3% (w/w); 0.4% (w/w); 0.5% (w/w)
-
Administration:topical; single application of 0.3 g cream
-
Result:Produced 36.87%, 40.02%, 39.01%, and 42.62% reduction in paw edema at 1, 2, 3, and 4 hours post-carrageenan injection, respectively, with statistically significant differences vs. base cream at all time points.
Produced 48.88%, 43.01%, 42.77%, and 47.20% reduction in paw edema at 1, 2, 3, and 4 hours post-carrageenan injection, respectively, with statistically significant differences vs. base cream at all time points.
Produced 57.28%, 55.34%, 46.21%, and 48.90% reduction in paw edema at 1, 2, 3, and 4 hours post-carrageenan injection, respectively, with statistically significant differences vs. base cream.
Produced 65.37%, 65.21%, 61.25%, and 64.21% reduction in paw edema at 1, 2, 3, and 4 hours post-carrageenan injection, respectively, with statistically significant differences vs. base cream; this anti-inflammatory effect was similar to that of 0.5% piroxicam gel at 4 hours post-carrageenan injection.
Produced 81.09%, 74.82%, 76.31%, and 76.78% reduction in paw edema at 1, 2, 3, and 4 hours post-carrageenan injection, respectively, with statistically significant differences vs. base cream; this anti-inflammatory effect was similar to that of 0.5% piroxicam gel at 4 hours post-carrageenan injection.
Significantly reduced carrageenan-induced increases in IL-1β and TNF-α levels in subcutaneous plantar tissue.
-
Animal Model:Balb/c (6-8 weeks old, 18-22 g, 20 female, 20 male, LPS-induced ALI)[6]
-
Dosage:100 mg/kg
-
Administration:i.p.; daily; 7 consecutive days
-
Result:Significantly decreased LPS-induced serum levels of IL-1β, IL-6, and TNF-α.
Significantly decreased LPS-induced lung homogenate levels of IL-1β, IL-6, and TNF-α.
Increased lung tissue LC3-II protein expression and decreased lung tissue p62 protein expression compared to LPS-only mice.
Attenuated LPS-induced lung pathological injuries (including alveolar collapse, stromal hemorrhage, pulmonary edema, and inflammatory cell infiltration).
Reduced lung wet/dry weight ratio, decreased bronchoalveolar lavage fluid (BALF) protein concentration, reduced total BALF cell count, lowered BALF neutrophil percentage, and decreased lung myeloperoxidase (MPO) activity compared to LPS-only mice.
- Western Blot
- Mammalian live/dead viability and cytotoxicity staining
- Annexin V plus membrane-impermeant dye apoptosis staining
- BrdU Incorporation Assay
- ROS/oxidative-stress fluorescent staining
- Protocol for Cell Cycle
- Research Protocol for Cardiovascular Diseases
- Research Protocol for Inflammation-related Diseases
- Cell Viability Determination by MTT Colorimetric Assay
- Kinase activity and phosphorylation assays
- Detection of Apoptosis
- TUNEL staining for apoptotic DNA fragmentation
- Flow cytometric DNA-content cell-cycle staining
- Cell Cytotoxicity Assay
- Autophagy
- Apoptosis Solutions
- Protocol for Kinase activity and phosphorylation assays
- Lysosome and acidic-vesicle live-cell staining
- Mitophagy Solutions
- Inhalation Toxicity Study
- Macroautophagy Solutions
- Pyroptosis Solutions


Chemical Information
-
CAS No. 52659-56-0
-
Appearance Solid
-
Molecular Weight 338.48
-
Formula C20H34O4
-
Color Off-white to light yellow
-
SMILES
C[C@]([C@@](CC1)([H])[C@]2(C)CO)(C[C@H](O)C2)[C@@]3([H])C1=C[C@]([C@@H](O)CO)(C)CC3
-
Structure Classification
-
Shipping
Room temperature in continental US; may vary elsewhere.
-
Storage
-20°C, protect from light
* In solvent : -80°C, 6 months; -20°C, 1 month (protect from light)


Publications (1)
-
Journal Impact Factor
-
Most Recent
-
Int J Cardiol
Kirenol attenuates pressure overload-induced heart failure by enhancing autophagy in macrophages. [Abstract]2025 Dec 1:440:133681. PMID: 40752803
Kirenol purchased from MedChemExpress. Usage Cited in: Int J Cardiol. 2025 Dec 1:440:133681. [Abstract]
Real-time PCR results for atrial natriuretic peptide (ANP) and brain natriuretic peptide (BNP) mRNA levels in heart tissues treated with Kirenol (20 mg/kg, i.p.).
Kirenol purchased from MedChemExpress. Usage Cited in: Int J Cardiol. 2025 Dec 1:440:133681. [Abstract]
Representative images of wheat germ agglutinin (WGA) staining in ventricular tissues treated with Kirenol (20 mg/kg, i.p.).
Kirenol purchased from MedChemExpress. Usage Cited in: Int J Cardiol. 2025 Dec 1:440:133681. [Abstract]
Representative immunohistochemical staining of CD45 in the left ventricular myocardium treated with Kirenol (20 mg/kg, i.p.).
Kirenol purchased from MedChemExpress. Usage Cited in: Int J Cardiol. 2025 Dec 1:440:133681. [Abstract]
ELISA analysis of inflammatory cytokines TNF-α, IL-6, IL-18, and IL-1β in mouse serum treated with Kirenol (20 mg/kg, i.p.).
Kirenol purchased from MedChemExpress. Usage Cited in: Int J Cardiol. 2025 Dec 1:440:133681. [Abstract]
Flow cytometry gating strategy and corresponding quantification showing the ratio of CD11B+ F4/80+ macrophages in heart tissues treated with Kirenol (20 mg/kg, i.p.).

Kirenol purchased from MedChemExpress. Usage Cited in: Int J Cardiol. 2025 Dec 1:440:133681. [Abstract]
Western blot analysis of NLRP3 and IL-1β in BMDMs treated with ANGII (1 μM) with or without Kirenol (20 μM) for 24 h.


Solvent & Solubility
In Vitro:
DMSO : 100 mg/mL (295.44 mM; Need ultrasonic; Hygroscopic DMSO has a significant impact on the solubility of product, please use newly opened DMSO)
H2O : < 0.1 mg/mL (insoluble)
Please refer to the solubility information to select the appropriate solvent. Once prepared, please aliquot and store the solution to prevent product inactivation from repeated freeze-thaw cycles.
Storage method and period of stock solution: -80°C, 6 months; -20°C, 1 month (protect from light). When stored at -80°C, please use it within 6 months. When stored at -20°C, please use it within 1 month.
Please refer to the solubility information to select the appropriate solvent. Once prepared, please aliquot and store the solution to prevent product inactivation from repeated freeze-thaw cycles.
Storage method and period of stock solution: -80°C, 6 months; -20°C, 1 month (protect from light). When stored at -80°C, please use it within 6 months. When stored at -20°C, please use it within 1 month.
Concentration (start) × Volume (start) = Concentration (final) × Volume (final)
In Vivo:
Select the appropriate dissolution method based on your experimental animal and administration route.
- For the following dissolution methods, please ensure to first prepare a clear stock solution using an In Vitro approach and then sequentially add co-solvents:
- To ensure reliable experimental results, the clarified stock solution can be appropriately stored based on storage conditions. As for the working solution for In Vivo experiments, it is recommended to prepare freshly and use it on the same day.
- The percentages shown for the solvents indicate their volumetric ratio in the final prepared solution. If precipitation or phase separation occurs during preparation, heat and/or sonication can be used to aid dissolution.
Add each solvent one by one: 10% DMSO 40% PEG300 5% Tween-80 45% Saline
Solubility: ≥ 3.25 mg/mL (9.60 mM); Clear solution
This protocol yields a clear solution of ≥ 3.25 mg/mL (saturation unknown).
Taking 1 mL working solution as an example, add 100 μL DMSO stock solution (32.5 mg/mL) to 400 μL PEG300, and mix evenly; then add 50 μL Tween-80 and mix evenly; then add 450 μL Saline to adjust the volume to 1 mL.
Preparation of Saline: Dissolve 0.9 g sodium chloride in ddH₂O and dilute to 100 mL to obtain a clear Saline solution.
Add each solvent one by one: 10% DMSO 90% (20% SBE-β-CD in Saline)
Solubility: ≥ 3.25 mg/mL (9.60 mM); Clear solution
This protocol yields a clear solution of ≥ 3.25 mg/mL (saturation unknown).
Taking 1 mL working solution as an example, add 100 μL DMSO stock solution (32.5 mg/mL) to 900 μL 20% SBE-β-CD in Saline, and mix evenly.
Preparation of 20% SBE-β-CD in Saline (4°C, storage for one week): 2 g SBE-β-CD powder is dissolved in 10 mL Saline, completely dissolve until clear.
In Vivo Dissolution Calculator
Please enter the basic information of animal experiments:
-
-
-
-
Recommended: Prepare an additional quantity of animals to account for potential losses during experiments.
Please enter your animal formula composition:
-
%DMSO +
Recommended: Keep the proportion of DMSO in working solution below 2% if your animal is weak.
-
%+
-
+%Tween-80 + +
-
%Saline +
The co-solvents required include: DMSO, . All of co-solvents are available by MedChemExpress (MCE). , Tween 80. All of co-solvents are available by MedChemExpress (MCE).
Working solution concentration: 0.22 mg/mL
Method for preparing stock solution: mg drug dissolved in μL DMSO. Stock solution concentration: mg/mL. * In solvent : -80°C, 6 months; -20°C, 1 month (protect from light)
1. Take μL DMSO stock solution;
2. Add μL .
μL , mix evenly;
3. Then add μL Tween 80, mix evenly;
4. Then add μL
Please ensure that the stock solution in the first step is dissolved to a clear state, and add co-solvents in sequence. You can use ultrasonic heating (ultrasonic cleaner, recommended frequency 20-40 kHz), vortexing, etc. to assist dissolution.


Purity & Documentation
-
Data Sheet (302 KB)
-
SDS (393 KB)
- English - EN (393 KB)
- Français - FR (393 KB)
- Deutsch - DE (393 KB)
- Norwegian - NO (393 KB)
- Español - ES (393 KB)
- Swedish - SV (393 KB)
- Italian - IT (393 KB)
- Korean - KR (393 KB)
- Portuguese - PT (393 KB)
-
Handling Instructions (2659 KB)
References
[1]. Lu Y, et al. Kirenol, a compound from Herba Siegesbeckiae, induces apoptosis in human chronic myeloid leukemia K562 cells. Pharmazie. 2014;69(2):148-153. [Content Brief]
[2]. Zhang Y, et al. Kirenol alleviates cerebral ischemia-reperfusion injury by reducing oxidative stress and ameliorating mitochondrial dysfunction via activating the CK2/AKT pathway. Free Radic Biol Med. 2025;232:353-366. [Content Brief]
[3]. Li J, et al. Kirenol alleviates diabetic nephropathy via regulating TGF-β/Smads and the NF-κB signal pathway. Pharm Biol. 2022;60(1):1690-1700. [Content Brief]
[4]. Huang Z, et al. Kirenol attenuates pressure overload-induced heart failure by enhancing autophagy in macrophages. Int J Cardiol. 2025;440:133681. [Content Brief]
[5]. Wang JP, et al. Topical anti-inflammatory and analgesic activity of kirenol isolated from Siegesbeckia orientalis. J Ethnopharmacol. 2011;137(3):1089-1094. [Content Brief]
[6]. Xiao J, et al. Kirenol inhibits inflammation challenged by lipopolysaccharide through the AMPK-mTOR-ULK1 autophagy pathway. Int Immunopharmacol. 2023;116:109734. [Content Brief]
[7]. Kim MB, et al. Kirenol stimulates osteoblast differentiation through activation of the BMP and Wnt/β-catenin signaling pathways in MC3T3-E1 cells. Fitoterapia. 2014;98:59-65. [Content Brief]


Complete Stock Solution Preparation Table
Please refer to the solubility information to select the appropriate solvent. Once prepared, please aliquot and store the solution to prevent product inactivation from repeated freeze-thaw cycles.
Storage method and period of stock solution: -80°C, 6 months; -20°C, 1 month (protect from light). When stored at -80°C, please use it within 6 months. When stored at -20°C, please use it within 1 month.
| Optional Solvent | Concentration Solvent Mass | 1 mg | 5 mg | 10 mg | 25 mg |
|---|---|---|---|---|---|
| DMSO | 1 mM | 2.9544 mL | 14.7719 mL | 29.5438 mL | 73.8596 mL |
| 5 mM | 0.5909 mL | 2.9544 mL | 5.9088 mL | 14.7719 mL | |
| 10 mM | 0.2954 mL | 1.4772 mL | 2.9544 mL | 7.3860 mL | |
| 15 mM | 0.1970 mL | 0.9848 mL | 1.9696 mL | 4.9240 mL | |
| 20 mM | 0.1477 mL | 0.7386 mL | 1.4772 mL | 3.6930 mL | |
| 25 mM | 0.1182 mL | 0.5909 mL | 1.1818 mL | 2.9544 mL | |
| 30 mM | 0.0985 mL | 0.4924 mL | 0.9848 mL | 2.4620 mL | |
| 40 mM | 0.0739 mL | 0.3693 mL | 0.7386 mL | 1.8465 mL | |
| 50 mM | 0.0591 mL | 0.2954 mL | 0.5909 mL | 1.4772 mL | |
| 60 mM | 0.0492 mL | 0.2462 mL | 0.4924 mL | 1.2310 mL | |
| 80 mM | 0.0369 mL | 0.1846 mL | 0.3693 mL | 0.9232 mL | |
| 100 mM | 0.0295 mL | 0.1477 mL | 0.2954 mL | 0.7386 mL |


Kirenol Related Classifications
HY-N0559 Related Classifications
 Powered by Bioz