



EC144

Based on 1 Customer Validation
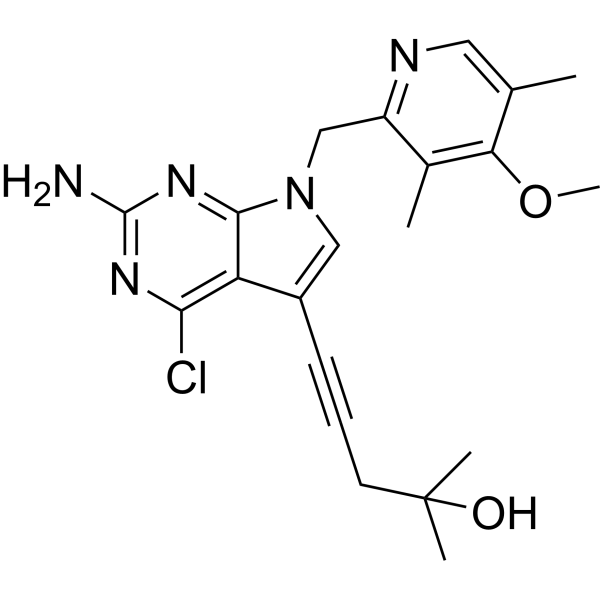
EC144 is an orally active and selective Hsp90 inhibitor (IC50 = 1.1 nM, Ki = 0.2 nM). EC144 inhibits NLRP3 inflammasome (IC50 99 nM), binds to the ATP-binding pocket of the N-terminal domain, blocks chaperone function and destabilizes client proteins, including JAK2, STAT3, Her-2, EGFR, IGFR, Akt, ErbB2 and cyclin D, with higher selectivity for cytoplasmic Hsp90 than for Grp94 and TNF-α-inducible protein 1 (TNFAIP1). EC144 also directly binds to the extracellular region of E-cadherin, disrupting E-cadherin-mediated adhesion and tight junction function, and exhibits species-specific binding to human, bovine and mouse E-cadherin, but does not bind rat or chicken E-cadherin, and does not interact with N-cadherin or VE-cadherin. EC144 blocks NLRP3 inflammasome priming and activation, ASC speck formation, caspase-1 activation, IL-1β release and pyroptotic cell death. EC144 is detectable at brain levels after oral administration and upregulates brain Hsp70. EC144 can be used for research on rheumatoid arthritis, Alzheimer's disease, intervertebral disc degeneration, peritonitis, gastric cancer and botulism.
For research use only. We do not sell to patients.
- Purity : 98.01%
- CAS No.: 911397-80-3
- Formula: C21H24ClN5O2
- Molecular Weight:413.90
-
Storage:
4°C, sealed storage, away from moisture and light
* In solvent : -80°C, 6 months; -20°C, 1 month (sealed storage, away from moisture and light)

To place orders, for customer services and technical support, please contact: MedChemExpress USA
Tel: 609-228-6898 E-mail: [email protected] [email protected]


-
 Biological Activity
-
Chemical Information
-
Solvent & Solubility
- Protocols
- Purity & Documentation
- References
-
 Help & FAQs


-
HY-14463
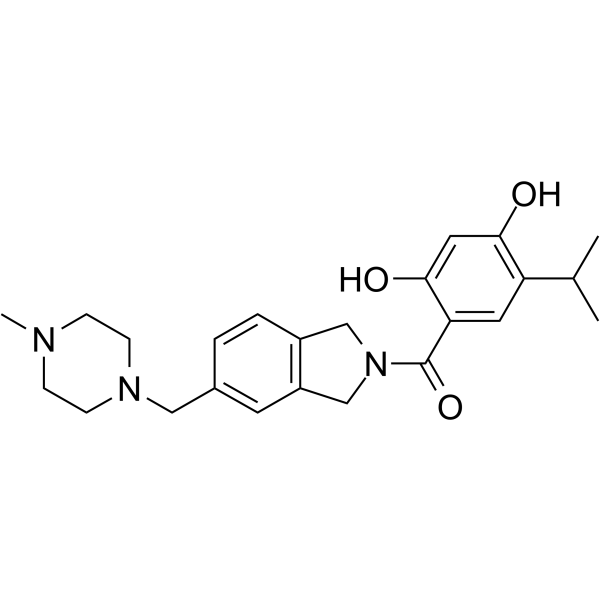
OnalespibHsp90 Inhibitor -
HY-15205
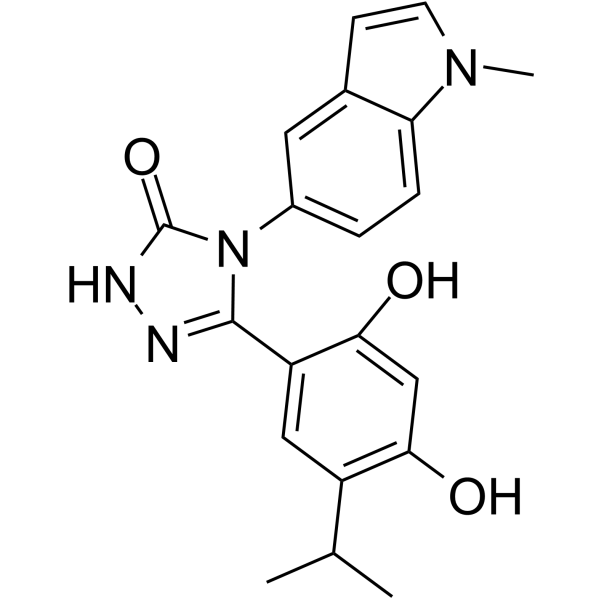
GanetespibHSP90 Inhibitor -
HY-10214
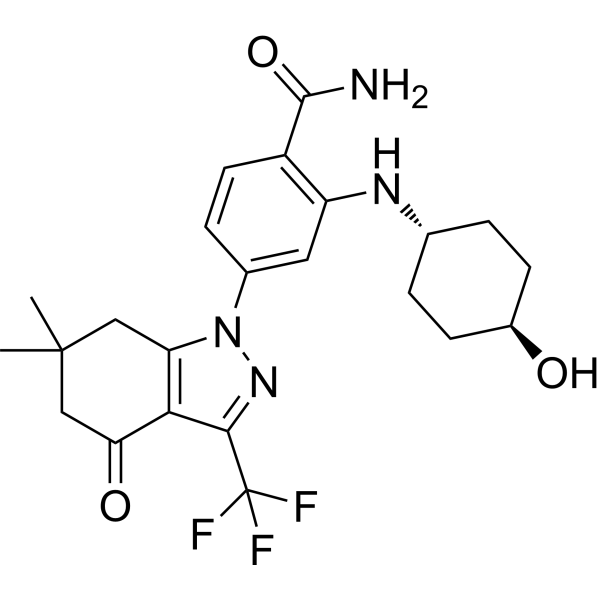
SNX-2112 -
HY-100110
KNK437HSP Inhibitor -
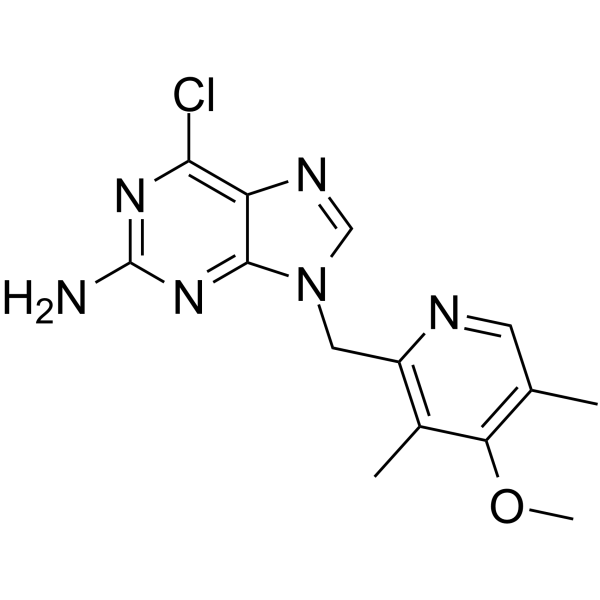
HY-10212
BIIB021HSP90 Inhibitor -
HY-15190
NVP-HSP990Apoptosis Inducer -
HY-15785
PimitespibHSP90α/HSP90β Inhibitor -
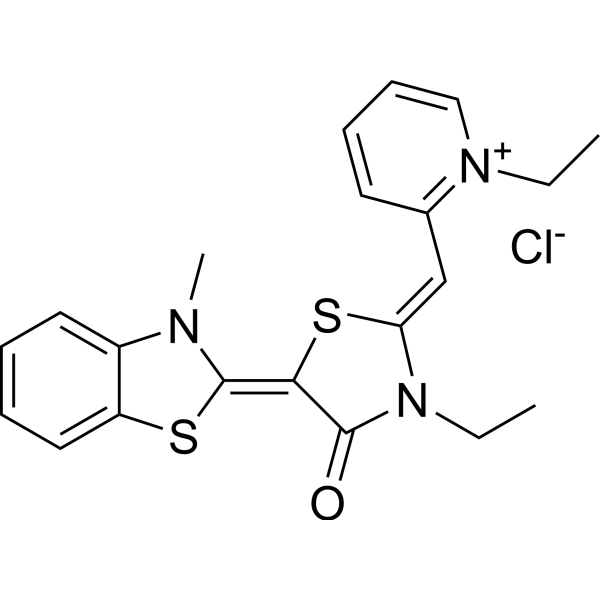
HY-15096
MKT-077Hsp70 Inhibitor -
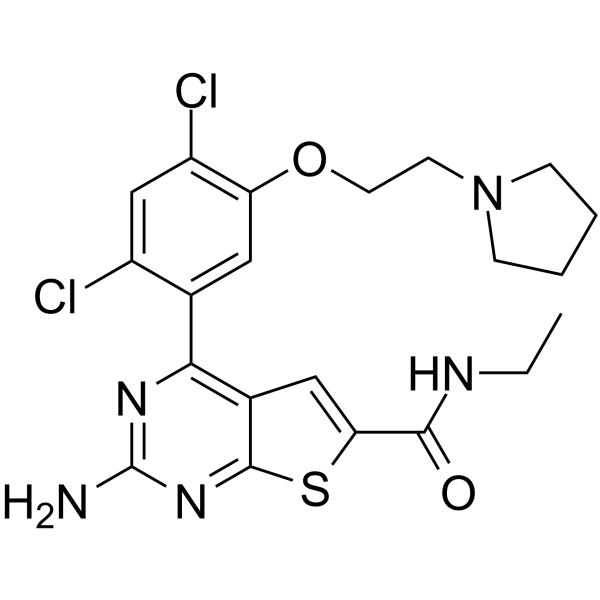
HY-10942
VER-82576HSP Inhibitor -
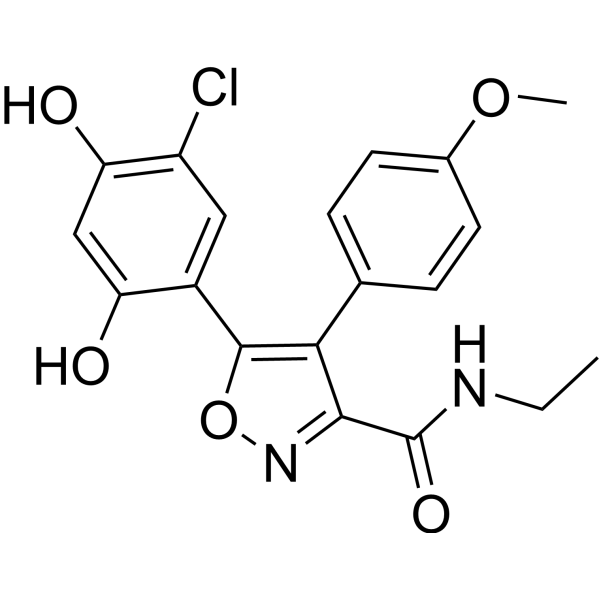
HY-15984
VER-50589Apoptosis Inducer -
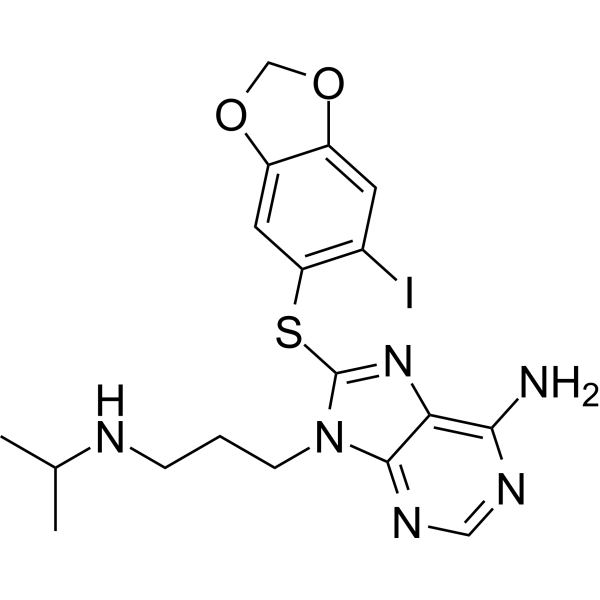
HY-11038
ZelavespibHsp90 Inhibitor -
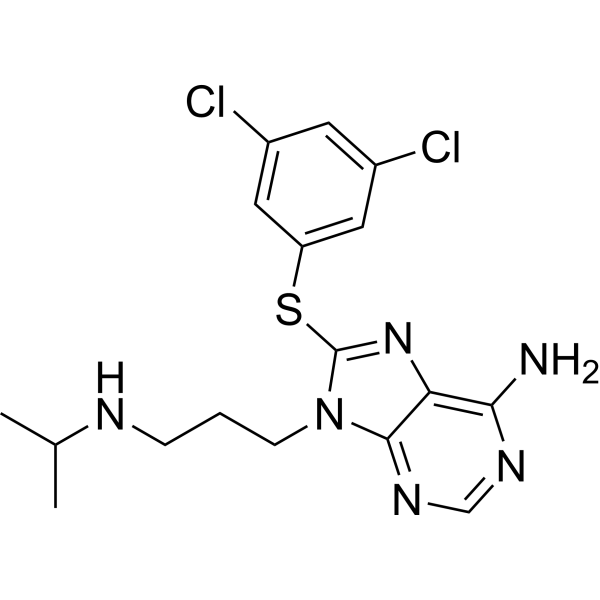
HY-18680
PU-WS13


Biological Activity
Description
|
HSP90 1.1 nM (IC50) |
HSP90 0.2 nM (Ki) |
NLRP3 99 nM (IC50) |
Cellular Effect
|
Cell Line

|
Type | Value | Description | References |
|---|---|---|---|---|
| MCF7 | EC50 |
6.5 nM
|
Induction of HER2 degradation in human MCF-7 breast cancer cells incubated for 16 hrs with EC144 and quantified by flow cytometry.
Induction of HER2 degradation in human MCF-7 breast cancer cells incubated for 16 hrs with EC144 and quantified by flow cytometry.
|
21131419 |
| RAW264.7 | EC50 |
20 nM
|
Inhibition of LPS-stimulated TNF-alpha production in mouse RAW 264.7 macrophage-like cells pre-incubated with EC144 for 4 hrs then stimulated with LPS for 4 hrs, quantified by ELISA.
Inhibition of LPS-stimulated TNF-alpha production in mouse RAW 264.7 macrophage-like cells pre-incubated with EC144 for 4 hrs then stimulated with LPS for 4 hrs, quantified by ELISA.
|
21131419 |
| RAW264.7 | EC50 |
17.4 nM
|
Inhibition of LPS-stimulated Eotaxin production in mouse RAW 264.7 macrophage-like cells pre-incubated with EC144 for 4 hrs then stimulated with LPS for 8 hrs, quantified by RodentMAP multiplex cytokine array.
Inhibition of LPS-stimulated Eotaxin production in mouse RAW 264.7 macrophage-like cells pre-incubated with EC144 for 4 hrs then stimulated with LPS for 8 hrs, quantified by RodentMAP multiplex cytokine array.
|
21131419 |
| RAW264.7 | EC50 |
45.4 nM
|
Inhibition of LPS-stimulated FGF basic production in mouse RAW 264.7 macrophage-like cells pre-incubated with EC144 for 4 hrs then stimulated with LPS for 8 hrs, quantified by RodentMAP multiplex cytokine array.
Inhibition of LPS-stimulated FGF basic production in mouse RAW 264.7 macrophage-like cells pre-incubated with EC144 for 4 hrs then stimulated with LPS for 8 hrs, quantified by RodentMAP multiplex cytokine array.
|
21131419 |
| RAW264.7 | EC50 |
14.7 nM
|
Inhibition of LPS-stimulated GM-CSF production in mouse RAW 264.7 macrophage-like cells pre-incubated with EC144 for 4 hrs then stimulated with LPS for 8 hrs, quantified by RodentMAP multiplex cytokine array.
Inhibition of LPS-stimulated GM-CSF production in mouse RAW 264.7 macrophage-like cells pre-incubated with EC144 for 4 hrs then stimulated with LPS for 8 hrs, quantified by RodentMAP multiplex cytokine array.
|
21131419 |
| RAW264.7 | EC50 |
21.1 nM
|
Inhibition of LPS-stimulated M-CSF production in mouse RAW 264.7 macrophage-like cells pre-incubated with EC144 for 4 hrs then stimulated with LPS for 8 hrs, quantified by RodentMAP multiplex cytokine array.
Inhibition of LPS-stimulated M-CSF production in mouse RAW 264.7 macrophage-like cells pre-incubated with EC144 for 4 hrs then stimulated with LPS for 8 hrs, quantified by RodentMAP multiplex cytokine array.
|
21131419 |
| RAW264.7 | EC50 |
22.2 nM
|
Inhibition of LPS-stimulated MMP-9 production in mouse RAW 264.7 macrophage-like cells pre-incubated with EC144 for 4 hrs then stimulated with LPS for 8 hrs, quantified by RodentMAP multiplex cytokine array.
Inhibition of LPS-stimulated MMP-9 production in mouse RAW 264.7 macrophage-like cells pre-incubated with EC144 for 4 hrs then stimulated with LPS for 8 hrs, quantified by RodentMAP multiplex cytokine array.
|
21131419 |
| RAW264.7 | EC50 |
20.1 nM
|
Inhibition of LPS-stimulated TNF-alpha production in mouse RAW 264.7 macrophage-like cells pre-incubated with EC144 for 4 hrs then stimulated with LPS for 8 hrs, quantified by RodentMAP multiplex cytokine array.
Inhibition of LPS-stimulated TNF-alpha production in mouse RAW 264.7 macrophage-like cells pre-incubated with EC144 for 4 hrs then stimulated with LPS for 8 hrs, quantified by RodentMAP multiplex cytokine array.
|
21131419 |
| RAW264.7 | EC50 |
29.5 nM
|
Inhibition of LPS-stimulated IL-1alpha production in mouse RAW 264.7 macrophage-like cells pre-incubated with EC144 for 4 hrs then stimulated with LPS for 8 hrs, quantified by RodentMAP multiplex cytokine array.
Inhibition of LPS-stimulated IL-1alpha production in mouse RAW 264.7 macrophage-like cells pre-incubated with EC144 for 4 hrs then stimulated with LPS for 8 hrs, quantified by RodentMAP multiplex cytokine array.
|
21131419 |
| RAW264.7 | EC50 |
20.5 nM
|
Inhibition of LPS-stimulated IL-6 production in mouse RAW 264.7 macrophage-like cells pre-incubated with EC144 for 4 hrs then stimulated with LPS for 8 hrs, quantified by RodentMAP multiplex cytokine array.
Inhibition of LPS-stimulated IL-6 production in mouse RAW 264.7 macrophage-like cells pre-incubated with EC144 for 4 hrs then stimulated with LPS for 8 hrs, quantified by RodentMAP multiplex cytokine array.
|
21131419 |
| RAW264.7 | EC50 |
19.7 nM
|
Inhibition of LPS-stimulated IL-10 production in mouse RAW 264.7 macrophage-like cells pre-incubated with EC144 for 4 hrs then stimulated with LPS for 8 hrs, quantified by RodentMAP multiplex cytokine array.
Inhibition of LPS-stimulated IL-10 production in mouse RAW 264.7 macrophage-like cells pre-incubated with EC144 for 4 hrs then stimulated with LPS for 8 hrs, quantified by RodentMAP multiplex cytokine array.
|
21131419 |
| RAW264.7 | EC50 |
40.0 nM
|
Inhibition of LPS-stimulated IL-11 production in mouse RAW 264.7 macrophage-like cells pre-incubated with EC144 for 4 hrs then stimulated with LPS for 8 hrs, quantified by RodentMAP multiplex cytokine array.
Inhibition of LPS-stimulated IL-11 production in mouse RAW 264.7 macrophage-like cells pre-incubated with EC144 for 4 hrs then stimulated with LPS for 8 hrs, quantified by RodentMAP multiplex cytokine array.
|
21131419 |
| RAW264.7 | EC50 |
17.8 nM
|
Inhibition of LPS-stimulated LIF production in mouse RAW 264.7 macrophage-like cells pre-incubated with EC144 for 4 hrs then stimulated with LPS for 8 hrs, quantified by RodentMAP multiplex cytokine array.
Inhibition of LPS-stimulated LIF production in mouse RAW 264.7 macrophage-like cells pre-incubated with EC144 for 4 hrs then stimulated with LPS for 8 hrs, quantified by RodentMAP multiplex cytokine array.
|
21131419 |
| RAW264.7 | EC50 |
39.4 nM
|
Inhibition of LPS-stimulated Oncostatin M production in mouse RAW 264.7 macrophage-like cells pre-incubated with EC144 for 4 hrs then stimulated with LPS for 8 hrs, quantified by RodentMAP multiplex cytokine array.
Inhibition of LPS-stimulated Oncostatin M production in mouse RAW 264.7 macrophage-like cells pre-incubated with EC144 for 4 hrs then stimulated with LPS for 8 hrs, quantified by RodentMAP multiplex cytokine array.
|
21131419 |
| RAW264.7 | EC50 |
42.5 nM
|
Inhibition of LPS-stimulated SCF production in mouse RAW 264.7 macrophage-like cells pre-incubated with EC144 for 4 hrs then stimulated with LPS for 8 hrs, quantified by RodentMAP multiplex cytokine array.
Inhibition of LPS-stimulated SCF production in mouse RAW 264.7 macrophage-like cells pre-incubated with EC144 for 4 hrs then stimulated with LPS for 8 hrs, quantified by RodentMAP multiplex cytokine array.
|
21131419 |
| RAW264.7 | EC50 |
23.1 nM
|
Inhibition of LPS-stimulated Tissue factor production in mouse RAW 264.7 macrophage-like cells pre-incubated with EC144 for 4 hrs then stimulated with LPS for 8 hrs, quantified by RodentMAP multiplex cytokine array.
Inhibition of LPS-stimulated Tissue factor production in mouse RAW 264.7 macrophage-like cells pre-incubated with EC144 for 4 hrs then stimulated with LPS for 8 hrs, quantified by RodentMAP multiplex cytokine array.
|
21131419 |
| RAW264.7 | EC50 |
19.8 nM
|
Inhibition of LPS-stimulated IP-10 production in mouse RAW 264.7 macrophage-like cells pre-incubated with EC144 for 4 hrs then stimulated with LPS for 8 hrs, quantified by RodentMAP multiplex cytokine array.
Inhibition of LPS-stimulated IP-10 production in mouse RAW 264.7 macrophage-like cells pre-incubated with EC144 for 4 hrs then stimulated with LPS for 8 hrs, quantified by RodentMAP multiplex cytokine array.
|
21131419 |
| RAW264.7 | EC50 |
12.7 nM
|
Inhibition of LPS-stimulated MDC production in mouse RAW 264.7 macrophage-like cells pre-incubated with EC144 for 4 hrs then stimulated with LPS for 8 hrs, quantified by RodentMAP multiplex cytokine array.
Inhibition of LPS-stimulated MDC production in mouse RAW 264.7 macrophage-like cells pre-incubated with EC144 for 4 hrs then stimulated with LPS for 8 hrs, quantified by RodentMAP multiplex cytokine array.
|
21131419 |
| RAW264.7 | EC50 |
20.8 nM
|
Inhibition of LPS-stimulated MCP-1 production in mouse RAW 264.7 macrophage-like cells pre-incubated with EC144 for 4 hrs then stimulated with LPS for 8 hrs, quantified by RodentMAP multiplex cytokine array.
Inhibition of LPS-stimulated MCP-1 production in mouse RAW 264.7 macrophage-like cells pre-incubated with EC144 for 4 hrs then stimulated with LPS for 8 hrs, quantified by RodentMAP multiplex cytokine array.
|
21131419 |
| RAW264.7 | EC50 |
24.0 nM
|
Inhibition of LPS-stimulated MCP-3 production in mouse RAW 264.7 macrophage-like cells pre-incubated with EC144 for 4 hrs then stimulated with LPS for 8 hrs, quantified by RodentMAP multiplex cytokine array.
Inhibition of LPS-stimulated MCP-3 production in mouse RAW 264.7 macrophage-like cells pre-incubated with EC144 for 4 hrs then stimulated with LPS for 8 hrs, quantified by RodentMAP multiplex cytokine array.
|
21131419 |
| RAW264.7 | EC50 |
22.1 nM
|
Inhibition of LPS-stimulated MIP-1alpha production in mouse RAW 264.7 macrophage-like cells pre-incubated with EC144 for 4 hrs then stimulated with LPS for 8 hrs, quantified by RodentMAP multiplex cytokine array.
Inhibition of LPS-stimulated MIP-1alpha production in mouse RAW 264.7 macrophage-like cells pre-incubated with EC144 for 4 hrs then stimulated with LPS for 8 hrs, quantified by RodentMAP multiplex cytokine array.
|
21131419 |
| RAW264.7 | EC50 |
21.4 nM
|
Inhibition of LPS-stimulated MIP-1beta production in mouse RAW 264.7 macrophage-like cells pre-incubated with EC144 for 4 hrs then stimulated with LPS for 8 hrs, quantified by RodentMAP multiplex cytokine array.
Inhibition of LPS-stimulated MIP-1beta production in mouse RAW 264.7 macrophage-like cells pre-incubated with EC144 for 4 hrs then stimulated with LPS for 8 hrs, quantified by RodentMAP multiplex cytokine array.
|
21131419 |
| RAW264.7 | EC50 |
21.7 nM
|
Inhibition of LPS-stimulated MIP-3beta production in mouse RAW 264.7 macrophage-like cells pre-incubated with EC144 for 4 hrs then stimulated with LPS for 8 hrs, quantified by RodentMAP multiplex cytokine array.
Inhibition of LPS-stimulated MIP-3beta production in mouse RAW 264.7 macrophage-like cells pre-incubated with EC144 for 4 hrs then stimulated with LPS for 8 hrs, quantified by RodentMAP multiplex cytokine array.
|
21131419 |
| RAW264.7 | EC50 |
23.0 nM
|
Inhibition of LPS-stimulated RANTES production in mouse RAW 264.7 macrophage-like cells pre-incubated with EC144 for 4 hrs then stimulated with LPS for 8 hrs, quantified by RodentMAP multiplex cytokine array.
Inhibition of LPS-stimulated RANTES production in mouse RAW 264.7 macrophage-like cells pre-incubated with EC144 for 4 hrs then stimulated with LPS for 8 hrs, quantified by RodentMAP multiplex cytokine array.
|
21131419 |
| RAW264.7 | EC50 |
25.2 nM
|
Inhibition of LPS-stimulated TIMP-1 production in mouse RAW 264.7 macrophage-like cells pre-incubated with EC144 for 4 hrs then stimulated with LPS for 8 hrs, quantified by RodentMAP multiplex cytokine array.
Inhibition of LPS-stimulated TIMP-1 production in mouse RAW 264.7 macrophage-like cells pre-incubated with EC144 for 4 hrs then stimulated with LPS for 8 hrs, quantified by RodentMAP multiplex cytokine array.
|
21131419 |
| BMDM | IC50 |
99 nM
|
Inhibition of LPS and nigericin-induced ASC speck formation in ASC-mCherry-expressing immortalized bone marrow-derived macrophages when added together with LPS during priming, measured by imaging with a GE IN Cell Analyzer 6000.
Inhibition of LPS and nigericin-induced ASC speck formation in ASC-mCherry-expressing immortalized bone marrow-derived macrophages when added together with LPS during priming, measured by imaging with a GE IN Cell Analyzer 6000.
|
32954500 |
| BMDM | IC50 |
170 nM
|
Inhibition of LPS and nigericin-induced ASC speck formation in ASC-mCherry-expressing immortalized bone marrow-derived macrophages when added after LPS before nigericin activation, measured by imaging with a GE IN Cell Analyzer 6000.
Inhibition of LPS and nigericin-induced ASC speck formation in ASC-mCherry-expressing immortalized bone marrow-derived macrophages when added after LPS before nigericin activation, measured by imaging with a GE IN Cell Analyzer 6000.
|
32954500 |
| BMDM | IC50 |
150 nM
|
Inhibition of LPS and nigericin-induced caspase-1 activation in ASC-mCherry-expressing immortalized bone marrow-derived macrophages assessed by caspase-1 Glo assay.
Inhibition of LPS and nigericin-induced caspase-1 activation in ASC-mCherry-expressing immortalized bone marrow-derived macrophages assessed by caspase-1 Glo assay.
|
32954500 |
| MCF7 | EC50 |
14 nM
|
Induction of Her-2 degradation in human MCF-7 breast cancer cells monitored with extracellular-directed fluorescent antibodies and flow cytometry.
Induction of Her-2 degradation in human MCF-7 breast cancer cells monitored with extracellular-directed fluorescent antibodies and flow cytometry.
|
22938030 |
In Vitro
EC144-mediated HSP90 inhibition (1 μM; 12-24 h) increases WNV replicon genomic RNA abundance and induces HSP70A mRNA in Huh7 WNV replicon cells[4].
EC144 (1 μM; 12-24 h) inhibits HSP90 activity in Huh7 WNV replicon cells, leading to reduced abundance of HSP90 client kinases without affecting viral NS protein abundance[4].
EC144 (1 μM; 12 h) inhibits HSP90 activity during WNV-TX infection in Vero cells, reducing the abundance of HSP90 client kinases without decreasing viral protein levels[4].
EC144 (1 μM; 12 h) inhibits HSP90 activity during ZIKV Fortaleza infection in Vero cells, reducing the abundance of HSP90 client kinases without decreasing viral protein levels[4].
MedChemExpress (MCE) has not independently confirmed the accuracy of these methods. They are for reference only.
-
Cell Line:RAW 264.7
-
Concentration:1000, 333, 111, 37, 12, 4 nM
-
Incubation Time:4 h (pre-incubation); 30 min
-
Result:Resulted in a dose-dependent decrease of phospho-ERK1/2 and phospho-JNK1/2.
Levels of phospho-p38 MAPK were also mildly decreased.
Markedly decreased MEK1/2 phosphorylation in a dose-dependent manner but did not alter levels of total MEK1/2, ERK1/2, JNK1/2, or p38 MAPK.
-
Cell Line:RAW 264.7
-
Concentration:10 or 1 μM
-
Incubation Time:4 h (pre-incubation); 30 min
-
Result:No decrease in NF-κB p50 binding activity relative to DMSO-treated, LPS-stimulated control cells was found.
-
Cell Line:Rat nucleus pulposus cells (NPCs)
-
Concentration:100-500 nM
-
Incubation Time:36 h
-
Result:Partially reversed the M1-CM-induced elevated levels of Il1b, Il6, Tnf, Ccl2, and Ccl5.\nMarkedly decreased the mRNA levels of Mmp2, Mmp3, Mmp9, and Mmp13.
Prevented the M1-CM-induced decline of Col2a1 levels.
-
Cell Line:Rat nucleus pulposus cells (NPCs)
-
Concentration:100-500 nM
-
Incubation Time:36 h
-
Result:Dose-dependently increased the expression of HSP70.
Did not dramatically modify the levels of HSP90α and HSP90β.\nImpeded the activation of the JAK2-STAT3 pathway.
Confirmed that JAK2 and STAT3 specifically interacted with molecular chaperone HSP90.
-
Cell Line:ASC-mCherry iBMDMs
-
Concentration:10 µM
-
Incubation Time:2 h (LPS) + 2 h (nigericin)
-
Result:Inhibited both IL-1β release and cell death.
-
Cell Line:Huh7 WNV replicon cells
-
Concentration:1 μM
-
Incubation Time:24 h
-
Result:Altered the localization of NS1 and dsRNA relative to NS3 and NS5, causing NS1 and dsRNA to shift from co-localization with the NS proteins to distribute as bright foci directly adjacent to NS3 and NS5.
-
Cell Line:Huh7 WNV replicon cells
-
Concentration:1 μM
-
Incubation Time:12-24 h
-
Result:Significantly increased WNV replicon genomic RNA (gRNA) abundance by 24 h.
Significantly induced HSP70A mRNA.
-
Cell Line:Huh7 WNV replicon cells
-
Concentration:1 μM
-
Incubation Time:12-24 h
-
Result:Caused reduced abundance of the HSP90 client kinases Akt and ErbB2, but did not cause a decrease in replicon NS proteins.
-
Cell Line:Vero cells infected with WNV-TX
-
Concentration:1 μM
-
Incubation Time:12 h
-
Result:Decreased Akt and ErbB2 abundance, though little change to viral proteins (WNV E, NS1, NS5) was detected.
-
Cell Line:Vero cells infected with ZIKV Fortaleza
-
Concentration:1 μM
-
Incubation Time:12 h
-
Result:Decreased Akt and ErbB2 abundance, though little change to viral proteins (ZIKV E, NS1, NS3, NS5) was detected.
Quantification of band intensity showed that ZIKV protein levels did not decrease during HSP90 inhibition.
Parmacokinetics
| Species | Dose | Route | Cmax | Tmax | AUC | T1/2 | Plasma Concentration | Brain Concentration | Tmax (Plasma) | AUCinf | T1/2 (Plasma) |
|---|---|---|---|---|---|---|---|---|---|---|---|
| Mice[1] | 5 mg/kg | p.o. | 835.3 ng/mL | / | / | / | / | / | 1 h | 2135.6 ng·h/mL | 1.5 h |
| Rat[1] | 5 mg/kg | p.o. | / | / | / | 5 h | / | / | / | / | / |
| Mice[4] | 30 mg/kg | p.o. | / | / | / | / | 85 ng/mL | 1293 ng/g | / | / | / |
| Mice[6] | 25 mg/kg | p.o. | 1556 ng/mL | 0.5 h | 4419 ng·h/mL | 1.5 h | / | / | / | / | / |
In Vivo
EC144 (5-10 mg/kg; p.o.; every other day) dose-dependently decreases disease severity in mouse CIA and suppresses the Ag-specific Ab response[1].
MedChemExpress (MCE) has not independently confirmed the accuracy of these methods. They are for reference only.
-
Animal Model:DBA/1 (female)[1]
-
Dosage:2.5, 5, and 10 mg/kg
-
Administration:p.o.; two gavages given 3 h apart
-
Result:Produced a significant decrease in serum TNF-α induction at 2.5, 5, and 10 mg/kg.
-
Animal Model:DA (female)[1]
-
Dosage:1.5 mg/kg (daily); 0.5 mg/kg (daily); 5 mg/kg (every third day); 1.5 mg/kg (every third day)
-
Administration:p.o.; daily or every third day; starting on day 12
-
Result:Developed little or no disease symptoms at 1.5 mg/kg daily or 5 mg/kg every third day.
Completely abrogated expression of mRNAs of proinflammatory cytokines TNF-α, IL-1β, and IL-6 at 5 mg/kg every third day.
-
Animal Model:DBA/1 LacJ (female)[1]
-
Dosage:5, 8, and 10 mg/kg
-
Administration:p.o.; every other day; beginning on day 21
-
Result:Reduced disease incidence from 90 to 60% and reduced disease severity from a clinical score of 12 to 4 at 8 or 10 mg/kg.
Significantly decreased anti-chicken CII IgG1 and IgG2a levels at 8 mg/kg.
Showed minimal joint inflammation and an absence of cartilage and synovial lining damage and bone erosion at 10 mg/kg.
-
Animal Model:DBA/1 (female) bearing acute systemic inflammation[1]
-
Dosage:10 mg/kg
-
Administration:p.o.; once daily; 3 days
-
Result:Dramatically lower levels of phospho-MEK1/2 and phospho-ERK1/2 in LPS-stimulated CD11b+ PECs.
Phosphorylated Tpl2 was not detected in LPS-stimulated CD11b+ PECs.
-
Animal Model:C57BL6/J (male, 8-10 weeks old)[4]
-
Dosage:10-30 mg/kg; 0.1-10 mg/kg (repeat experiment)
-
Administration:p.o.; single dose
-
Result:Completely inhibited inflammasome-dependent IL-1β release at 10, 20, and 30 mg/kg.
Reduced IL-6 levels at 10, 20, and 30 mg/kg.
Achieved plasma concentrations of 46 ng/mL, 69 ng/mL, and 85 ng/mL for 10, 20, and 30 mg/kg doses, respectively.
Achieved brain concentrations of 448 ng/g, 1313 ng/g, and 1293 ng/g for 10, 20, and 30 mg/kg doses, respectively.
Was ineffective at 0.1 or 1 mg/kg and had a minimal effective dose of 10 mg/kg.
-
Animal Model:B6D2F1 (female)[6]
-
Dosage:30 mg/kg
-
Administration:p.o.; single dose
-
Result:Significantly increased Hsp70 levels in whole brain homogenates at 30 mg/kg or higher compared to vehicle.


Chemical Information
-
CAS No. 911397-80-3
-
Appearance Solid
-
Molecular Weight 413.90
-
Formula C21H24ClN5O2
-
Color Light brown to brown
-
SMILES
CC(O)(C)CC#CC1=CN(CC2=NC=C(C)C(OC)=C2C)C3=NC(N)=NC(Cl)=C31
-
Shipping
Room temperature in continental US; may vary elsewhere.
-
Storage
4°C, sealed storage, away from moisture and light
* In solvent : -80°C, 6 months; -20°C, 1 month (sealed storage, away from moisture and light)


Solvent & Solubility
In Vitro:
DMSO : 66.67 mg/mL (161.08 mM; Need ultrasonic; Hygroscopic DMSO has a significant impact on the solubility of product, please use newly opened DMSO)
Please refer to the solubility information to select the appropriate solvent. Once prepared, please aliquot and store the solution to prevent product inactivation from repeated freeze-thaw cycles.
Storage method and period of stock solution: -80°C, 6 months; -20°C, 1 month (sealed storage, away from moisture and light). When stored at -80°C, please use it within 6 months. When stored at -20°C, please use it within 1 month.
Please refer to the solubility information to select the appropriate solvent. Once prepared, please aliquot and store the solution to prevent product inactivation from repeated freeze-thaw cycles.
Storage method and period of stock solution: -80°C, 6 months; -20°C, 1 month (sealed storage, away from moisture and light). When stored at -80°C, please use it within 6 months. When stored at -20°C, please use it within 1 month.
Concentration (start) × Volume (start) = Concentration (final) × Volume (final)
In Vivo:
Select the appropriate dissolution method based on your experimental animal and administration route.
- For the following dissolution methods, please ensure to first prepare a clear stock solution using an In Vitro approach and then sequentially add co-solvents:
- To ensure reliable experimental results, the clarified stock solution can be appropriately stored based on storage conditions. As for the working solution for In Vivo experiments, it is recommended to prepare freshly and use it on the same day.
- The percentages shown for the solvents indicate their volumetric ratio in the final prepared solution. If precipitation or phase separation occurs during preparation, heat and/or sonication can be used to aid dissolution.
Add each solvent one by one: 10% DMSO 40% PEG300 5% Tween-80 45% Saline
Solubility: ≥ 2.5 mg/mL (6.04 mM); Clear solution
This protocol yields a clear solution of ≥ 2.5 mg/mL (saturation unknown).
Taking 1 mL working solution as an example, add 100 μL DMSO stock solution (25.0 mg/mL) to 400 μL PEG300, and mix evenly; then add 50 μL Tween-80 and mix evenly; then add 450 μL Saline to adjust the volume to 1 mL.
Preparation of Saline: Dissolve 0.9 g sodium chloride in ddH₂O and dilute to 100 mL to obtain a clear Saline solution.
Add each solvent one by one: 10% DMSO 90% (20% SBE-β-CD in Saline)
Solubility: 2.5 mg/mL (6.04 mM); Suspended solution; Need ultrasonic
This protocol yields a suspended solution of 2.5 mg/mL. Suspended solution can be used for oral and intraperitoneal injection.
Taking 1 mL working solution as an example, add 100 μL DMSO stock solution (25.0 mg/mL) to 900 μL 20% SBE-β-CD in Saline, and mix evenly.
Preparation of 20% SBE-β-CD in Saline (4°C, storage for one week): 2 g SBE-β-CD powder is dissolved in 10 mL Saline, completely dissolve until clear.
In Vivo Dissolution Calculator
Please enter the basic information of animal experiments:
-
-
-
-
Recommended: Prepare an additional quantity of animals to account for potential losses during experiments.
Please enter your animal formula composition:
-
%DMSO +
Recommended: Keep the proportion of DMSO in working solution below 2% if your animal is weak.
-
%+
-
+%Tween-80 + +
-
%Saline +
The co-solvents required include: DMSO, . All of co-solvents are available by MedChemExpress (MCE). , Tween 80. All of co-solvents are available by MedChemExpress (MCE).
Working solution concentration: 0.22 mg/mL
Method for preparing stock solution: mg drug dissolved in μL DMSO. Stock solution concentration: mg/mL. * In solvent : -80°C, 6 months; -20°C, 1 month (sealed storage, away from moisture and light)
1. Take μL DMSO stock solution;
2. Add μL .
μL , mix evenly;
3. Then add μL Tween 80, mix evenly;
4. Then add μL
Please ensure that the stock solution in the first step is dissolved to a clear state, and add co-solvents in sequence. You can use ultrasonic heating (ultrasonic cleaner, recommended frequency 20-40 kHz), vortexing, etc. to assist dissolution.


Purity & Documentation
-
Data Sheet (315 KB)
-
SDS (252 KB)
- English - EN (252 KB)
- Français - FR (252 KB)
- Deutsch - DE (252 KB)
- Norwegian - NO (252 KB)
- Español - ES (252 KB)
- Swedish - SV (252 KB)
- Italian - IT (252 KB)
- Korean - KR (252 KB)
- Portuguese - PT (252 KB)
-
Handling Instructions (2659 KB)
References


Complete Stock Solution Preparation Table
Please refer to the solubility information to select the appropriate solvent. Once prepared, please aliquot and store the solution to prevent product inactivation from repeated freeze-thaw cycles.
Storage method and period of stock solution: -80°C, 6 months; -20°C, 1 month (sealed storage, away from moisture and light). When stored at -80°C, please use it within 6 months. When stored at -20°C, please use it within 1 month.
| Optional Solvent | Concentration Solvent Mass | 1 mg | 5 mg | 10 mg | 25 mg |
|---|---|---|---|---|---|
| DMSO | 1 mM | 2.4160 mL | 12.0802 mL | 24.1604 mL | 60.4011 mL |
| 5 mM | 0.4832 mL | 2.4160 mL | 4.8321 mL | 12.0802 mL | |
| 10 mM | 0.2416 mL | 1.2080 mL | 2.4160 mL | 6.0401 mL | |
| 15 mM | 0.1611 mL | 0.8053 mL | 1.6107 mL | 4.0267 mL | |
| 20 mM | 0.1208 mL | 0.6040 mL | 1.2080 mL | 3.0201 mL | |
| 25 mM | 0.0966 mL | 0.4832 mL | 0.9664 mL | 2.4160 mL | |
| 30 mM | 0.0805 mL | 0.4027 mL | 0.8053 mL | 2.0134 mL | |
| 40 mM | 0.0604 mL | 0.3020 mL | 0.6040 mL | 1.5100 mL | |
| 50 mM | 0.0483 mL | 0.2416 mL | 0.4832 mL | 1.2080 mL | |
| 60 mM | 0.0403 mL | 0.2013 mL | 0.4027 mL | 1.0067 mL | |
| 80 mM | 0.0302 mL | 0.1510 mL | 0.3020 mL | 0.7550 mL | |
| 100 mM | 0.0242 mL | 0.1208 mL | 0.2416 mL | 0.6040 mL |


EC144 Related Classifications
HY-13479 Related Classifications
 Powered by Bioz