



Tris(2-chloroethyl) phosphate
Based on 6 publication(s) in Google Scholar
Tris(2-chloroethyl) phosphate (TCEP) is a widely used organic phosphorus flame retardant, mainly used as a plasticizer. Tris(2-chloroethyl) phosphate has orally active hepatotoxicity, inducing an increase in reactive oxygen species (ROS) and calcium ions (Ca2+) influx, a decrease in mitochondrial membrane potential (△Ψm), and causing DNA damage and cell apoptosis. Tris(2-chloroethyl) phosphate directly binds to FXR, inducing obesity and the formation of fatty liver in mice. Chloroethyl) phosphate activates the TLR4/NF-κB pathway, triggering liver inflammation.
For research use only. We do not sell to patients.
- Purity : 97.07%
- CAS No.: 115-96-8
- Formula: C6H12Cl3O4P
- Molecular Weight:285.49
-
Storage:
Store at room temperature 3 years.
In solvent -80°C, 2 years , -20°C, 1 year


To place orders, for customer services and technical support, please contact: MedChemExpress USA
Tel: 609-228-6898 E-mail: [email protected] [email protected]


-
 Biological Activity
-
Chemical Information
-
Solvent & Solubility
- Protocols
- Purity & Documentation
- References
-
 Help & FAQs


-
HY-116677
Tris(benzyltriazolylmethyl)amineBiochemical Tool -

HY-Y1322
Triphenyl phosphateEndocrine Disruptor -

HY-W016414
Triethyl phosphateSmooth Muscle Relaxant -
HY-108712
TDCPPFlame Retardant -

HY-W011086
Tri-O-tolyl phosphateBiochemical Reagent -

HY-Y1878
Copper(Ⅱ) sulfateBiochemical Reagent -

HY-108712R
TDCPP (Standard)Flame Retardant -
HY-N0322
Cholesterol (from animal)ERRα Agonist -

HY-W250743
Cresyl diphenyl phosphate -
HY-151857
TAMRA azide, 5-isomerAzide Compound -
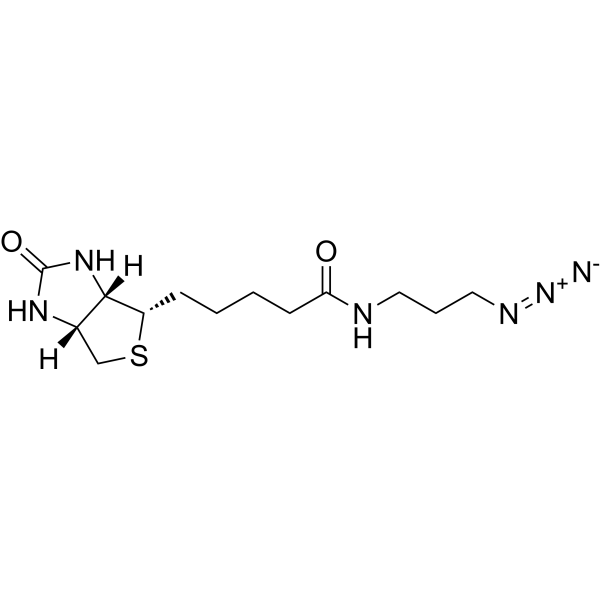
HY-129832
Biotin-azideClick Chemical Reagent -

HY-W010929
PYR14-TFSIBiochemical Assay Reagent
Publications Citing Use of MedChemExpress (MCE) Tris(2-chloroethyl) phosphate
MoreAll DNA/RNA Synthesis Isoforms
MoreAll Calcium Channel Isoforms
More

Biological Activity
Description
In Vitro
Tris(2-chloroethyl) phosphate (100-400 μM, 3 days) induces the death of HepG2 cells by disrupting mitochondrial function and the integrity of lysosomal membranes[3].
Tris(2-chloroethyl) phosphate (100-400 μM, 3 days) causes dose-dependent DNA strand breaks, induces ROS/NO bursts, Ca²⁺ influx and △Ψm collapse in HepG2 cells, and triggers apoptosis[3].
Tris(2-chloroethyl) phosphate (100 μM, 3 days) upregulates oncogenes such as IGFBP5 and STMN1, and downregulates tumor suppressor genes such as SNAI1 in HepG2 cells[3].
MedChemExpress (MCE) has not independently confirmed the accuracy of these methods. They are for reference only. Further protocols information, click here.
-
Cell Line:HepG2 cells
-
Concentration:100, 200 and 400 μM
-
Incubation Time:3 d
-
Result:Significantly induced apoptosis, the proportion of the SubG1 peak reached 65.96% in the 400 μM group.
In Vivo
Tris(2-chloroethyl) phosphate (20-60 mg/kg, i.g., once daily for 9 weeks) induces obesity and hepatic steatosis in mice through the FXR signaling pathway[2].
MedChemExpress (MCE) has not independently confirmed the accuracy of these methods. They are for reference only.
-
Animal Model:Toxicity test models model established in male CD-1 mice (4-6 weeks old, 20-25 g)[2]
-
Dosage:20 and 60 mg/kg
-
Administration:Oral gavage (i.g.), once daily for 9 weeks
-
Result:Promoted weight gain, expansion of adipose tissue and elevation of serum lipids. Directly combined and inhibited FXR, thereby down-regulating SHP, activating the SREBP1c/PPARγ lipogenesis pathway, and inhibiting fatty acid oxidation mediated by PPARα.
Clinical Trial
| NCT Number | Sponsor | Condition | Start Date |
Phase

|
|---|---|---|---|---|
| NCT01329991 | Plexxikon| | 2011-05 | PHASE1 |


Chemical Information
-
CAS No. 115-96-8
-
Appearance Liquid (Density: 1.425 g/cm3)
-
Molecular Weight 285.49
-
Formula C6H12Cl3O4P
-
Color Colorless to light yellow
-
SMILES
O=P(OCCCl)(OCCCl)OCCCl
-
Synonyms
TCEP
-
Shipping
Room temperature in continental US; may vary elsewhere.
-
Storage
Store at room temperature 3 years
In solvent -80°C 2 years -20°C 1 year


Publications (6)
-
Journal Impact Factor
-
Most Recent
-
-
Adv Healthc Mater
Oral Administration of Trifluoroacetyl Chitosan-Encapsulated Redshifted Immunofluorophore for NIR-II Bioimaging of Colorectal Metastases. [Abstract]2025 Oct 15:e01877. PMID: 41097850 -
Int J Biol Macromol
Bacterial cellulose membrane integrating phase-transited lysozyme nanofilm loaded with biguanides for dressing treatment of atopic dermatitis. [Abstract]2025 Aug 21;323(Pt 1):147047. PMID: 40848785 -
Neural Regen Res
2025 Oct 30. PMID: 41169225 -
Commun Chem
Stepped collisional energy improves protein acylation identification by eliminating positional bias of cyclic immonium ions. [Abstract]2025 Dec 9. PMID: 41366033 -


Solvent & Solubility
In Vitro:
DMSO : 200 mg/mL (700.55 mM; Need ultrasonic; Hygroscopic DMSO has a significant impact on the solubility of product, please use newly opened DMSO)
Please refer to the solubility information to select the appropriate solvent. Once prepared, please aliquot and store the solution to prevent product inactivation from repeated freeze-thaw cycles.
Storage method and period of stock solution: -80°C, 2 years; -20°C, 1 year. When stored at -80°C, please use it within 2 years. When stored at -20°C, please use it within 1 year.
Please refer to the solubility information to select the appropriate solvent. Once prepared, please aliquot and store the solution to prevent product inactivation from repeated freeze-thaw cycles.
Storage method and period of stock solution: -80°C, 2 years; -20°C, 1 year. When stored at -80°C, please use it within 2 years. When stored at -20°C, please use it within 1 year.
Concentration (start) × Volume (start) = Concentration (final) × Volume (final)

Protocols
-
Mitochondrial membrane-potential fluorescent assay
Mitochondrial membrane potential fluorescent assays estimate ΔΨm in living cells using lipophilic cationic dyes such as TMRM, TMRE, rhodamine 123, and JC-1, which accumulate in mitochondria according to membrane polarization; loss of signal after FCCP or CCCP treatment is interpreted as mitochondrial depolarization. TMRM/TMRE and rhodamine 123 are commonly used for semi-quantitative live-cell microscopy or flow cytometry, while JC-1 can report a shift from red aggregate fluorescence to green monomer fluorescence during depolarization; interpretation requires controls because dye concentration, quenching mode, cell type, dye efflux, and mitochondrial mass can affect fluorescence independently of ΔΨm.
-
Annexin V plus membrane-impermeant dye apoptosis staining
Annexin V-based apoptosis assays rely on the detection of phosphatidylserine (PS) externalization from the inner leaflet of the plasma membrane to the outer leaflet, an early biochemical hallmark of apoptosis. Fluorescently labeled Annexin V binds PS in a calcium-dependent manner, enabling identification of early apoptotic cells by flow cytometry or fluorescence microscopy. When combined with a membrane-impermeant DNA-binding dye (e. g. , propidium iodide), this approach allows discrimination between viable (Annexin V−/dye−), early apoptotic (Annexin V+/dye−), and late apoptotic or necrotic (Annexin V+/dye+) cell populations by assessing membrane integrity and PS exposure.
-
ROS/oxidative-stress fluorescent staining
ROS/oxidative-stress fluorescent staining uses cell-permeant fluorogenic probes that become fluorescent after oxidation inside cells or tissues; commonly used examples include DCFH-DA/DCFDA for broad cellular oxidant detection, DHE for superoxide-related signal detection, MitoSOX for mitochondrial superoxide-related signal detection, and CellROX probes for oxidative-stress-associated fluorescence readouts. The assay detects probe oxidation rather than a single ROS species unless the probe and analysis method have been chemically validated for that species. DCFH-DA enters cells, is deacetylated by intracellular esterases to DCFH, and produces fluorescent DCF after oxidation, so the readout is used as an operational measure of total cellular oxidative stress rather than a species-specific ROS measurement. DHE and MitoSOX can report superoxide-related oxidation, but red fluorescence alone can include non-specific ethidium-like oxidation products; HPLC or optimized spectral approaches are
-
Ca2+ Staining Technique
Ca2+ staining is an experimental technique that utilizes specific fluorescent probes (such as Fluo-4 AM, Fura-2, etc.) to qualitatively or quantitatively detect dynamic changes in intracellular Ca2+ concentrations; this is achieved by monitoring the changes in fluorescent signals generated when these probes bind to free intracellular calcium ions. The underlying principle relies primarily on the presence of chelating groups within the probe's molecular structure that possess high affinity for calcium ions.
-
Research Protocol for Inflammation-related Diseases
The NLRP3 inflammasome is a cytosolic innate immune signaling platform that integrates priming signals and danger-signal activation to promote caspase-1 activation, maturation of IL-1β and IL-18, and gasdermin D-mediated pyroptotic cell death. The core experimental logic is to determine whether inflammatory disease phenotypes are driven by increased NLRP3 expression, ASC-containing inflammasome assembly, caspase-1 cleavage, GSDMD cleavage, and extracellular release of IL-1β/IL-18 rather than by nonspecific cell injury alone. The pathway is strongly linked to inflammation-related disease phenotypes because monosodium urate crystals activate NALP3/NLRP3 inflammasome signaling in gout-like crystal inflammation, cholesterol crystals activate NLRP3 inflammasomes in atherogenesis models, and DSS-induced intestinal inflammation has been reported to involve NLRP3 inflammasome activity. However, experimental colitis studies also show context-dependent protective effects of NLRP3 inflammasome co
-
Research Protocol for Metabolic Diseases
AMP-activated protein kinase, AMPK, is a conserved cellular energy sensor that responds to reduced cellular energy status and coordinates metabolism by increasing ATP-generating catabolic pathways while suppressing ATP-consuming anabolic processes. In metabolic disease research, the AMPK pathway is experimentally relevant because it regulates hepatic lipid synthesis, fatty acid oxidation, glucose production, skeletal-muscle glucose disposal, mTORC1-linked biosynthesis, autophagy, mitochondrial homeostasis, and whole-body energy balance. The central pathway logic is that energy stress, metformin, exercise-like stimulation, or direct AMPK activators increase AMPKα Thr172 phosphorylation and downstream substrate phosphorylation, including ACC and RAPTOR. Phosphorylation of ACC suppresses lipogenesis and supports fatty acid oxidation, whereas phosphorylation of RAPTOR suppresses mTORC1 signaling and links cellular energy status to growth and protein synthesis control. The pathway is linked
-
Apoptosis
Apoptosis, also called programmed cell death, is generally characterized by distinct morphological characteristics.
-
TUNEL staining for apoptotic DNA fragmentation
TUNEL staining detects DNA strand breaks by using terminal deoxynucleotidyl transferase to add labeled nucleotides to exposed 3′-OH DNA termini, generating either microscopic staining in fixed cells or tissue sections, or fluorescence/cytometric signal in cell suspensions. TUNEL positivity reflects DNA fragmentation but should not be interpreted alone as definitive apoptosis, because TUNEL can also label necrotic, autolytic, mechanically damaged, or DNA-repair-associated DNA breaks.
-
Fluorescent plasma-membrane potential dye assay
Fluorescent plasma-membrane potential dye assays measure changes in cell membrane potential using voltage-sensitive dyes whose fluorescence changes when cells depolarize or hyperpolarize. Anionic bis-oxonol dyes such as DiBAC4(3) enter depolarized cells more readily and show increased fluorescence after intracellular binding, while hyperpolarization reduces dye accumulation and fluorescence. FMP/FLIPR membrane-potential dyes are used for faster, homogeneous microplate assays of ion-channel or receptor-mediated membrane-potential changes.
-
Mitochondrial membrane-potential and mitochondrial mass staining
Mitochondrial membrane potential staining measures the electrochemical polarization across the mitochondrial inner membrane in live cells using lipophilic cationic fluorescent probes; early rhodamine-based work showed that selective mitochondrial dye accumulation is lost when the mitochondrial transmembrane potential is dissipated. JC-1 reports mitochondrial polarization by shifting from green monomer fluorescence to red J-aggregate fluorescence as dye concentration increases within energized mitochondria; therefore, the red/green fluorescence ratio is used as a relative readout of mitochondrial membrane potential. TMRE or TMRM staining provides a single-channel relative readout because these cationic rhodamine esters accumulate in polarized mitochondria, and lower fluorescence indicates reduced mitochondrial polarization when acquisition and dye-loading conditions are controlled. Mitochondrial mass staining is commonly performed with MitoTracker Green FM or related MitoTracker dyes as
-
Apoptosis Solutions
Apoptosis is a regulated, generally non-lytic cell-death pathway that removes unwanted, damaged, infected, or abnormal cells through coordinated morphological changes, caspase activation, DNA fragmentation, and membrane remodeling. The intrinsic apoptosis pathway is controlled mainly by mitochondrial outer membrane permeabilization, BCL-2 family proteins, cytochrome c release, apoptosome formation, caspase-9 activation, and downstream executioner caspase-3/7 activation. The extrinsic apoptosis pathway is initiated by death receptors such as Fas, TNFR, and TRAIL receptors, which recruit adaptor proteins and activate caspase-8 before engaging executioner caspases or mitochondrial amplification through BID cleavage. Apoptosis is linked to many phenotypes, including cancer cell killing, tissue homeostasis, immune regulation, neurodegeneration, infection response, and treatment-induced cytotoxicity; unresolved questions include how apoptosis interacts with necroptosis, pyroptosis, ferroptos
-
Hepatotoxicity Study
This protocol evaluates hepatotoxicity using complementary in vivo mouse APAP acute liver injury and in vitro hepatocyte-based cytotoxicity readouts. In vivo APAP injury is assessed by serum ALT/AST, liver histology, hepatic glutathione, protein adducts, necrosis, inflammation, and regeneration-related endpoints. In vitro hepatotoxicity is assessed by loss of viability, leakage of ALT/AST/LDH, oxidative-stress markers, mitochondrial function, nuclear morphology, intracellular calcium, and high-content imaging endpoints.
-
Genotoxicity/Mutagenicity Study
The bacterial reverse mutation assay detects point mutations that restore amino-acid prototrophy in auxotrophic Salmonella typhimurium or Escherichia coli tester strains; after exposure to a test article, mutagenic activity is read out as an increased number of revertant colonies on minimal agar compared with the vehicle control. The assay uses tester strains with different mutation targets so that base-substitution and frameshift mutagens can be detected, and testing is performed with and without exogenous mammalian metabolic activation because some chemicals require biotransformation to become mutagenic.


Purity & Documentation
-
Data Sheet (284 KB)
-
SDS (557 KB)
- English - EN (557 KB)
- Français - FR (557 KB)
- Deutsch - DE (557 KB)
- Norwegian - NO (557 KB)
- Español - ES (557 KB)
- Swedish - SV (557 KB)
- Italian - IT (557 KB)
- Korean - KR (557 KB)
- Portuguese - PT (557 KB)
-
Handling Instructions (2659 KB)
References
[1]. Tian D, et al. Tris(2-chloroethyl) Phosphate Exerts Hepatotoxic Impacts on Zebrafish by Disrupting Hypothalamic-Pituitary-Thyroid and Gut-Liver Axes. Environ Sci Technol. 2023 Jun 20;57(24):9043-9054. [Content Brief]
[2]. Yang D, et al. Tris (2-chloroethyl) phosphate (TCEP) induces obesity and hepatic steatosis via FXR-mediated lipid accumulation in mice: Long-term exposure as a potential risk for metabolic diseases. Chem Biol Interact. 2022 Aug 25;363:110027. [Content Brief]


Complete Stock Solution Preparation Table
Please refer to the solubility information to select the appropriate solvent. Once prepared, please aliquot and store the solution to prevent product inactivation from repeated freeze-thaw cycles.
Storage method and period of stock solution: -80°C, 2 years; -20°C, 1 year. When stored at -80°C, please use it within 2 years. When stored at -20°C, please use it within 1 year.
| Optional Solvent | Concentration Solvent Mass | 1 mg | 5 mg | 10 mg | 25 mg |
|---|---|---|---|---|---|
| DMSO | 1 mM | 3.5027 mL | 17.5137 mL | 35.0275 mL | 87.5687 mL |
| 5 mM | 0.7005 mL | 3.5027 mL | 7.0055 mL | 17.5137 mL | |
| 10 mM | 0.3503 mL | 1.7514 mL | 3.5027 mL | 8.7569 mL | |
| 15 mM | 0.2335 mL | 1.1676 mL | 2.3352 mL | 5.8379 mL | |
| 20 mM | 0.1751 mL | 0.8757 mL | 1.7514 mL | 4.3784 mL | |
| 25 mM | 0.1401 mL | 0.7005 mL | 1.4011 mL | 3.5027 mL | |
| 30 mM | 0.1168 mL | 0.5838 mL | 1.1676 mL | 2.9190 mL | |
| 40 mM | 0.0876 mL | 0.4378 mL | 0.8757 mL | 2.1892 mL | |
| 50 mM | 0.0701 mL | 0.3503 mL | 0.7005 mL | 1.7514 mL | |
| 60 mM | 0.0584 mL | 0.2919 mL | 0.5838 mL | 1.4595 mL | |
| 80 mM | 0.0438 mL | 0.2189 mL | 0.4378 mL | 1.0946 mL | |
| 100 mM | 0.0350 mL | 0.1751 mL | 0.3503 mL | 0.8757 mL |


Tris(2-chloroethyl) phosphate Related Classifications
HY-107859 Related Classifications
 Powered by Bioz