



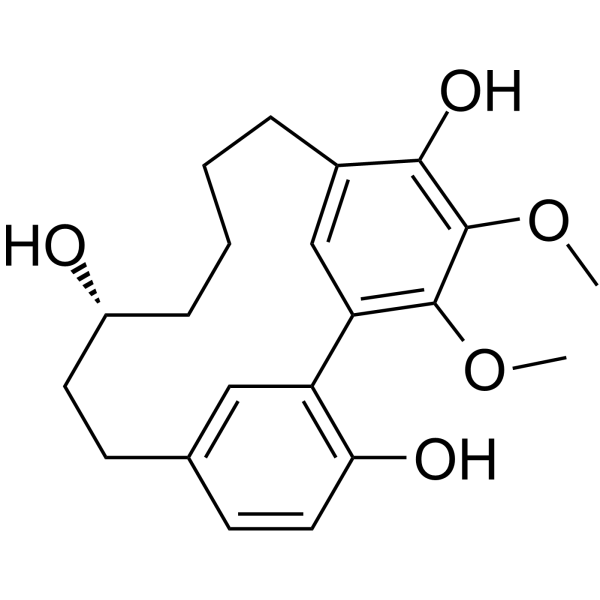
Myricanol
Myricanol is a diarylheptanoid and a Nampt activator. Myricanol exerts anti-inflammatory effects and alleviates glucocorticoid-induced muscle atrophy by increasing Sirtuin 1 (SIRT1) and PRDX5 activities while regulating inflammatory factors. Myricanol exhibits growth inhibition and induces apoptosis in human lung adenocarcinoma A549 cells. Myricanol promotes autophagy-mediated clearance of microtubule-associated protein tau to exert neuroprotective effects. Myricanol protects cardiovascular function by inhibiting PDGFRβ and NF-κB signaling pathways. Myricanol activates mitochondrial transcription factor A (TFAM) expression to exert anti-renal fibrosis effects. Myricanol improves insulin resistance through AMPK activation.
Nur für Forschungszwecke. Wir verkaufen nicht an Patienten.
- Reinheit : 98.93%
- CAS. Nr.: 33606-81-4
- Formel: C21H26O5
- Molecular Weight:358.43
-
Speicherung:
4°C, protect from light
* In solvent : -80°C, 6 months; -20°C, 1 month (protect from light)

To place orders, for customer services and technical support, please contact: MedChemExpress USA
Tel: 609-228-6898 E-mail: [email protected] [email protected]


-
 Biologische Aktivität
-
Chemical Information
- Protokoll
- Reinheit & Dokumentation
- Verweise
-
 Help & FAQs


Alle AMPK Isoform-spezifische Produkte anzeigen
More

Biologische Aktivität
Beschreibung
|
SIRT1 |
NF-κB |
AMPK |
PDGFRβ |
Cellular Effect
|
Cell Line

|
Type | Value | Description | References |
|---|---|---|---|---|
| RAW264.7 | IC50 |
7.5 μM
Compound: 153
|
Antiinflammatory activity in mouse RAW264.7 cells assessed as inhibition of LPS-induced NO production preincubated for 1 hrs followed by LPS stimulation and measured after 24 hrs by Griess reagent based spectrophotometrical method
Antiinflammatory activity in mouse RAW264.7 cells assessed as inhibition of LPS-induced NO production preincubated for 1 hrs followed by LPS stimulation and measured after 24 hrs by Griess reagent based spectrophotometrical method
|
[PMID: 33422907] |
In Vitro
Myricanol (0.01-150 μM ,1-72 h) effectively reduces tau levels in HEK293T cells with IC50 of approximately 18.56 μM and mouse acute ex vivo brain tissues (100 and 150 μM) through activation of autophagy[1].
Myricanol (0-10 μM, 24 h) significantly reverses the reduction in mitochondrial content and functional impairment induced by Dexamethasone (DEX) (HY-14648), and promotes autophagy and inhibits apoptosis to protect C2C12 myotubes through activating sirtuin 1[2].
Myricanol (1.25-5 μmol/L, 24 h) decreases lipid accumulation and enhances mitochondrial function in Palmitic acid (PA) (HY-N0830)-treated C2C12 myotubes and protects C2C12 myotubes against insulin resistance, and increases irisin production and secretion in C2C12 myotubes, which in turn induces the browning of adipocytes[3].
Myricanol (5-20 μM) inhibits renal fibrosis by invigorated TFAM and ameliorate the interaction between ZNRF1 and LCN2 and aggravates ferroptosis in TGF-β1-induced HK2 cells[4].
MY (2.5-10 μM) protects C2C12 myotubes against oxidative damage treated by tert-butyl hydroperoxide (TBHP) and improves mitochondrial biogenesis and function through targeting PRDX5[5].
Myricanol (3-30 μM, 24.5 h) inhibits the proliferation and migration of vascular smooth muscle cells induced by platelet derived growth factor-BB by inhibiting the activation of platelet-derived growth factor receptor pathway and NF-κB p65 translocation[6].
Myricanol (5-40 μM, 24 h) targets Nampt in C2C12 cells, which involved in the insulin sensitizing effect[7].
Myricanol (1.56-50 μg/mL, 48 h-10 d) inhibits A549 cells proliferation (IC50 = 4.85 μg/mL) and clonogenic formation and induces apoptosis[8].
MedChemExpress (MCE) has not independently confirmed the accuracy of these methods. They are for reference only.
-
Cell Line:HEK293T cells
-
Concentration:18 μM
-
Incubation Time:1, 6, 24, 48, 72 h
-
Result:Completely be blocked the tau-lowering effect by 3-MA (HY-19312).
Increased the LC3β-II/I ratio.
-
Cell Line:C2C12 myotubes stimulated by with DEX
-
Concentration:0, 0.25, 5, 10 μM
-
Incubation Time:24 h
-
Result:Restored the expression of myosin heavy chain (MyHC), muscle atrophy F-box protein (atrogin-1), and muscle ring-finger protein 1 (MuRF1).
Dose-dependent upregulated SIRT1 expression.
Restored the phosphorylation of Akt and FoxO3a that is inhibited by DEX.
Increased the expression levels of Cox2, Tom20, UCP3, and PGC-1α.
Reversed DEX-induced increases of total and acetylated FoxO3a levels, which were abolished by co-treatment of EX-527 (HY-15452).
Inhibited expression of apoptosis-associated proteins Bax, cleaved caspase-3 and Increased Bcl-2.
-
Cell Line:C2C12 myotubes stimulated by with PA
-
Concentration:1.25, 2.5, and 5 μmol/L
-
Incubation Time:24 h
-
Result:Activated the AMPK/ACC signaling pathway and upregulated the expression of PGC-1α.
Activated of the insulin signaling pathway (IRS-1/Akt/GSK-3β).
Promoted the production and secretion of FNDC5/irisin.
Decreased the lipid accumulation in 3T3‐L1 adipocytes in a dose-dependent manner.
Increased the browning markers, PGC‐1α and UCP1, and the mitochondrial marker, COX2, and Suppressed the adipogenic marker, PPARγ, in 3T3‐L1 adipocytes, dose-dependently.
-
Cell Line:Primary VSMCs
-
Concentration:3, 10 and 30 μM
-
Incubation Time:Pretreated 30 min and treated with PDGF-BB for 24 h
-
Result:Partially suppressed the migration at 10 and 30 μM.
-
Cell Line:Primary VSMCs
-
Concentration:3, 10 and 30 μM
-
Incubation Time:Pretreated 30 min and treated with PDGF-BB for 24 h
-
Result:Reduced PCNA, E2F1 and p-Rb.
Reduced Cyclin D1, Cyclin E1 and recovered p53.
Inhibited MM2 and MM9.
Inhibited PDGFRβ pathway and MAPK pathway.
Significantly inhibited p65 nuclear accumulation.
-
Cell Line:A549 cells
-
Concentration:1.56, 3.125, 6.25, 12.5, 25 and 50 μg/mL
-
Incubation Time:48 h
-
Result:Inhibited cell proliferation in a concentration-dependent manner.
-
Cell Line:A549 cells
-
Concentration:5 μg/mL
-
Incubation Time:48 h
-
Result:Increased the apoptosis rate from 4.13% to 34.3%, and the proportion of early apoptosis increased significantly.
Upregulated Caspase-3, Caspase-9, Bax and p21, downregulated Bcl-2.
In Vivo
Myricanol (0.5-2.5 mg/mL, dissolved in PEG 400 (HY-Y0873A) solution, i.p., once daily for 18 weeks) retards fat mass gain and improves lipid profiles and improves insulin sensitivity in high-fat diet (HFD)-fed mice[3].
Myricanol (0.5-2 mg/mL, i.p., once daily for 1 weeks) efficiently improves renal function and suppresses fibrosis in chronic kidney disease (CKD) mice[4].
Myricanol (10-50 mg/kg, i.p., once daily for 20 days) protects aged mice against muscle wasting through alleviating oxidative damage in mitochondria and identify the direct protein target and its underlying mechanism[5].
Myricanol (5 mg/kg, i.p., once daily for 14 days) significantly diminishes the neointimal hyperplasia induced by carotid artery ligation[6].
MedChemExpress (MCE) has not independently confirmed the accuracy of these methods. They are for reference only.
-
Animal Model:DEX-induced muscle dysfunction established in male C57BL/6 mice (8-10 weeks old)[2]
-
Dosage:5 and 50 mg/kg
-
Administration:Intraperitoneal injection (i.p.), once daily for 10 days
-
Result:Reduced the loss of muscle mass.
Rescued dexamethasone-induced muscle weakness, indicated by improved grip strength.
Upregulated SIRT1 and PGC-1α, reduced atrogin-1/MuRF1.
-
Animal Model:HFD model established in male C57BL/6 mice (8-10 weeks old)[3]
-
Dosage:0.5 and 2.5 mg/mL, dissolved in PEG 400 (HY-Y0873A) solution
-
Administration:Intraperitoneal injection (i.p.), once daily for 18 weeks
-
Result:Inhibited weight gain induced by high-fat diet and reduces fat tissue accumulation.
Improved the glucose tolerance and insulin sensitivity of HFD mice (reduce the HOMA-IR index).
Reduced serum triglycerides, total cholesterol and LDL cholesterol, and increased HDL cholesterol).
Increased energy consumption (oxygen consumption).
Reduced lipid deposition in skeletal muscles and improved muscle function (as measured by grip strength test).
Activated the AMPK/PGC-1α signaling pathway in skeletal muscle.
Increased the expression of FNDC5 in skeletal muscle and the serum level of irisin.
Induced the browning of white adipose tissue in the groin region.
-
Animal Model:CKD model induced by unilateral ureteral obstruction (UUO) established in male C57BL/6 mice (6-8 weeks old)[4]
-
Dosage:0.5 and 2 mg/mL along with an equal volume of normal saline
-
Administration:Intraperitoneal injection (i.p.), once daily for one weeks
-
Result:Significantly reduced serum creatinine and urea nitrogen levels.
Showed a 40-60% reduction in collagen deposition.
Downregulated fibrosis markers (FN, α-SMA).
Significantly upregulated TFAM and GPX4 expressions and decreased 4-HNE.
-
Animal Model:Sarcopenia phenotypes model established in 18-month-old male C57BL/6J mice[5]
-
Dosage:10 and 50 mg/kg
-
Administration:Intraperitoneal injection (i.p.), once daily for 10 days
-
Result:Improved grip strength in aging mice.
Significantly improved Quad, Gast and TA muscle index.
Reduced mitochondrial vacuolization and cristae structure disruption.
-
Animal Model:Carotid artery wire ligation injury model established in eight-week-old male C57BL/6 mice[6]
-
Dosage:5 mg/kg
-
Administration:Intraperitoneal injection (i.p.), once daily for 14 days
-
Result:Showed significantly reduced intima, both the ratio of intima to media (I/M ratio) and intimal area.
Had significantly inhibited Ki67 expression and F4/80 expression.
- RNA extraction experimental
- Collagen: Sirius Red Staining
- Annexin V plus membrane-impermeant dye apoptosis staining
- Connective Tissue: Masson's Trichrome/Collagen Trichrome Staining
- Research Protocol for Inflammation-related Diseases
- Research Protocol for Metabolic Diseases
- Nuclear Protein Extraction (High-Salt/Hypotonic Fractionation)
- Fibrosis/Collagen Morphometry
- Detection of Apoptosis
- TUNEL staining for apoptotic DNA fragmentation
- Research Protocol for Endocrine Diseases
- Autophagy
- Protocol for Pharmacokinetic Study
- Apoptosis Solutions
- Lysosome and acidic-vesicle live-cell staining
- Macroautophagy Solutions


Chemical Information
-
CAS. Nr. 33606-81-4
-
Appearance Solid
-
Molecular Weight 358.43
-
Formel C21H26O5
-
Color White to off-white
-
SMILES
COC1=C(C=C(CCCC[C@H]2O)C(O)=C1OC)C(C=C(CC2)C=C3)=C3O
-
Structure Classification
-
Initial Source
-
Versand
Room temperature in continental US; may vary elsewhere.
-
Speicherung
4°C, protect from light
* In solvent : -80°C, 6 months; -20°C, 1 month (protect from light)


Reinheit & Dokumentation
-
Data Sheet (297 KB)
-
SDS (393 KB)
- English - EN (393 KB)
- Français - FR (393 KB)
- Deutsch - DE (393 KB)
- Norwegian - NO (393 KB)
- Español - ES (393 KB)
- Swedish - SV (393 KB)
- Italian - IT (393 KB)
- Korean - KR (393 KB)
- Portuguese - PT (393 KB)
-
Handling Instructions (2659 KB)
Verweise
[1]. Martin MD, et al. Synthesis, stereochemical analysis, and derivatization of myricanol provide new probes that promote autophagic tau clearance. ACS Chem Biol. 2015;10(4):1099-1109. [Content Brief]
[2]. Shen S, et al. Myricanol rescues dexamethasone-induced muscle dysfunction via a sirtuin 1-dependent mechanism. J Cachexia Sarcopenia Muscle. 2019 Apr;10(2):429-444. [Content Brief]
[3]. Shen S, et al. Myricanol modulates skeletal muscle-adipose tissue crosstalk to alleviate high-fat diet-induced obesity and insulin resistance. Br J Pharmacol. 2019 Oct;176(20):3983-4001. [Content Brief]
[4]. Zheng M, et al. Myricanol represses renal fibrosis by activating TFAM and ZNRF1 to inhibit tubular epithelial cells ferroptosis. Eur J Pharmacol. 2024 Dec 5;984:176999. [Content Brief]
[5]. Shen S, et al. Myricanol prevents aging-related sarcopenia by rescuing mitochondrial dysfunction via targeting peroxiredoxin 5. MedComm (2020). 2024 Jun 12;5(6):e566. [Content Brief]
[6]. Fan S, et al. Myricanol Inhibits Platelet Derived Growth Factor-BB-Induced Vascular Smooth Muscle Cells Proliferation and Migration in vitro and Intimal Hyperplasia in vivo by Targeting the Platelet-Derived Growth Factor Receptor-β and NF-κB Signaling. Front Physiol. 2022 Feb 3;12:790345. [Content Brief]
[7]. Lyu P, et al. Affinity-based protein profiling-driven discovery of myricanol as a Nampt activator. Bioorg Chem. 2023 Apr;133:106435. [Content Brief]
[8]. Dai GH, et al. Growth-inhibiting and apoptosis-inducing activities of Myricanol from the bark of Myrica rubra in human lung adenocarcinoma A549 cells. Phytomedicine. 2014 Sep 25;21(11):1490-6. [Content Brief]

Calculators
Konzentration (Stammlösung) × Volumen (Stammlösung) = Konzentration (Ziellösung) × Volumen (Ziellösung)


Myricanol Related Classifications
HY-N3225 Related Classifications
 Powered by Bioz