



DCZ3301

Based on 1 Customer Validation
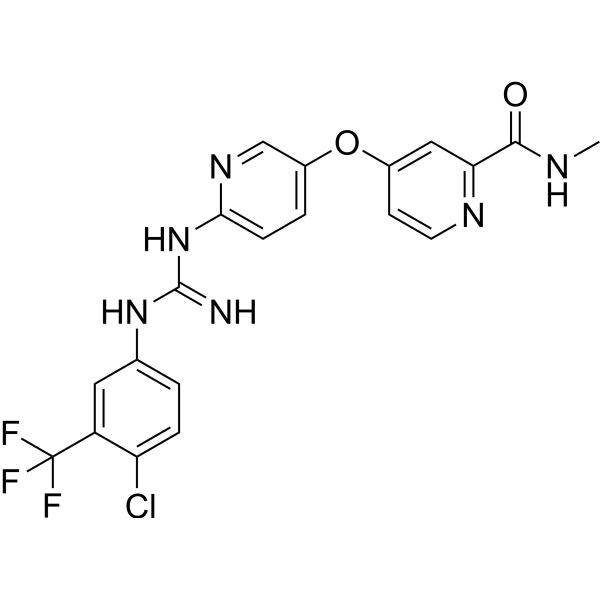
DCZ3301 is an apoptosis inducer. DCZ3301 modulates JAK2/STAT3, ERK1/2, and PI3K/AKT pathways. DCZ3301 induces G2/M and M phase cell cycle arrest and inhibits cell proliferation and viability. DCZ3301 enhances DNA damage, inhibits DNA repair, and suppresses angiogenesis. DCZ3301 can be used for the research of diffuse large B-cell lymphoma, multiple myeloma and leukemia/lymphoma.
연구목적의 판매만을 진행합니다. 환자를 대상으로 한 판매는 하지 않습니다.
- Purity : 99.73%
- CAS No.: 2136278-38-9
- 화학식: C20H16ClF3N6O2
- 분자량:464.83
-
보관:Powder -20°C, 3 years ; In solvent -80°C, 6 months , -20°C, 1 month

To place orders, for customer services and technical support, please contact: MedChemExpress USA
Tel: 609-228-6898 E-mail: [email protected] [email protected]


-
 Biological Activity
-
Chemical Information
-
용액&용해도
- Protocol
- 순도&문서
- References
-
 Help & FAQs




Biological Activity
제품 설명
IC50 & Target
[1]|
JAK2 |
p-STAT3 |
ERK1 |
ERK2 |
In Vitro
DCZ3301 (1-32 μM; 48 h) potently inhibits proliferation of OCI-LY8, NU-DUL-1, SUDHL-4, DB, and TMD8 DLBCL cell lines[1].
DCZ3301 (1-32 μM; 24-72 h) inhibits proliferation of OCI-LY8 and NU-DUL-1 DLBCL cell lines in a time-dependent manner[1].
DCZ3301 (2-20 μM; 48 h) inhibits proliferation of OCI-LY8 and NU-DUL-1 DLBCL cell lines in the presence of IL-6 or IGF-1, with its growth-inhibitory effect unaffected by these protumorigenic cytokines[1].
DCZ3301 (4-20 μM; 24-72 h) induces dose- and time-dependent apoptosis in OCI-LY8 and NU-DUL-1 DLBCL cell lines[1].
DCZ3301 (8-16 μM; 48 h) induces apoptosis in OCI-LY8 and NU-DUL-1 DLBCL cell lines via both extrinsic and intrinsic caspase-dependent pathways[1].
DCZ3301 (4 μM; 8-24 h) induces time-dependent G2/M phase cell cycle arrest in OCI-LY8 and NU-DUL-1 DLBCL cell lines when treated with 4 μM for 8, 12, or 24 h[1].
DCZ3301 (4-8 μM; 24 h) modulates cell cycle-related proteins (upregulating p-CHK2 and p21, downregulating cdc25A, cdc25C, and cyclinB1) in OCI-LY8 and NU-DUL-1 DLBCL cell lines[1].
DCZ3301 (8-16 μM; 48 h) regulates the Akt, ERK1/2, and JAK2/STAT3 signaling pathways[1].
DCZ3301 (4-8 μM; 48 h) has its antiproliferative effect enhanced in STAT3-knockdown OCI-LY8 and NU-DUL-1 DLBCL cell lines[1].
DCZ3301 (8-16 μM; 12-48 h) inhibits Lyn phosphorylation (Y507) in a dose- and time-dependent manner, with a corresponding decrease in STAT3 phosphorylation, in OCI-LY8 and NU-DUL-1 DLBCL cell lines[1].
DC50Z3301 (8-16 μM; 48 h) modulates DNA repair-related protein expression in NCI-H929R and RPMI-8226R5 BTZ-resistant multiple myeloma cells after 48 hours of treatment[2].
DCZ3301 (8 μM; 48 h) upregulates γ-H2A.X expression and induces γ-H2A.X foci formation in NCI-H929R and RPMI-8226R5 BTZ-resistant multiple myeloma cells, confirming enhanced DNA damage[2].
DCZ3301 (5 μM; 24 h) suppresses the migration of human umbilical vein endothelial cells (HUVECs) in a wound healing assay[5].
MedChemExpress (MCE) has not independently confirmed the accuracy of these methods. They are for reference only.
-
Cell Line:OCI-LY8, NU-DUL-1, SUDHL-4, DB, TMD8 (diffuse large B-cell lymphoma cell lines)
-
Concentration:1 μM; 2 μM; 4 μM; 8 μM; 16 μM; 32 μM
-
Incubation Time:48 h
-
Result:Caused a dose-dependent decrease in DLBCL cell proliferation.
Achieved IC50 values of 7.1 μM (OCI-LY8), 9.7 μM (NU-DUL-1), 6.67 μM (SUDHL-4), 8.04 μM (DB), and 9.66 μM (TMD8).
-
Cell Line:OCI-LY8, NU-DUL-1 (diffuse large B-cell lymphoma cell lines)
-
Concentration:1 μM; 2 μM; 4 μM; 8 μM; 16 μM; 32 μM
-
Incubation Time:24 h; 48 h; 72 h
-
Result:Inhibited proliferation of OCI-LY8 and NU-DUL-1 cells in a time-dependent manner, with greater inhibition observed at longer incubation times.
-
Cell Line:OCI-LY8, NU-DUL-1 (diffuse large B-cell lymphoma cell lines)
-
Concentration:2 μM; 4 μM; 6 μM; 8 μM; 10 μM; 12 μM; 16 μM; 20 μM
-
Incubation Time:48 h
-
Result:Induced growth inhibition that was not altered by the presence of IL-6 or IGF-1, despite these cytokines alone stimulating DLBCL cell growth.
-
Cell Line:OCI-LY8, NU-DUL-1 (diffuse large B-cell lymphoma cell lines)
-
Concentration:4 μM; 5 μM; 8 μM; 10 μM; 12 μM; 15 μM; 16 μM; 20 μM
-
Incubation Time:24 h; 48 h; 72 h
-
Result:Induced apoptosis in OCI-LY8 and NU-DUL-1 cells in a dose- and time-dependent manner.
Increased apoptosis rates with higher concentrations and longer incubation times, with statistically significant increases compared to controls.
-
Cell Line:OCI-LY8, NU-DUL-1 (diffuse large B-cell lymphoma cell lines)
-
Concentration:8 μM; 16 μM
-
Incubation Time:48 h
-
Result:Caused a dose-dependent increase in cleaved caspase-3, caspase-8, caspase-9, and PARP, while downregulating Bcl-2 and Bcl-xL and upregulating Bax.
Suppressed apoptosis in NU-DUL-1 cells when pre-incubated with pan-caspase inhibitor Z-VAD-FMK.
-
Cell Line:OCI-LY8, NU-DUL-1 (diffuse large B-cell lymphoma cell lines)
-
Concentration:4 μM
-
Incubation Time:8 h; 12 h; 24 h
-
Result:Caused a time-dependent accumulation of cells in the G2/M phase in both OCI-LY8 and NU-DUL-1 cell lines, with statistically significant increases (P < 0.05, P < 0.001) compared to controls at 12 and 24 h.
-
Cell Line:OCI-LY8, NU-DUL-1 (diffuse large B-cell lymphoma cell lines)
-
Concentration:4 μM; 8 μM
-
Incubation Time:24 h
-
Result:Increased p-CHK2 and p21 protein expression, while decreasing protein levels of cdc25A, cdc25C, and cyclinB1 in both OCI-LY8 and NU-DUL-1 cells.
-
Cell Line:OCI-LY8, NU-DUL-1 (diffuse large B-cell lymphoma cell lines)
-
Concentration:8 μM; 16 μM
-
Incubation Time:48 h
-
Result:Upregulated phosphorylated ERK1/2, downregulated phosphorylated Akt, phosphorylated JAK2, and phosphorylated STAT3, and reduced c-Myc expression in a dose-dependent manner in both OCI-LY8 and NU-DUL-1 cells.
-
Cell Line:OCI-LY8, NU-DUL-1 (diffuse large B-cell lymphoma cell lines, STAT3 knockdown)
-
Concentration:4, 8 μM
-
Incubation Time:48 h
-
Result:Enhanced antiproliferative efficacy in STAT3-knockdown OCI-LY8 and NU-DUL-1 cells compared to negative control siRNA-transfected cells, with statistically significant differences (P < 0.05) observed at both concentrations.
-
Cell Line:OCI-LY8, NU-DUL-1 (diffuse large B-cell lymphoma cell lines)
-
Concentration:8 μM; 16 μM
-
Incubation Time:12 h; 24 h; 36 h; 48 h
-
Result:Downregulated phosphorylated Lyn (Y507) in a dose- and time-dependent manner, while having no effect on phosphorylated Syk.
Decreased phosphorylated Lyn correlated with a synchronous decrease in phosphorylated STAT3.
-
Cell Line:OCI-LY8, NU-DUL-1 (diffuse large B-cell lymphoma cell lines, Lyn-overexpressing)
-
Concentration:16 μM
-
Incubation Time:24 h
-
Result:Caused a greater suppression of phosphorylated STAT3 in Lyn-overexpressing cells compared to control cells after 24 h, despite Lyn-overexpressing cells exhibiting higher levels of phosphorylated STAT3 than control cells without treatment.
-
Cell Line:BTZ-resistant multiple myeloma cell lines NCI-H929R and RPMI-8226R5
-
Concentration:8 μM
-
Incubation Time:48 h
-
Result:Increased γ-H2A.X expression and formation of γ-H2A.X foci, indicating increased DNA double-strand breaks.\nInduced the formation of multipolar mitotic spindles, a hallmark of mitotic catastrophe.
In Vivo
DCZ3301 (50 mg/kg; i.p.; 2 consecutive days followed by 1 day of vehicle; for 20 days) significantly inhibits tumor growth in a BTZ-resistant multiple myeloma xenograft model, reduces tumor cell proliferation[2].
DCZ3301 (50 mg/kg; i.p.; daily; 14 days) does not induce significant acute liver or kidney toxicity in healthy BALB/C nude mice[2].
DCZ3301 (30 mg/kg; i.p.; daily; 14 days) significantly inhibits T-cell leukemia/lymphoma xenograft tumor growth in BALB/c nude mice[3].
Treatment with DCZ3301 (30 mg/kg; i.p.; daily; 14 days) significantly inhibits tumor growth and reduces tumor weight in a Jurkat cell xenograft model of T-cell leukemia[4].
DCZ3301 (50-200 μM; topical eye drops; three times daily; 7 days) significantly reduces corneal neovascularization area and attenuates corneal stroma edema in alkali-burned mice, with 200 μM producing a larger reduction in CNV area compared to vehicle control[5].
DCZ3301 (200 μM; topical eye drops; three times daily; 7 days) does not significantly affect corneal epithelial thickness or endothelial cell density in healthy BALB/c mice[5].
MedChemExpress (MCE) has not independently confirmed the accuracy of these methods. They are for reference only.
-
Animal Model:BALB/c nude (6-week-old male, athymic, nu/nu, subcutaneous xenograft model)[1]
-
Dosage:40 mg/kg
-
Administration:i.p.; daily; 12 days
-
Result:Reduced tumor volume significantly compared to controls by day 12 (P < 0.05).
Showed no significant difference in mouse body weight compared to controls.
Increased cell necrosis in tumor tissues via H&E staining.
Increased apoptotic cells in tumor tissues via TUNEL staining.
Downregulated phosphorylated STAT3 expression in tumor tissues via immunohistochemistry.
Showed no evidence of organ dysfunction or growth disorder in functional organs.
-
Animal Model:BALB/C nude mice (weight monitored during study)[2]
-
Dosage:50 mg/kg
-
Administration:i.p.; 2 consecutive days followed by 1 day of vehicle; for 20 days
-
Result:Significantly reduced tumor volume compared to control group on day 20.
Did not cause changes in mouse body weight or significant differences in serum levels of ALT, AST, Cr, or BUN.
Increased tumor cell shrinkage and fragmentation relative to controls.
Reduced Ki-67 expression in tumor tissue.
Increased cleaved-caspase 3 expression in tumor tissue.
Upregulated γ-H2A.X, phospho-ATM, and phospho-CHK1 expression in tumor tissue.
Increased percentage of TUNEL-positive cells in tumors.
-
Animal Model:BALB/C nude mice (weight monitored during study)[2]
-
Dosage:50 mg/kg
-
Administration:i.p.; daily; 14 days
-
Result:Showed no significant differences in serum levels of ALT, AST, Cr, or BUN compared to vehicle-treated controls.
-
Animal Model:BALB/c nude (5-week-old male, subcutaneous xenograft with Jurkat cells)[3]
-
Dosage:30 mg/kg
-
Administration:i.p.; daily; 14 days
-
Result:Reduced final tumor volumes to statistically significant levels (P < 0.01).
Reduced final tumor weights to statistically significant levels (P < 0.001).
Caused no significant change in mouse body weight compared to vehicle controls.
-
Animal Model:BALB/c nude (5-week-old male, subcutaneous xenograft model)[4]
-
Dosage:30 mg/kg
-
Administration:i.p.; daily; 14 days
-
Result:Reduced tumor volume by a statistically significant margin on days 12 and 14 of treatment (P < 0.01).
Lowered final tumor weight significantly compared to controls (P < 0.001).
Caused no significant change in mouse body weight compared to vehicle-treated groups.
-
Animal Model:BALB/c (6-8 week old male, alkali-burn induced corneal neovascularization)[5]
-
Dosage:50 μM; 200 μM
-
Administration:topical eye drops; three times daily; 7 days
-
Result:Significantly reduced the ratio of corneal neovascularization (CNV) area compared to vehicle control (P < 0.01).
Significantly reduced the ratio of CNV area compared to vehicle control (P < 0.0001).
Greatly reduced corneal stroma thickness compared to vehicle control (P < 0.001).
Greatly reduced corneal stroma thickness compared to vehicle control (P < 0.0001).
-
Animal Model:BALB/c[5]
-
Dosage:200 μM
-
Administration:topical eye drops; three times daily; 7 days
-
Result:Did not cause a significant difference in central corneal epithelial thickness compared to saline-treated controls (P > 0.05).
Did not cause a significant difference in corneal endothelial cell density compared to saline-treated controls (P > 0.05).
Maintained regular shape of corneal endothelial cells.
- Human pluripotent stem cell endothelial-cell differentiation
- Vascular/Branching Fractal Analysis
- Annexin V plus membrane-impermeant dye apoptosis staining
- BrdU Incorporation Assay
- Somatic Cell Culture
- CFSE Dye Dilution Proliferation Assay
- Dye-dilution cell tracking and proliferation staining
- Protocol for Cell Cycle
- CCK-8/WST-8 Cell Proliferation Assay
- Cell Counting-Based Growth Curve Assay
- Colony Formation (Clonogenic) Assay
- Cell Viability Determination by MTT Colorimetric Assay
- EdU Incorporation Assay (Click Chemistry-Based DNA Synthesis Measurement)
- Detection of Apoptosis
- TUNEL staining for apoptotic DNA fragmentation
- Ki-67 Immunostaining Proliferation Assay
- Flow cytometric DNA-content cell-cycle staining
- PCNA Immunodetection Proliferation Assay
- Protocol for Cell Counting and Cell Density Analysis
- Endothelial Tube Formation Assay
- Apoptosis Solutions
- MTT Cell Proliferation Assay
- Genotoxicity/Mutagenicity Study
- Endothelial Cell Migration/Angiogenic Sprouting Assay


Chemical Information
-
CAS No. 2136278-38-9
-
Appearance Solid
-
분자량 464.83
-
화학식 C20H16ClF3N6O2
-
Color White to off-white
-
SMILES
O=C(C1=NC=CC(OC2=CC=C(NC(NC3=CC=C(Cl)C(C(F)(F)F)=C3)=N)N=C2)=C1)NC
-
선적
Room temperature in continental US; may vary elsewhere.
-
보관
Powder -20°C 3 years In solvent -80°C 6 months -20°C 1 month


용액&용해도
In Vitro:
DMSO : 50 mg/mL (107.57 mM; Need ultrasonic; Hygroscopic DMSO has a significant impact on the solubility of product, please use newly opened DMSO)
Please refer to the solubility information to select the appropriate solvent. Once prepared, please aliquot and store the solution to prevent product inactivation from repeated freeze-thaw cycles.
Storage method and period of stock solution: -80°C, 6 months; -20°C, 1 month. When stored at -80°C, please use it within 6 months. When stored at -20°C, please use it within 1 month.
Please refer to the solubility information to select the appropriate solvent. Once prepared, please aliquot and store the solution to prevent product inactivation from repeated freeze-thaw cycles.
Storage method and period of stock solution: -80°C, 6 months; -20°C, 1 month. When stored at -80°C, please use it within 6 months. When stored at -20°C, please use it within 1 month.
Concentration (start) × Volume (start) = Concentration (final) × Volume (final)
In Vivo:
Select the appropriate dissolution method based on your experimental animal and administration route.
- For the following dissolution methods, please ensure to first prepare a clear stock solution using an In Vitro approach and then sequentially add co-solvents:
- To ensure reliable experimental results, the clarified stock solution can be appropriately stored based on storage conditions. As for the working solution for In Vivo experiments, it is recommended to prepare freshly and use it on the same day.
- The percentages shown for the solvents indicate their volumetric ratio in the final prepared solution. If precipitation or phase separation occurs during preparation, heat and/or sonication can be used to aid dissolution.
In Vivo Dissolution Calculator
Please enter the basic information of animal experiments:
-
-
-
-
Recommended: Prepare an additional quantity of animals to account for potential losses during experiments.
Please enter your animal formula composition:
-
%DMSO +
Recommended: Keep the proportion of DMSO in working solution below 2% if your animal is weak.
-
%+
-
+%Tween-80 + +
-
%Saline +
The co-solvents required include: DMSO, . All of co-solvents are available by MedChemExpress (MCE). , Tween 80. All of co-solvents are available by MedChemExpress (MCE).
Working solution concentration: 0.22 mg/mL
Method for preparing stock solution: mg drug dissolved in μL DMSO. Stock solution concentration: mg/mL.
1. Take μL DMSO stock solution;
2. Add μL .
μL , mix evenly;
3. Then add μL Tween 80, mix evenly;
4. Then add μL
Please ensure that the stock solution in the first step is dissolved to a clear state, and add co-solvents in sequence. You can use ultrasonic heating (ultrasonic cleaner, recommended frequency 20-40 kHz), vortexing, etc. to assist dissolution.


순도&문서
-
Data Sheet (297 KB)
-
SDS (251 KB)
- English - EN (251 KB)
- Français - FR (251 KB)
- Deutsch - DE (251 KB)
- Norwegian - NO (251 KB)
- Español - ES (251 KB)
- Swedish - SV (251 KB)
- Italian - IT (251 KB)
- Korean - KR (251 KB)
- Portuguese - PT (251 KB)
-
Handling Instructions (2659 KB)
References
[1]. Sun X, et al. DCZ3301, a novel cytotoxic agent, inhibits proliferation in diffuse large B-cell lymphoma via the STAT3 pathway. Cell Death Dis. 2017;8(10):e3111. Published 2017 Oct 12. [Content Brief]
[2]. Hu L, et al. A novel M phase blocker, DCZ3301 enhances the sensitivity of bortezomib in resistant multiple myeloma through DNA damage and mitotic catastrophe. J Exp Clin Cancer Res. 2020;39(1):105. Published 2020 Jun 9. [Content Brief]
[3]. Xiao W, et al. DCZ3301, a novel aryl-guanidino inhibitor, induces cell apoptosis and cell cycle arrest via suppressing the PI3K/AKT pathway in T-cell leukemia/lymphoma. Acta Biochim Biophys Sin (Shanghai). 2018;50(7):643-650. [Content Brief]
[4]. Xu K, et al. DCZ3301, an aryl-guanidino agent, inhibits ocular neovascularization via PI3K/AKT and ERK1/2 signaling pathways. Exp Eye Res. 2020;201:108267. [Content Brief]


Complete Stock Solution Preparation Table
Please refer to the solubility information to select the appropriate solvent. Once prepared, please aliquot and store the solution to prevent product inactivation from repeated freeze-thaw cycles.
Storage method and period of stock solution: -80°C, 6 months; -20°C, 1 month. When stored at -80°C, please use it within 6 months. When stored at -20°C, please use it within 1 month.
| Optional Solvent | Concentration Solvent Mass | 1 mg | 5 mg | 10 mg | 25 mg |
|---|---|---|---|---|---|
| DMSO | 1 mM | 2.1513 mL | 10.7566 mL | 21.5132 mL | 53.7831 mL |
| 5 mM | 0.4303 mL | 2.1513 mL | 4.3026 mL | 10.7566 mL | |
| 10 mM | 0.2151 mL | 1.0757 mL | 2.1513 mL | 5.3783 mL | |
| 15 mM | 0.1434 mL | 0.7171 mL | 1.4342 mL | 3.5855 mL | |
| 20 mM | 0.1076 mL | 0.5378 mL | 1.0757 mL | 2.6892 mL | |
| 25 mM | 0.0861 mL | 0.4303 mL | 0.8605 mL | 2.1513 mL | |
| 30 mM | 0.0717 mL | 0.3586 mL | 0.7171 mL | 1.7928 mL | |
| 40 mM | 0.0538 mL | 0.2689 mL | 0.5378 mL | 1.3446 mL | |
| 50 mM | 0.0430 mL | 0.2151 mL | 0.4303 mL | 1.0757 mL | |
| 60 mM | 0.0359 mL | 0.1793 mL | 0.3586 mL | 0.8964 mL | |
| 80 mM | 0.0269 mL | 0.1345 mL | 0.2689 mL | 0.6723 mL | |
| 100 mM | 0.0215 mL | 0.1076 mL | 0.2151 mL | 0.5378 mL |


DCZ3301 Related Classifications
HY-125542 Related Classifications
 Powered by Bioz
Keywords
- DCZ3301
- 2136278-38-9
- DCZ 3301
- DCZ-3301
- Apoptosis
- JAK
- STAT
- ERK
- PI3K
- Akt
- Jurkat T-cell leukemia cells
- T-cell leukemia/lymphoma
- human umbilical vein endothelial cells
- bortezomib-resistant multiple myeloma
- OCI-LY8
- ocular neovascularization
- diffuse large B-cell lymphoma
- NU-DUL-1
- NCI-H929R
- RPMI-8226R5
- Inhibitor
- inhibitor
- inhibit