



Plecstatin-1
Based on 1 publication(s) in Google Scholar
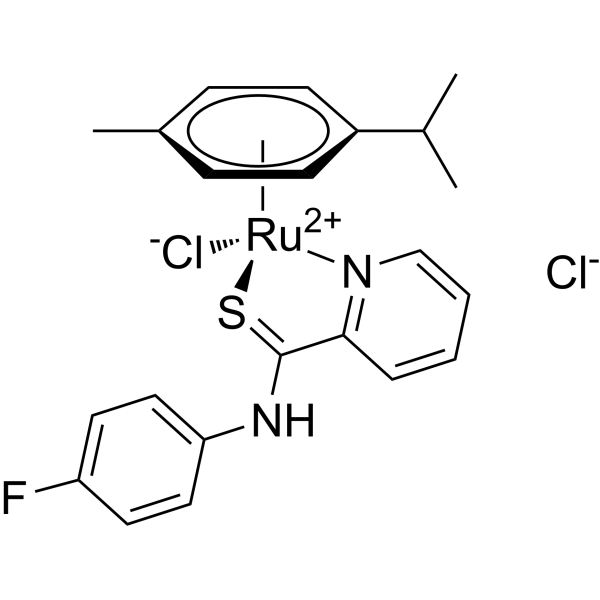
Plecstatin‑1 is a metal complex that drives the aggregation and collapse of the plectin network, and disrupts the cytoskeletal structures of α‑tubulin and F‑actin. Plecstatin-1 triggers oxidative stress, mediates the phosphorylation of eIF2α, and induces molecular features associated with immunogenic cell death, including calreticulin membrane exposure, membrane localization of HSP70/HSP90, ATP secretion, and HMGB‑1 release. Plecstatin-1 induces apoptosis via the intrinsic mitochondrial pathway and exerts anti-invasive activity. Plecstatin‑1 inhibits sphere proliferation and reduces clonogenicity in the 3D tumor spheroid model of colon cancer cells. Plecstatin-1 is applicable to relevant research on colorectal cancer.
Nur für Forschungszwecke. Wir verkaufen nicht an Patienten.
- CAS. Nr.: 2119725-22-1
- Formel: C22H23Cl2FN2RuS
- Molecular Weight:538.47
-
Speicherung:
Please store the product under the recommended conditions in the Certificate of Analysis.

To place orders, for customer services and technical support, please contact: MedChemExpress USA
Tel: 609-228-6898 E-mail: [email protected] [email protected]


-
 Biologische Aktivität
-
Chemical Information
- Protokoll
- Reinheit & Dokumentation
- Verweise
-
 Help & FAQs


Publications Citing Use of MedChemExpress (MCE) Plecstatin-1
MoreAlle Caspase Isoform-spezifische Produkte anzeigen
More

Biologische Aktivität
Beschreibung
IC50 & Target
[1]|
α-Tubulin |
eIF2-α |
HSP70 |
HSP90 |
Caspase 3 |
In Vitro
Plecstatin-1 inhibits the growth of HCT-116, HCT-15 and HT-29 colon cancer cells in both 2D monolayer and 3D spheroid models. Its potency is lower in the spheroid model, and its effects on spheroid size and morphology are cell line-dependent[1].
Plecstatin-1 (200 μM; 72 h) reduces the proliferative capacity of HCT-116 colon cancer spheroids[1].
Plecstatin-1 (7 days) reduces the long-term proliferation capacity of HCT-116 and HT-29 colon cancer cell monolayers, as evidenced by decreased colony formation at its IC50 concentration[1].
Plecstatin-1 (50 μM; 15 min-6 h) only weakly interacts with pUC19 plasmid DNA in a cell-free system, indicating that DNA damage is not its primary mechanism of action[1].
Plecstatin-1 (400 μM; 5 days) preferentially accumulates in the proliferative peripheral cells of HT-29 and HCT-116 colon cancer spheroids, with limited uptake by quiescent inner cells[1].
Plecstatin-1 (200 μM; 72 h) disrupts the cytoskeletal structures of plectin, α-tubulin and F-actin in HCT-116 colon cancer spheroids, while exerts weaker effects in HT-29 spheroids[1].
Plecstatin-1 (40 μM; 72 h) reduces the invasiveness of HT1080 fibrosarcoma spheroids in Matrigel invasion assays[1].
Plecstatin-1 (200 μM; 24 h) induces phosphorylation of the stress regulator eIF2α in HCT-116 colon cancer spheroids[1].
Plecstatin-1 (200 μM; 24 h) induces CRT translocation to the plasma membrane of HCT-116, HCT-15 and HT-29 colon cancer spheroids; it also induces ATP secretion from HCT-116 and HT-29 colon cancer spheroids, with the strongest effect observed in HCT-116 spheroids[1].
Plecstatin-1 (200 μM; 72 h) induces HMGB-1 release from HCT-116 and HT-29 colon cancer spheroids, with a stronger effect observed in HCT-116 spheroids[1].
Plecstatin-1 (200 μM; 24 h) increases the levels of HSP70 and HSP90 and promotes their translocation to the plasma membrane of colon cancer spheres[1].
Plecstatin‑1 (200 μM; 72 h) induces mild apoptosis in HCT‑116 and HCT‑15 colon cancer spheroids, but exerts no significant effect on apoptosis in HT‑29 spheroids[1].
Plecstatin-1 (200 μM; 48-72 h) induces apoptosis in HCT-116 colon cancer spheroids via the intrinsic mitochondrial pathway, as evidenced by cytochrome c release and caspase-3 cleavage[1].
Plecstatin-1 (200 μM; 24 h) induces oxidative stress in HCT-116, HCT-15 and HT-29 colon cancer spheroids, with the most potent effect observed in HCT-116 spheroids, and ROS localizes to proliferative peripheral cells[1].
MedChemExpress (MCE) has not independently confirmed the accuracy of these methods. They are for reference only.
-
Cell Line:HCT-116 human colon carcinoma multicellular tumour spheroids
-
Concentration:200 μM
-
Incubation Time:72 h
-
Result:Caused an approximately 3-fold decrease in the number of KI67+ cells compared to untreated controls.
-
Cell Line:HCT-116, HCT-15, HT-29 human colon carcinoma multicellular tumour spheroids
-
Concentration:200 μM
-
Incubation Time:72 h
-
Result:Induced a minor apoptotic response in HCT-15 and HCT-116 spheroids, with cell death levels reaching approximately 30% in HCT-15 spheroids.
Caused no significant change in apoptotic cell number (10% cell death) in HT-29 spheroids compared to untreated controls.
-
Cell Line:HCT-116, HT-29 human colon carcinoma multicellular tumour spheroids
-
Concentration:200 μM
-
Incubation Time:48 h (cytochrome-c analysis)
72 h (cleaved caspase-3 analysis) -
Result:Caused cytochrome-c release from mitochondria into the cytosol and induced cleavage of caspase-3 in HCT-116 spheroids.
Showed less pronounced cytochrome-c release and caspase-3 cleavage effects in HT-29 spheroids.
-
Cell Line:HCT-116, HT-29 human colon carcinoma multicellular tumour spheroids
-
Concentration:200 μM
-
Incubation Time:72 h
-
Result:Caused collapse of the punctuated plectin network into larger aggregates and reduced plectin mean fluorescence intensity (MFI) in HCT-116 spheroids.
Induced collapse of the α-tubulin microtubule network, with a 5-fold reduction in α-tubulin MFI in HCT-116 spheroids.
Disrupted the F-actin cytoskeleton, forming aggregates with reduced fluorescence signal in HCT-116 spheroids.
Showed less pronounced cytoskeletal disruption effects in HT-29 spheroids.
-
Cell Line:HT1080 human fibrosarcoma multicellular tumour spheroids
-
Concentration:40 μM
-
Incubation Time:72 h, monitored up to 144 h
-
Result:Prevented spheroid invasion into the Matrigel matrix, with treated spheroids remaining smaller and non-invasive compared to larger, invasive untreated spheroids, and this trend maintained up to 144 h.
-
Cell Line:HCT-116 human colon carcinoma multicellular tumour spheroids
-
Concentration:200 μM
-
Incubation Time:24 h
-
Result:Induced phosphorylation of eIF2α, while total eIF2α levels remained consistent with untreated controls.
-
Cell Line:HCT-116, HCT-15, HT-29 human colon carcinoma multicellular tumour spheroids
-
Concentration:200 μM
-
Incubation Time:24 h
-
Result:Increased CRT expression and promoted CRT translocation to the cell membrane (evidenced by colocalization with membrane marker) in HCT-116 spheroids.
Caused up to a 4-fold increase in CRT+ cells compared to untreated controls, with the highest percentage (20%) in HCT-116 spheroids and lowest responsiveness in HT-29 spheroids.
-
Cell Line:HCT-116, HT-29 human colon carcinoma multicellular tumour spheroids
-
Concentration:200 μM
-
Incubation Time:72 h
-
Result:Increased extracellular HMGB-1 levels by approximately 5-fold in HCT-116 spheroids and approximately 3-fold in HT-29 spheroids compared to untreated controls.
Induced translocation of HMGB-1 from the nucleus to the cytoplasm and extracellular space in treated spheroids, with a stronger effect in HCT-116 spheroids.
-
Cell Line:HCT-116, HT-29 human colon carcinoma multicellular tumour spheroids
-
Concentration:200 μM
-
Incubation Time:24 h
-
Result:Increased fluorescence signals for HSP70 and HSP90, with preferred co-localization to the plasma membrane compared to untreated controls.
- Western Blot
- Mammalian live/dead viability and cytotoxicity staining
- Annexin V plus membrane-impermeant dye apoptosis staining
- ROS/oxidative-stress fluorescent staining
- Suspension Spheroid Formation (Low-Adhesion/Forced Aggregation)
- Hanging Drop Spheroid Culture
- 3D Tumor Spheroid Invasion Assay
- Phalloidin F-actin cytoskeleton staining
- Cell Viability Determination by MTT Colorimetric Assay
- Kinase activity and phosphorylation assays
- Detection of Apoptosis
- TUNEL staining for apoptotic DNA fragmentation
- Cell Cytotoxicity Assay
- Apoptosis Solutions
- Protocol for Kinase activity and phosphorylation assays


Chemical Information
-
CAS. Nr. 2119725-22-1
-
Molecular Weight 538.47
-
Formel C22H23Cl2FN2RuS
-
SMILES
[Cl-][Ru+2]12345([CH]6=[CH]47)([N]8=CC=CC=C8C(NC(C=C9)=CC=C9F)=[S]5)[C]6(C(C)C)=[CH]1[CH]2=[C]37C.[Cl-]
-
Versand
Room temperature in continental US; may vary elsewhere.
-
Speicherung
Please store the product under the recommended conditions in the Certificate of Analysis.


Publications (1)
-
Journal Impact Factor
-
Most Recent
-
bioRxiv
The umbrella cell keratin network: organization as a tile-like mesh, formation of a girded layer in response to bladder filling, and dependence on the plectin cytolinker. [Abstract]2024 Jun 13:2024.06.11.598498. PMID: 38915686


Reinheit & Dokumentation
-
Data Sheet (303 KB)
-
SDS (252 KB)
- Français - FR (252 KB)
- Deutsch - DE (252 KB)
- Norwegian - NO (252 KB)
- Español - ES (252 KB)
- Swedish - SV (252 KB)
- Italian - IT (252 KB)
- Korean - KR (252 KB)
- Portuguese - PT (252 KB)
-
Handling Instructions (2659 KB)
Verweise

Calculators
Konzentration (Stammlösung) × Volumen (Stammlösung) = Konzentration (Ziellösung) × Volumen (Ziellösung)


Plecstatin-1 Related Classifications
HY-156675 Related Classifications
 Powered by Bioz
Keywords
- Plecstatin-1
- 2119725-22-1
- Plecstatin1
- Plecstatin 1
- Microtubule/Tubulin
- Eukaryotic Initiation Factor (eIF)
- HSP
- Caspase
- Reactive Oxygen Species (ROS)
- Apoptosis
- endoplasmic reticulum stress
- eukaryotic initiation factor 2-alpha
- F-actin
- HCT-116
- colorectal tumour spheroid
- integrated stress response
- plectin
- immunogenic cell death
- colon adenocarcinoma cell
- α-tubulin
- Inhibitor
- inhibitor
- inhibit