



Trifolirhizin

Based on 1 Customer Validation
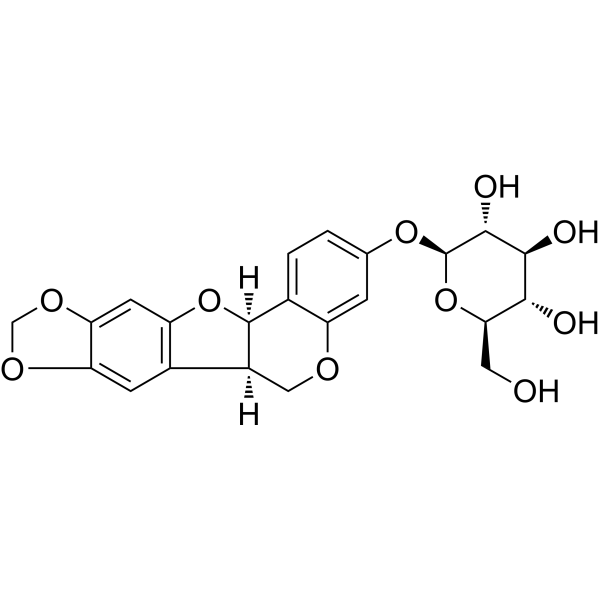
Trifolirhizin is a pterocarpan flavonoid found in the roots of Sophora flavescens. Trifolirhizin is a tyrosinase inhibitor with an IC50 value of 506.77 μM. Trifolirhizin reduces intracellular melanin production and modulates multiple signaling pathways including NFκB-MAPK, AMPK/mTOR, PI3K/Akt, MAPK-NFATc1 and EGFR-MAPK. Trifolirhizin targets biological molecules including PTK6 and COX-2, inhibits the activities of hyaluronidase, collagenase and elastase, induces apoptosis, autophagy and cell cycle arrest, and suppresses the proliferation, migration and invasion of cancer cells. Trifolirhizin exerts diverse pharmacological effects including anti-inflammatory, anti-asthmatic, bone-protective, renoprotective, antibacterial, antifungal, hepatoprotective, antiplatelet, estrogenic and wound-healing activities. Trifolirhizin can be used to investigate a broad range of malignant, inflammatory, metabolic and infectious disorders.
For research use only. We do not sell to patients.
- Purity : 99.82%
- CAS No.: 6807-83-6
- Formula: C22H22O10
- Molecular Weight:446.40
-
Storage:
-20°C, protect from light
* In solvent : -80°C, 6 months; -20°C, 1 month (protect from light)

To place orders, for customer services and technical support, please contact: MedChemExpress USA
Tel: 609-228-6898 E-mail: [email protected] [email protected]


-
 Biological Activity
-
Chemical Information
-
Solvent & Solubility
- Protocols
- Purity & Documentation
- References
-
 Help & FAQs


-
HY-N0381
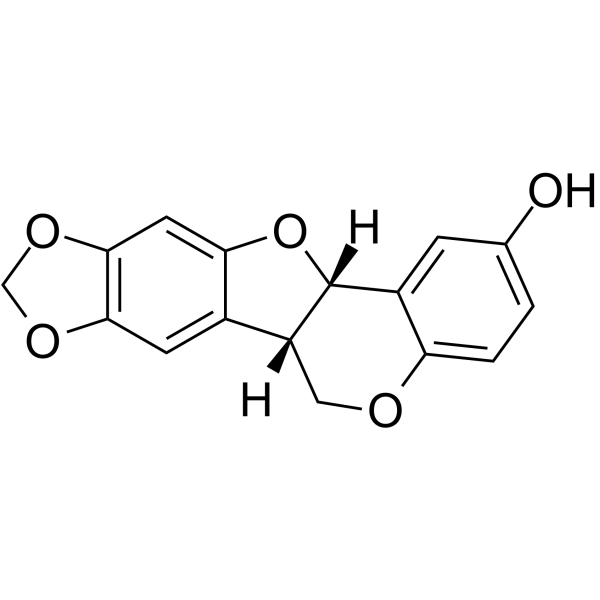
MaackiainAMPK Activator -

HY-N0616R
Trifolirhizin (Standard)Tyrosinase Inhibitor -
HY-W003607
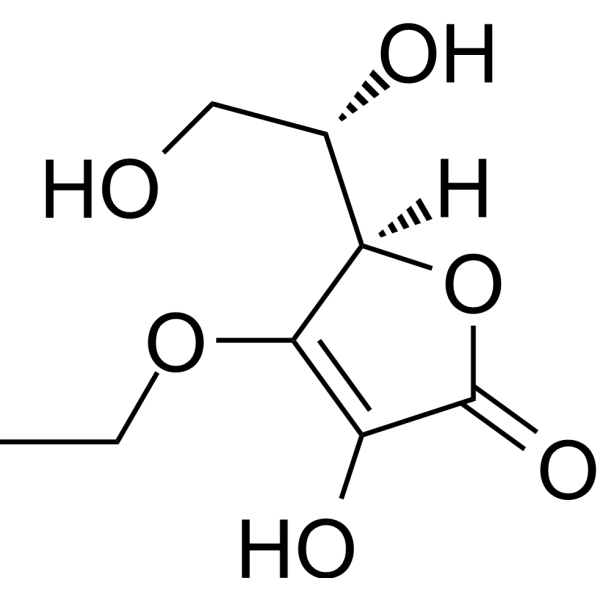
3-O-Ethyl-L-ascorbic acidVitamin C Derivative -
HY-N3266
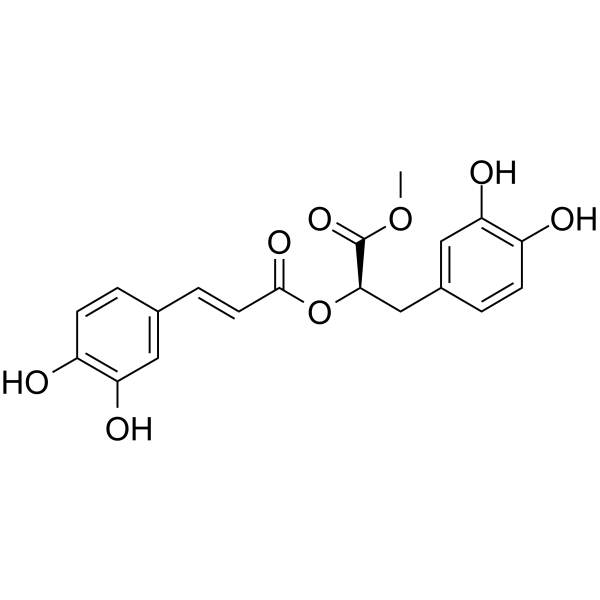
Methyl rosmarinateHydroxycinnamic Acid -
HY-N0192
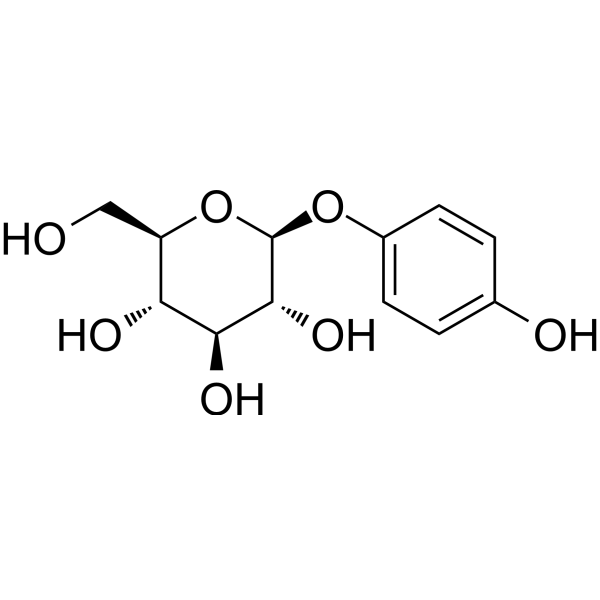
ArbutinEndogenous Metabolite -
HY-N2484
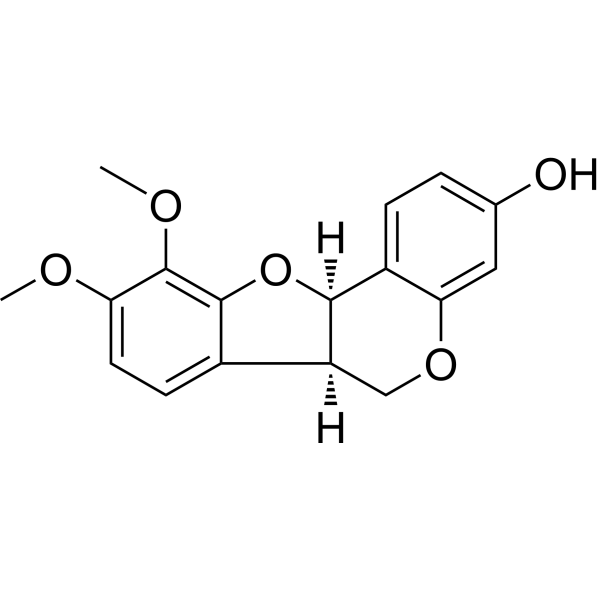
MethylnissolinOsteoclast Inhibitor -
HY-107369
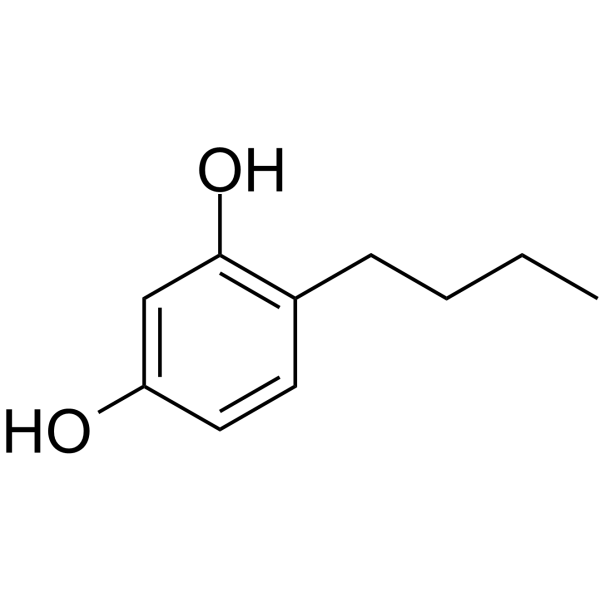
4-ButylresorcinolTyrosinase Inhibitor -

HY-N0192R
Arbutin (Standard)Endogenous Metabolite -
HY-N7135
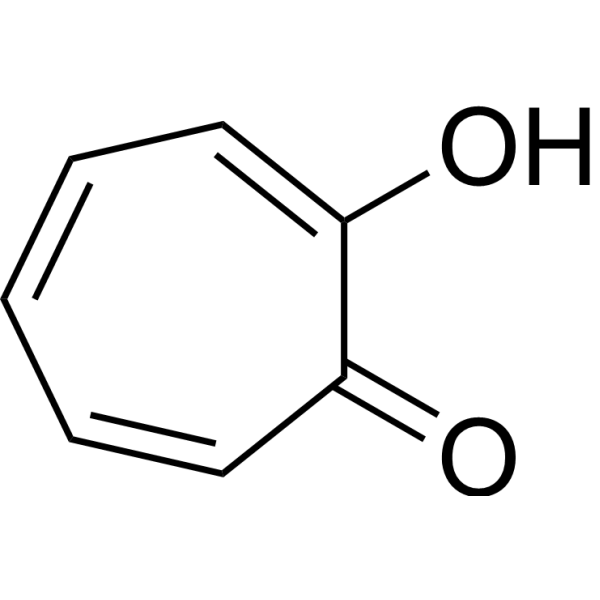
TropoloneTropone Derivatives; Tyrosinase Inhibitor; Virus Inhibitor; Funga Inhibitor -
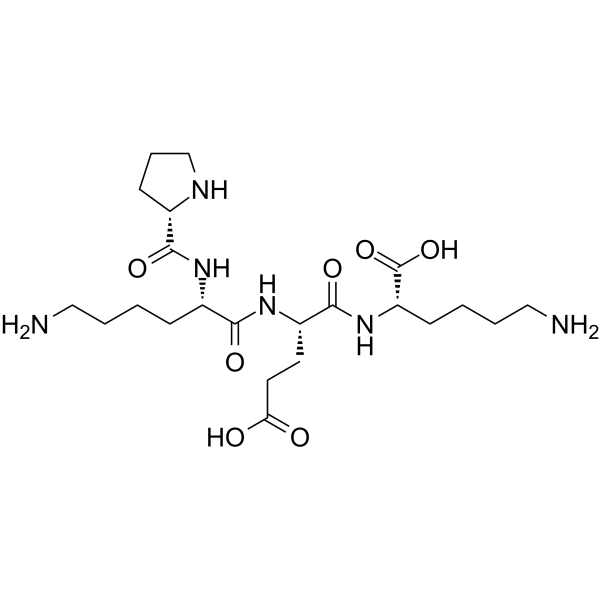
HY-P3452
Tetrapeptide-30Skin-Brightening Peptide -
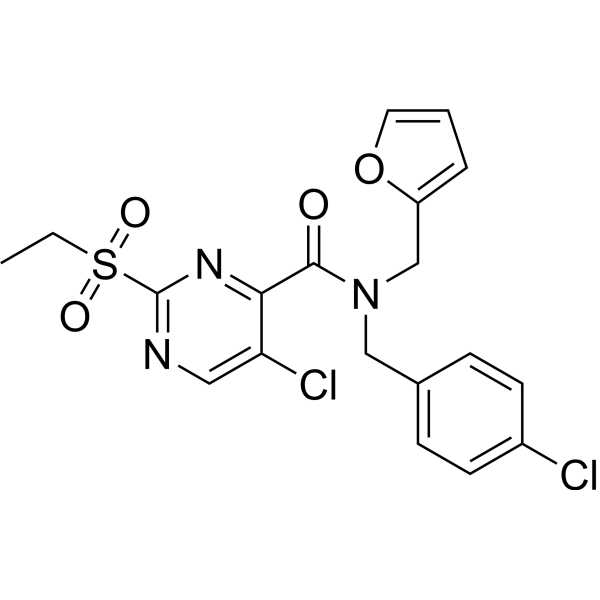
HY-136179
ZAP-180013ZAP-70 Inhibitor -
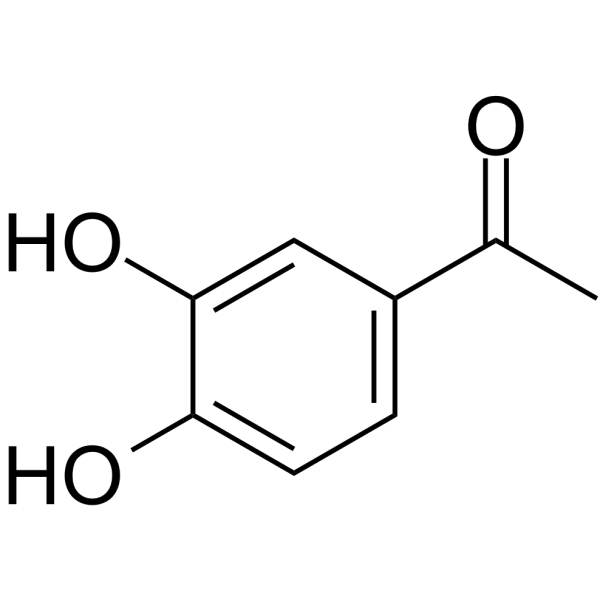
HY-N1775
3',4'-DihydroxyacetophenonePhenolic Compound
All AMPK Isoforms
More

Biological Activity
Description
IC50 & Target
IC50: 506 μM (tyrosinase)[1]
Cellular Effect
|
Cell Line

|
Type | Value | Description | References |
|---|---|---|---|---|
| RAW264.7 | IC50 |
>50 μM
Compound: 22
|
Antiinflammatory activity in mouse RAW264.7 cells assessed as inhibition of LPS-stimulated nitric oxide production after 24 hrs by Griess method
Antiinflammatory activity in mouse RAW264.7 cells assessed as inhibition of LPS-stimulated nitric oxide production after 24 hrs by Griess method
|
[PMID: 26073007] |
| Vero | EC50 |
>300 μg/mL
Compound: Trifolirhizin
|
Antiviral activity against HSV1 in african green monkey Vero cells assessed as virus-induced cytopathic effect after 3 days by MTT assay
Antiviral activity against HSV1 in african green monkey Vero cells assessed as virus-induced cytopathic effect after 3 days by MTT assay
|
[PMID: 9868163] |
In Vitro
Trifolirhizin exerts anti-inflammatory effects in LPS-stimulated mouse J774A.1 macrophages by downregulating TNF-α, IL-6, and COX-2 expression[1].
Trifolirhizin (50-100 μg/mL) inhibits wound-healing related enzymes hyaluronidase, collagenase, and elastase, with maximum inhibition observed at 100 μg/mL[1].
Trifolirhizin (1-500 μg/mL; 12.5-50 μM) exhibits skin-whitening activity by inhibiting tyrosinase (IC50 = 506.77 μM) and reducing melanin production in IBMX-induced B16 melanoma cells (IC50 = 36 μM)[1].
Trifolirhizin (10-40 μM) inhibits RANKL-induced osteoclast formation and bone resorption in mouse BMMs at 10, 20, and 40 μM by downregulating NFATc1 and osteoclast marker genes[1].
Trifolirhizin (270-360 μM) inhibits proliferation and induces apoptosis in HL-60 human leukemia cells, while sparing normal lymphocytes at 270-360 μM[1].
Trifolirhizin (5-250 μM) exerts dose-dependent antiproliferative activity in A2780 human ovarian cancer cells (effective at ≥50 μM) and H23 human lung cancer cells (effective at 250 μM)[1].
Trifolirhizin (20-40 μg/mL) inhibits proliferation and induces apoptosis in MKN45 human gastric cancer cells (IC50 = 33.27 μg/mL) via cell cycle arrest and modulation of EGFR-MAPK signaling, while exhibiting low toxicity to normal kidney and liver cell lines[1].
Trifolirhizin induces autophagy-dependent apoptosis in HCT116 and SW620 human colorectal cancer cells by activating the AMPK/mTOR signaling pathway[1].
Trifolirhizin inhibits proliferation, migration, and invasion of 6-10 B and HK1 human nasopharyngeal carcinoma cells, with IC50 values of 83.67 μmol/L and 33.21 μmol/L at 72 h, by suppressing the PI3K/Akt signaling pathway[1].
Trifolirhizin (12.5-100 μg/mL; 50.0 μg/mL combined with sorafenib) exhibits dose-dependent antiproliferative activity in MHCC97H, MHCC97L, and HepG2 human hepatocellular carcinoma cells, and synergistically enhances the anticancer effects of sorafenib by inducing apoptosis and modulating cell cycle and signaling pathways[1].
Trifolirhizin (0.005-2 mg/mL) inhibits proliferation and induces apoptosis in C666-1 human nasopharyngeal carcinoma cells by targeting PTK6 and modulating autophagy-related markers[1].
Trifolirhizin (100 μg/mL) exhibits antibacterial activity against Helicobacter pylori at 100 μg/mL[1].
Trifolirhizin (10-25 μM; 2 h pre-incubation, 24 h LPS treatment) dose-dependently inhibits LPS-induced TNF-α and IL-6 mRNA expression in mouse J774A.1 macrophages, with complete inhibition of TNF-α mRNA observed at 25 μM[2].
Trifolirhizin (10-25 μM) dose-dependently inhibits LPS-induced TNF-α protein production in mouse J774A.1 macrophages, with no significant effect on IL-6 protein production[2].
Trifolirhizin (100-200 μM; 2 h pre-incubation, 24 h LPS treatment) dose-dependently inhibits LPS-induced COX-2 protein expression in mouse J774A.1 macrophages, with 14% inhibition at 100 μM and 28% inhibition at 200 μM[2].
Trifolirhizin (0-250 μM; 24 h) dose-dependently inhibits proliferation of human A2780 ovarian cancer cells (with significant 50% growth inhibition at 100 μM) and human H23 lung cancer cells (with significant activity only at 250 μM) after 24 h of incubation[2].
Trifolirhizin (10-40 μM; 6 h) accelerates autophagy flux in HCT116 and SW620 human colorectal cancer cells, as evidenced by altered autophagy marker protein expression, formation of autophagic vacuoles, and increased autophagosome and autophagolysosome formation[3].
Trifolirhizin (10-40 μM) activates the AMPK/mTOR signaling pathway in HCT116 and SW620 human colorectal cancer cells, which is essential for its induction of autophagy[3].
Trifolirhizin (10-45 μM; 48 h) induces caspase-mediated extrinsic pathway apoptosis in HCT116 and SW620 human colorectal cancer cells, reducing cell viability and colony formation[3].
Trifolirhizin (20 μM)-induced apoptosis in HCT116 and SW620 human colorectal cancer cells is dependent on AMPK activation and autophagy induction, with co-localization of autophagic and apoptotic markers confirming autophagy-mediated cell death[3].
MedChemExpress (MCE) has not independently confirmed the accuracy of these methods. They are for reference only. Further protocols information, click here.
-
Cell Line:mouse J774A.1 macrophage cells
-
Concentration:10-25 μM
-
Incubation Time:2 h (pre-incubation); 24 h (LPS treatment)
-
Result:Significantly inhibited LPS-induced increases in TNF-α and IL-6 mRNA expression in a dose-dependent manner.
Completely inhibited the LPS-induced increase of TNF-α mRNA levels at 25 μM.
-
Cell Line:mouse J774A.1 macrophage cells
-
Concentration:100-200 μM
-
Incubation Time:2 h (pre-incubation); 24 h (LPS treatment)
-
Result:Dose-dependently inhibited LPS-stimulated COX-2 protein expression.
Suppressed LPS-induced COX-2 protein production by 14% at 100 μM.
Suppressed LPS-induced COX-2 protein production by 28% at 200 μM, based on the density ratio of COX-2 versus β-actin.
-
Cell Line:human A2780 ovarian cancer cells, human H23 lung cancer cells
-
Concentration:0-250 μM
-
Incubation Time:24 h
-
Result:Dose-dependently suppressed the proliferation of both A2780 ovarian and H23 lung cancer cells.
Showed no antiproliferative activity at concentrations less than 50 μM in either cell line.
Achieved significant 50% growth inhibition in A2780 cells at 100 μM.
Showed significant antiproliferative activity in H23 cells only at 250 μM.
-
Cell Line:HCT116, SW620
-
Concentration:10-40 μM (immunoblotting); 20 μM (transmission electron microscopy, Ad-mCherry-GFP-LC3B fluorescent assay)
-
Incubation Time:6 h (transmission electron microscopy, Ad-mCherry-GFP-LC3B fluorescent assay)
-
Result:Caused dose-related accumulation of LC3B-I and LC3B-II, and increased the LC3B-II/I expression ratio.
Downregulated SQSTM-1 protein expression in both cell lines.
Decreased SQSTM1 content while increased LC3B-II and poly-ubiquitin aggregated in detergent-insoluble fractions.
Revealed autophagic vacuoles (double-membrane compartments with lamellar structures) in treated cells.
Showed increased green (autophagosomes) and red (autophagolysosomes) dots, indicating accelerated autophagy flux.
Impaired trifolirhizin-induced autophagy flux when co-treated with autophagy inhibitors.
-
Cell Line:HCT116, SW620
-
Concentration:10-45 μM (CCK-8 assay); 10-40 μM (immunoblotting assays)
-
Incubation Time:48 h (CCK-8 assay)
-
Result:Reduced cell viability in a dose-dependent manner.
Inhibited long-term colony formation.
Induced both early and late apoptosis in both cell lines.
Showed unchanged cleaved caspase-9 and cytochrome c expression, but increased cleaved poly ADP-ribose polymerase, cleaved caspase-3, and cleaved caspase-8 expression.
Decreased trifolirhizin's cytotoxicity when co-treated with Z-VAD-FMK.
Parmacokinetics
In Vivo
Trifolirhizin (20 mg/kg; single treatment) exhibits strong estrogenic activity in young female Wistar rats, increasing uterine weight by over 90%[1].
Trifolirhizin (4.5 mg/kg; single treatment) reduces carrageenan-induced hind paw edema in Wistar rats by 35%[1].
Trifolirhizin (10-20 mg/kg; intraperitoneal injection; daily; 6 weeks) protects against ovariectomy-induced bone loss in female C57BL/6J mice by reducing osteoclast number and bone resorption[1].
Trifolirhizin (5-10 mg/kg; periosteal injection; days 2, 4, 6, and 8 post-LPS exposure) prevents LPS-induced inflammatory osteolysis in male C57BL/6J mice in vivo in a dose-dependent manner by reducing osteoclast formation and bone destruction[1].
Trifolirhizin (1-3 mg/kg; daily; 21 days) inhibits gastric tumor growth in BALB/C nude mice, reducing tumor weight and increasing tumor cell apoptosis while decreasing proliferation[1].
Trifolirhizin (10 mg/kg; once every 3 days; 21 days) suppresses colorectal xenograft tumor growth in C57BL/6 mice by activating the AMPK/mTOR pathway to induce autophagy and caspase-mediated extrinsic apoptosis[1].
Trifolirhizin (40 mg/kg; every other day; 14 days) inhibits nasopharyngeal carcinoma xenograft tumor growth in male nude mice without causing damage to normal kidney or liver tissue[1].
Trifolirhizin (12.5-50 mg/kg; intraperitoneal injection; single dose) exerts anti-ulcerative colitis effects in DSS-induced C57BL/6 mice by regulating Th17/Treg balance and suppressing the NLRP3 inflammasome via the AMPK-TXNIP pathway[1].
Trifolirhizin (12.5-50 mg/kg; daily; 3 weeks) relieves renal injury in male db/db diabetic nephropathy mice by inducing autophagy, inhibiting oxidative stress, and regulating the PI3K/AKT/mTOR pathway[1].
Trifolirhizin (2-5 mg/kg; daily) mitigates ovalbumin-induced asthma in neonatal Sprague Dawley rats in vivo in a dose-dependent manner by reducing pulmonary inflammation and tissue damage via modulation of the NF-κB pathway[1].
Trifolirhizin (10 mg/kg) significantly suppresses colorectal cancer xenograft growth in C57BL/6 mice, activates the AMPK/mTOR autophagy pathway, and induces extrinsic apoptosis in tumor cells[3].
MedChemExpress (MCE) has not independently confirmed the accuracy of these methods. They are for reference only.
-
Animal Model:Wistar rats[1]
-
Dosage:7.5 mg/kg (20.7 μmol/kg)
-
Administration:daily; 5 days prior to carbon tetrachloride exposure and continued for study duration
-
Result:Significantly reduced serum levels of SGOT, SGPT, ALP, and total bilirubin.
Increased liver non-protein sulfhydryl group levels compared to the carbon tetrachloride-only group.
-
Animal Model:C57BL/6J mice (female; ovariectomy-induced bone loss)[1]
-
Dosage:10 mg/kg; 20 mg/kg
-
Administration:intraperitoneal injection; daily; 6 weeks
-
Result:Reduced ovariectomy-induced bone loss.
Decreased number of TRAP-positive osteoclasts in tibial tissue.
High-dose treatment significantly recovered trabecular bone structure on μCT analysis.
-
Animal Model:C57BL/6J mice (male; LPS-induced cranial bone inflammation and bone loss)[1]
-
Dosage:5 mg/kg; 10 mg/kg
-
Administration:periosteal injection; days 2, 4, 6, and 8 post-LPS exposure
-
Result:Dose-dependently reduced LPS-induced osteolysis.
Increased bone volume/tissue volume (BV/TV).
Decreased bone destruction area.
Reduced number of TRAP-positive osteoclasts and IL-1β-positive area in cranial cap tissue.
-
Animal Model:C57BL/6 mice (DSS-induced colitis)[1]
-
Dosage:12.5 mg/kg; 25 mg/kg; 50 mg/kg
-
Administration:intraperitoneal injection; single dose
-
Result:Dose-dependently reduced disease activity index (DAI).
Increased colon length in 25 and 50 mg/kg groups.
Improved body weight.
Downregulated mRNA and protein expression of TNF-α, IL-6, and IL-1β in colon tissue.
Suppressed p-NF-κB/NF-κB and RORγt protein expression.
Increased Foxp3 expression.
Reduced Th17 (CD4+ IL17+) cells and increased Treg (CD4+ CD25+ Foxp3+) cells in mesenteric lymph nodes and spleen.
Suppressed NLRP3 inflammasome components (NLRP3, caspase 1, ASC).
Regulated the AMPK-TXNIP pathway by reducing p-AMPK/AMPK and increasing TXNIP.
-
Animal Model:db/db mice (male; spontaneous type 2 diabetes-induced renal injury)[1]
-
Dosage:12.5 mg/kg; 25 mg/kg; 50 mg/kg
-
Administration:daily; 3 weeks
-
Result:Reduced body and renal weight.
Decreased fasting blood glucose.
Improved renal histopathology (reduced glomerular hypertrophy, tubular basement membrane thickening, mesangial matrix expansion).
Reduced serum BUN and creatinine.
Suppressed renal tissue apoptosis via TUNEL assay.
Decreased MDA and ROS levels.
Increased SOD levels.
Upregulated LC3II and Beclin1 expression.
Downregulated p62, p-PI3K/PI3K, p-AKT/AKT, and p-mTOR/mTOR expression in renal tissue.
-
Animal Model:Sprague Dawley rats (neonatal; ovalbumin-induced pulmonary inflammation and tissue damage)[1]
-
Dosage:2 mg/kg; 4 mg/kg; 5 mg/kg
-
Administration:daily
-
Result:Dose-dependently reduced serum IgE levels.
Suppressed histological scores (reduced tissue damage, inflammatory cell aggregation, and pulmonary edema).
Downregulated lung Muc5AC and Muc5B gene expression.
Reduced BALF levels of TNF-α, ICAM-1, IL-4, IL-5, and IL-13.
Upregulated lung IκBα protein expression.


Chemical Information
-
CAS No. 6807-83-6
-
Appearance Solid
-
Molecular Weight 446.40
-
Formula C22H22O10
-
Color White to off-white
-
SMILES
O[C@H]([C@@H](O)[C@@H]1O)[C@@H](O[C@@H]1CO)OC2=CC=C3C(OC[C@]4([H])[C@@]3([H])OC5=C4C=C(OCO6)C6=C5)=C2
-
Structure Classification
-
Shipping
Room temperature in continental US; may vary elsewhere.
-
Storage
-20°C, protect from light
* In solvent : -80°C, 6 months; -20°C, 1 month (protect from light)


Solvent & Solubility
In Vitro:
DMSO : 100 mg/mL (224.01 mM; Need ultrasonic; Hygroscopic DMSO has a significant impact on the solubility of product, please use newly opened DMSO)
Please refer to the solubility information to select the appropriate solvent. Once prepared, please aliquot and store the solution to prevent product inactivation from repeated freeze-thaw cycles.
Storage method and period of stock solution: -80°C, 6 months; -20°C, 1 month (protect from light). When stored at -80°C, please use it within 6 months. When stored at -20°C, please use it within 1 month.
Please refer to the solubility information to select the appropriate solvent. Once prepared, please aliquot and store the solution to prevent product inactivation from repeated freeze-thaw cycles.
Storage method and period of stock solution: -80°C, 6 months; -20°C, 1 month (protect from light). When stored at -80°C, please use it within 6 months. When stored at -20°C, please use it within 1 month.
Concentration (start) × Volume (start) = Concentration (final) × Volume (final)
In Vivo:
Select the appropriate dissolution method based on your experimental animal and administration route.
- For the following dissolution methods, please ensure to first prepare a clear stock solution using an In Vitro approach and then sequentially add co-solvents:
- To ensure reliable experimental results, the clarified stock solution can be appropriately stored based on storage conditions. As for the working solution for In Vivo experiments, it is recommended to prepare freshly and use it on the same day.
- The percentages shown for the solvents indicate their volumetric ratio in the final prepared solution. If precipitation or phase separation occurs during preparation, heat and/or sonication can be used to aid dissolution.
Add each solvent one by one: 10% DMSO 40% PEG300 5% Tween-80 45% Saline
Solubility: ≥ 2.5 mg/mL (5.60 mM); Clear solution
This protocol yields a clear solution of ≥ 2.5 mg/mL (saturation unknown).
Taking 1 mL working solution as an example, add 100 μL DMSO stock solution (25.0 mg/mL) to 400 μL PEG300, and mix evenly; then add 50 μL Tween-80 and mix evenly; then add 450 μL Saline to adjust the volume to 1 mL.
Preparation of Saline: Dissolve 0.9 g sodium chloride in ddH₂O and dilute to 100 mL to obtain a clear Saline solution.
Add each solvent one by one: 10% DMSO 90% (20% SBE-β-CD in Saline)
Solubility: ≥ 2.5 mg/mL (5.60 mM); Clear solution
This protocol yields a clear solution of ≥ 2.5 mg/mL (saturation unknown).
Taking 1 mL working solution as an example, add 100 μL DMSO stock solution (25.0 mg/mL) to 900 μL 20% SBE-β-CD in Saline, and mix evenly.
Preparation of 20% SBE-β-CD in Saline (4°C, storage for one week): 2 g SBE-β-CD powder is dissolved in 10 mL Saline, completely dissolve until clear.
In Vivo Dissolution Calculator
Please enter the basic information of animal experiments:
-
-
-
-
Recommended: Prepare an additional quantity of animals to account for potential losses during experiments.
Please enter your animal formula composition:
-
%DMSO +
Recommended: Keep the proportion of DMSO in working solution below 2% if your animal is weak.
-
%+
-
+%Tween-80 + +
-
%Saline +
The co-solvents required include: DMSO, . All of co-solvents are available by MedChemExpress (MCE). , Tween 80. All of co-solvents are available by MedChemExpress (MCE).
Working solution concentration: 0.22 mg/mL
Method for preparing stock solution: mg drug dissolved in μL DMSO. Stock solution concentration: mg/mL. * In solvent : -80°C, 6 months; -20°C, 1 month (protect from light)
1. Take μL DMSO stock solution;
2. Add μL .
μL , mix evenly;
3. Then add μL Tween 80, mix evenly;
4. Then add μL
Please ensure that the stock solution in the first step is dissolved to a clear state, and add co-solvents in sequence. You can use ultrasonic heating (ultrasonic cleaner, recommended frequency 20-40 kHz), vortexing, etc. to assist dissolution.

Protocols
-
Research Protocol for Infectious Diseases
Infectious-disease experiments test how pathogens interact with host barriers, innate immune receptors, inflammatory signaling, pathogen replication, and tissue injury; pattern-recognition receptors such as TLRs, RIG-I-like receptors, NOD-like receptors, and inflammasomes detect microbial molecules and activate NF-κB, interferon, and cytokine responses. The central hypothesis is that infection severity reflects the balance between pathogen burden and host response: protective inflammation restricts pathogen growth, whereas excessive or mislocalized inflammation contributes to tissue damage and disease phenotype. Unresolved questions include which host pathways are protective versus pathogenic, why some infection models fail to translate to human disease, and which combined readouts best predict clinically relevant infection outcomes.
-
Annexin V plus membrane-impermeant dye apoptosis staining
Annexin V-based apoptosis assays rely on the detection of phosphatidylserine (PS) externalization from the inner leaflet of the plasma membrane to the outer leaflet, an early biochemical hallmark of apoptosis. Fluorescently labeled Annexin V binds PS in a calcium-dependent manner, enabling identification of early apoptotic cells by flow cytometry or fluorescence microscopy. When combined with a membrane-impermeant DNA-binding dye (e. g. , propidium iodide), this approach allows discrimination between viable (Annexin V−/dye−), early apoptotic (Annexin V+/dye−), and late apoptotic or necrotic (Annexin V+/dye+) cell populations by assessing membrane integrity and PS exposure.
-
BrdU Incorporation Assay
Bromodeoxyuridine (BrdU) incorporation assay is based on the principle that BrdU, a thymidine analog, is incorporated into newly synthesized DNA during the S phase of the cell cycle, thereby serving as a marker of DNA replication and cellular proliferation. Incorporated BrdU can be detected using anti-BrdU antibodies following DNA denaturation, enabling visualization or quantification of proliferating cells through immunochemical detection methods such as immunofluorescence or immunohistochemistry.
-
Cell migration
Cell migration is a method that plays an important role in wound healing, cell differentiation, embryonic development, etc.
-
Protocol for Cell Cycle
Cell-cycle analysis by flow cytometry measures DNA content in single cells to estimate the fraction of cells in G0/G1, S, and G2/M phases. Propidium iodide intercalates into DNA, and after RNA removal with RNase, fluorescence intensity reflects cellular DNA content: 2N cells are assigned to G0/G1, cells between 2N and 4N to S phase, and 4N cells to G2/M. DNA-content analysis alone cannot reliably separate G0 from G1 or G2 from M. Ki-67 can distinguish quiescent G0 cells from cycling cells, EdU or BrdU incorporation marks active DNA synthesis in S phase, and phospho-histone H3 staining identifies mitotic cells within the 4N population.
-
Research Protocol for Inflammation-related Diseases
The NLRP3 inflammasome is a cytosolic innate immune signaling platform that integrates priming signals and danger-signal activation to promote caspase-1 activation, maturation of IL-1β and IL-18, and gasdermin D-mediated pyroptotic cell death. The core experimental logic is to determine whether inflammatory disease phenotypes are driven by increased NLRP3 expression, ASC-containing inflammasome assembly, caspase-1 cleavage, GSDMD cleavage, and extracellular release of IL-1β/IL-18 rather than by nonspecific cell injury alone. The pathway is strongly linked to inflammation-related disease phenotypes because monosodium urate crystals activate NALP3/NLRP3 inflammasome signaling in gout-like crystal inflammation, cholesterol crystals activate NLRP3 inflammasomes in atherogenesis models, and DSS-induced intestinal inflammation has been reported to involve NLRP3 inflammasome activity. However, experimental colitis studies also show context-dependent protective effects of NLRP3 inflammasome co
-
Cell Viability Determination by MTT Colorimetric Assay
The following protocol uses the MTT colorimetric assay as a classic literature-established method for assessing cell viability/metabolic activity in cultured mammalian cells. MTT[3-(4,5-dimethylthiazol-2-yl)-2,5-diphenyltetrazolium bromide] is reduced by metabolically active cells to a colored formazan product; the amount of formazan is quantified spectrophotometrically and provides an indirect measure of metabolically active viable cells. Importantly, MTT reduction reflects cellular oxidoreductase/metabolic activity rather than an absolute direct count of living cells, so changes in cellular metabolism can alter the signal independently of cell number.
-
Apoptosis
Apoptosis, also called programmed cell death, is generally characterized by distinct morphological characteristics.
-
TUNEL staining for apoptotic DNA fragmentation
TUNEL staining detects DNA strand breaks by using terminal deoxynucleotidyl transferase to add labeled nucleotides to exposed 3′-OH DNA termini, generating either microscopic staining in fixed cells or tissue sections, or fluorescence/cytometric signal in cell suspensions. TUNEL positivity reflects DNA fragmentation but should not be interpreted alone as definitive apoptosis, because TUNEL can also label necrotic, autolytic, mechanically damaged, or DNA-repair-associated DNA breaks.
-
Cell Cytotoxicity Assay
Cytotoxicity assays are usually based on the assessment of cell membrane damage, which can also be indirectly detected by measuring cell viability. Detection methods include MTT assay, CKK-8 assay, LDH assay and ATP assay, etc.
-
Flow cytometric DNA-content cell-cycle staining
Flow cytometric DNA-content cell-cycle staining measures the fluorescence intensity of DNA-bound fluorochromes in single cells or nuclei to estimate DNA content distributions, allowing assignment of populations to G0/G1, S, and G2/M phases by DNA histogram deconvolution. Propidium iodide (PI) intercalates into DNA, and PI fluorescence is proportional to cellular DNA content when staining is performed under conditions that make DNA accessible and minimize non-DNA signal. Cells with G2/M DNA content are expected to show approximately twice the fluorescence intensity of G0/G1 cells, while S-phase cells occupy intermediate fluorescence values. PI-based DNA-content analysis can also detect cells with fractional DNA content, often reported as sub-G1, when DNA fragmentation and extraction during staining reduce retained DNA signal in apoptotic cells. DAPI is an alternative DNA fluorochrome for univariate DNA-content analysis, while bivariate approaches combining DNA content with proliferation
-
Autophagy
Autophagy is a process in which eukaryotic cells use lysosomes to degrade their own cytoplasmic proteins and damaged organelles under the regulation of autophagy related gene (Atg). Microtubule-associated proteins light chain 3 (LC3) is recognized as autophagy marker, which transfers from cytoplasmic LC3 (LC3-I) to membrane type (LC3-II). LC3-II/I ratio could be detected by Western Blot and fluorescence microscopy.
-
Apoptosis Solutions
Apoptosis is a regulated, generally non-lytic cell-death pathway that removes unwanted, damaged, infected, or abnormal cells through coordinated morphological changes, caspase activation, DNA fragmentation, and membrane remodeling. The intrinsic apoptosis pathway is controlled mainly by mitochondrial outer membrane permeabilization, BCL-2 family proteins, cytochrome c release, apoptosome formation, caspase-9 activation, and downstream executioner caspase-3/7 activation. The extrinsic apoptosis pathway is initiated by death receptors such as Fas, TNFR, and TRAIL receptors, which recruit adaptor proteins and activate caspase-8 before engaging executioner caspases or mitochondrial amplification through BID cleavage. Apoptosis is linked to many phenotypes, including cancer cell killing, tissue homeostasis, immune regulation, neurodegeneration, infection response, and treatment-induced cytotoxicity; unresolved questions include how apoptosis interacts with necroptosis, pyroptosis, ferroptos
-
Cell invasion
Cell invasion is the ability of cells to migrate from one area to another via the extracellular matrix. Cell invasion is the response of normal and cancer cells to chemical and mechanical stimuli. Before migrating to a new region, the extracellular matrix is degraded by proteases within the cell. Cell invasion often occurs during wound repair, vascularization and inflammation, abnormal tissue invasion, and tumor cell metastasis.
-
Lysosome and acidic-vesicle live-cell staining
Lysosome and acidic-vesicle live-cell staining detects acidic intracellular compartments by using membrane-permeant acidotropic probes that accumulate in low-pH vesicles, including lysosomes, late endosomes, autolysosomes, and acidic phagosomes. LysoTracker staining is commonly used as an intensity-based readout of acidic lysosomal compartment abundance or enlargement, while acridine orange produces green fluorescence in less concentrated compartments and red fluorescence after concentration-dependent accumulation in acidic vesicular organelles. Loss or reduction of acridine-orange red signal can be used as a readout of lysosomal membrane permeabilization or reduced acidic-vesicle integrity. This protocol is designed for live cultured cells and can be adapted for fluorescence microscopy, high-content imaging, plate-reader readout, or flow cytometry when the selected literature supports the readout. Because these dyes report acidotropic accumulation rather than lysosome identity alone,
-
Macroautophagy Solutions
Macroautophagy is a conserved lysosome-dependent degradation pathway in which cytoplasmic material is sequestered into double-membrane autophagosomes and delivered to lysosomes for degradation and recycling. The pathway supports cellular homeostasis during nutrient limitation, organelle stress, protein-aggregate accumulation, infection, differentiation, and tissue remodeling by coupling cargo sequestration, autophagosome maturation, lysosomal fusion, and degradation of cargo-derived macromolecules. The core molecular sequence includes initiation by nutrient- and stress-regulated autophagy machinery, autophagosome nucleation, LC3/ATG8-family conjugation to autophagosomal membranes, cargo selection through receptors such as SQSTM1/p62, autophagosome-lysosome fusion, and lysosomal degradation. LC3 was identified as a mammalian homolog of yeast Atg8 that localizes to autophagosomal membranes after processing, and p62/SQSTM1 was shown to connect ubiquitinated cargo with autophagic degradati


Purity & Documentation
-
Data Sheet (296 KB)
-
SDS (598 KB)
- English - EN (598 KB)
- Français - FR (598 KB)
- Deutsch - DE (598 KB)
- Norwegian - NO (598 KB)
- Español - ES (598 KB)
- Swedish - SV (598 KB)
- Italian - IT (598 KB)
- Korean - KR (598 KB)
- Portuguese - PT (598 KB)
-
Handling Instructions (2659 KB)
References
[1]. Jaiswal V, et al. Trifolirhizin: A Phytochemical with Multiple Pharmacological Properties. Molecules. 2025;30(2):383. Published 2025 Jan 17. [Content Brief]
[2]. Zhou H, et al. Anti-Inflammatory and antiproliferative activities of trifolirhizin, a flavonoid from Sophora flavescens roots. J Agric Food Chem. 2009;57(11):4580-4585. [Content Brief]
[3]. Sun D, et al. Trifolirhizin induces autophagy-dependent apoptosis in colon cancer via AMPK/mTOR signaling. Signal Transduct Target Ther. 2020 Aug 27;5(1):174. [Content Brief]


Complete Stock Solution Preparation Table
Please refer to the solubility information to select the appropriate solvent. Once prepared, please aliquot and store the solution to prevent product inactivation from repeated freeze-thaw cycles.
Storage method and period of stock solution: -80°C, 6 months; -20°C, 1 month (protect from light). When stored at -80°C, please use it within 6 months. When stored at -20°C, please use it within 1 month.
| Optional Solvent | Concentration Solvent Mass | 1 mg | 5 mg | 10 mg | 25 mg |
|---|---|---|---|---|---|
| DMSO | 1 mM | 2.2401 mL | 11.2007 mL | 22.4014 mL | 56.0036 mL |
| 5 mM | 0.4480 mL | 2.2401 mL | 4.4803 mL | 11.2007 mL | |
| 10 mM | 0.2240 mL | 1.1201 mL | 2.2401 mL | 5.6004 mL | |
| 15 mM | 0.1493 mL | 0.7467 mL | 1.4934 mL | 3.7336 mL | |
| 20 mM | 0.1120 mL | 0.5600 mL | 1.1201 mL | 2.8002 mL | |
| 25 mM | 0.0896 mL | 0.4480 mL | 0.8961 mL | 2.2401 mL | |
| 30 mM | 0.0747 mL | 0.3734 mL | 0.7467 mL | 1.8668 mL | |
| 40 mM | 0.0560 mL | 0.2800 mL | 0.5600 mL | 1.4001 mL | |
| 50 mM | 0.0448 mL | 0.2240 mL | 0.4480 mL | 1.1201 mL | |
| 60 mM | 0.0373 mL | 0.1867 mL | 0.3734 mL | 0.9334 mL | |
| 80 mM | 0.0280 mL | 0.1400 mL | 0.2800 mL | 0.7000 mL | |
| 100 mM | 0.0224 mL | 0.1120 mL | 0.2240 mL | 0.5600 mL |


Trifolirhizin Related Classifications
HY-N0616 Related Classifications
 Powered by Bioz