



Hyaluronic acid
Based on 21 publication(s) in Google Scholar
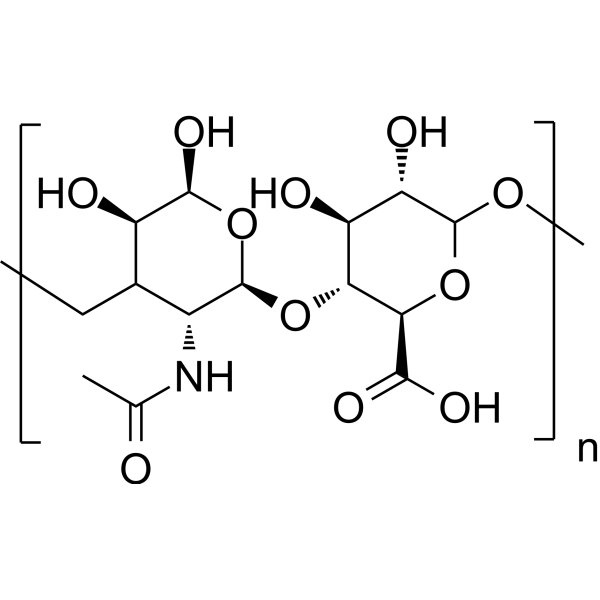
Hyaluronic acid is a biopolymer composed of repeating units of disaccharides with various applications. Hyaluronic acid is a major component of the extracellular matrix (ECM). Hyaluronic acid is synthesized at the plasma membrane. Increased hyaluronic acid levels are associated with tumor cell growth, adhesion, migration, invasion and angiogenesis in digestive cancers. Hyaluronic acid participates in tissue remodeling and rapid cell proliferation in some physiological processes including embryonic morphogenesis and wound-healing. Hyaluronic acid activates the PI3K-Akt signaling. Hyaluronic acid acts as a regulator of cancer-associated lymphangiogenesis. Hyaluronic acid also enhances cell invasion and angiogenesis by promoting proteolytic MMP-9 binding to cell surface or stimulating MMP-9 binding to cell surface. Hyaluronic acid can be used as drug delivery for sodium butyrate to improve the anti-proliferative activity on breast cancer cell line. Hyaluronic acid can be studied in joint diseases, wound healing and cancer.
For research use only. We do not sell to patients.
- CAS No.: 9004-61-9
- Formula: (C14H21NO11)n
- Molecular Weight:379.32 (monomer)
-
Storage:
4°C, protect from light
* In solvent : -80°C, 6 months; -20°C, 1 month (protect from light)

To place orders, for customer services and technical support, please contact: MedChemExpress USA
Tel: 609-228-6898 E-mail: [email protected] [email protected]


-
 Biological Activity
-
Chemical Information
-
Solvent & Solubility
- Protocols
- Purity & Documentation
- References
-
 Help & FAQs


-
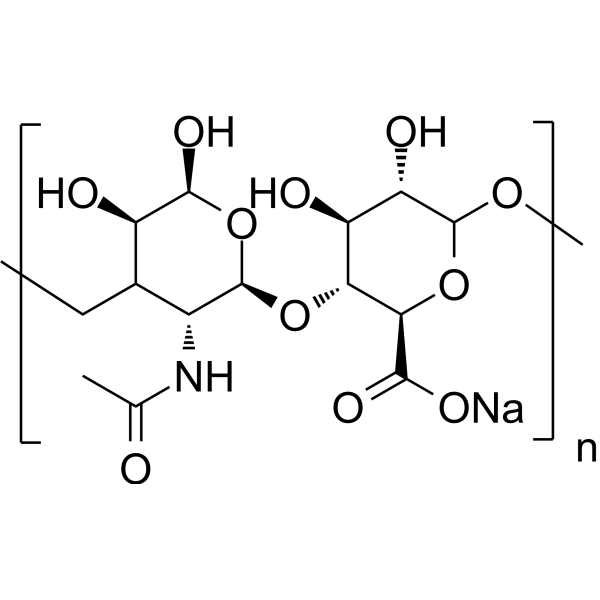
HY-B0633
Hyaluronic acid sodiumGlycosaminoglycan -

HY-B0633B
Hyaluronic acid (MW 50000-100000)Biopolymer -
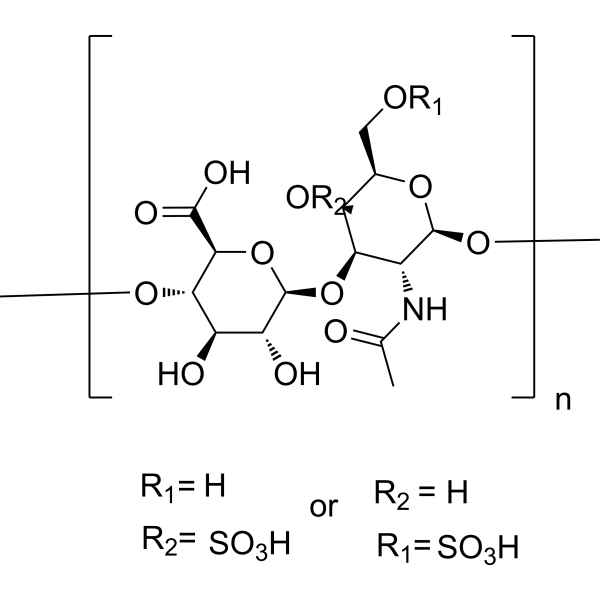
HY-B2162
Chondroitin sulfateGlycosaminoglycan -
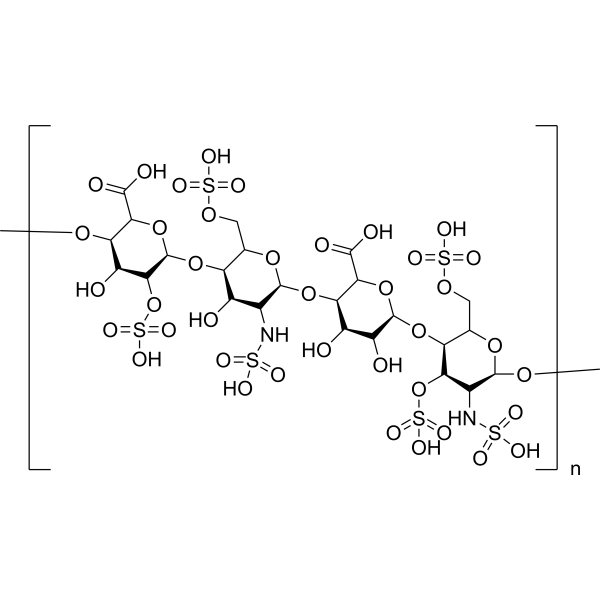
HY-101916
Heparan SulfateLinear Polysaccharide -
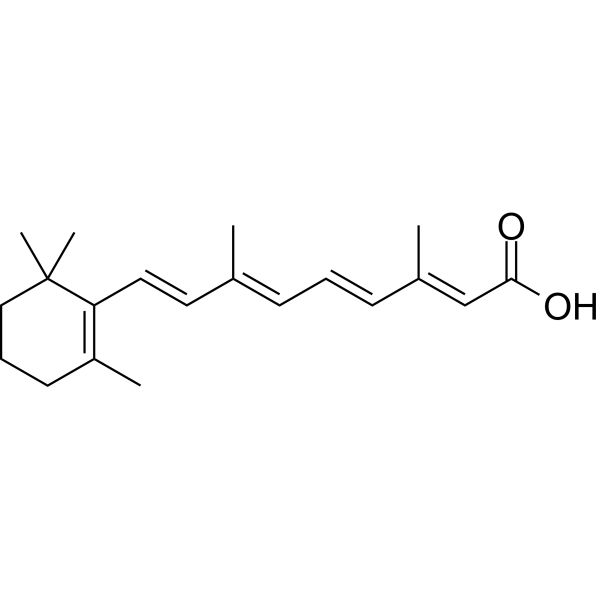
HY-14649
Retinoic acidRAR Agonist -
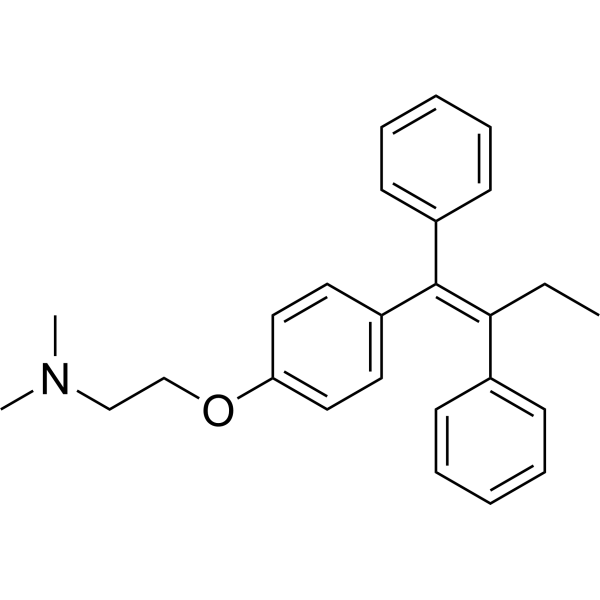
HY-13757A
TamoxifenEstrogen Receptor Modulator -
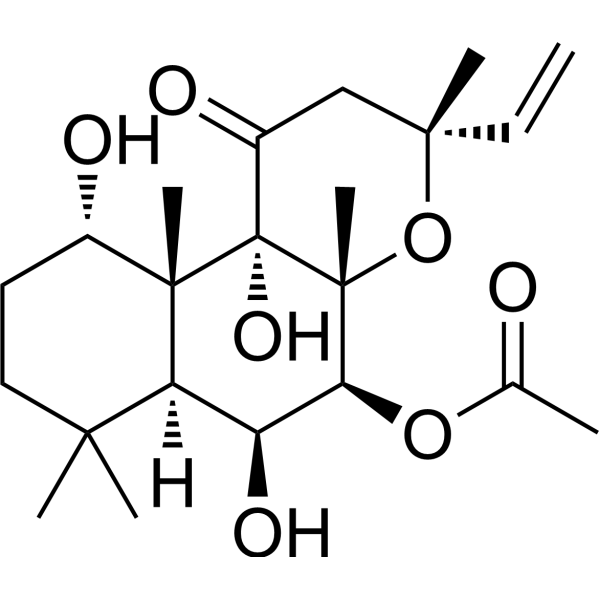
HY-15371
ForskolinAdenylate Cyclase Activator -

HY-107910
Hyaluronidase, Bovine testesHyaluronic Acid Degrader -

HY-B0633C
Hyaluronic acid (Mw:1000-2000Da)Hyaluronic acid -

HY-B0633E
Hyaluronic acid, low endotoxinBiopolymer -
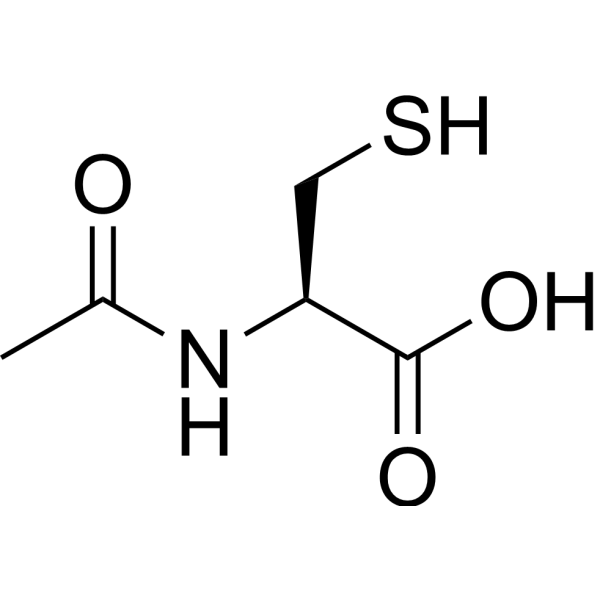
HY-B0215
AcetylcysteineMucolytic Agent -
HY-10219
RapamycinmTOR Inhibitor
Publications Citing Use of MedChemExpress (MCE) Hyaluronic acid
More- Science. 2026 Feb 5;391(6785):eadz4075. [Abstract]
- Immunity. 2021 May 11;54(5):962-975.e8. [Abstract]
- Adv Funct Mater. 2026 May 28;36(50):e76099.
- Nat Commun. 2026 Apr 13;17(1):5061. [Abstract]
- Nat Commun. 2025 Jul 1;16(1):5675. [Abstract]
- ACS Nano. 2023 Dec 12;17(23):23535-23544. [Abstract]
- J Immunother Cancer. 2026 Mar 9;14(3):e014179. [Abstract]
- Adv Healthc Mater. 2026 Feb 21:e05684. [Abstract]
- Nano Today. 2024 Oct.
- Cell Death Discov. 2022 Apr 11;8(1):193. [Abstract]
- Oncogene. 2023 Oct;42(44):3221-3235. [Abstract]
- Chem Mater. 2026 Jun 15.
- Front Bioeng Biotechnol. 2022 Jul 1;10:918368. [Abstract]
- Int Immunopharmacol. 2026 Jan 1;168(Pt 1):115747. [Abstract]
- Microbiol Spectr. 2021 Dec 22;9(3):e0064621. [Abstract]
- J Biol Chem. 2021 Jul;297(1):100806. [Abstract]
- Regen Ther. 2026 Mar 7:32:101098. [Abstract]
- Drug Dev Ind Pharm. 2023 Feb;49(2):189-206. [Abstract]
- J Chem Neuroanat. 2021 Nov:117:101996. [Abstract]
- Research Square Preprint. 2024 Feb 6.
- Biomed Pharmacother. 2024 Jan:170:116100. [Abstract]
 Customer Validation & Images

-
IF
-
Histological Imaging/Staining
-
IHC
-
Apoptosis Analysis
-
In Vivo Efficacy Study
All Endogenous Metabolite Isoforms
More

Biological Activity
Description
IC50 & Target
|
Human Endogenous Metabolite |
In Vitro
Hyaluronic acid (HA) is widely used in aesthetic medicine due to its binding ability with a large number of water molecules. It improves tissue hydration and their resistance to mechanical damage. HA plays an important role in wound healing, ovulation, fertilization, signal transduction, and tumor physiology. HA is used in joint diseases such as osteoarthritis or rheumatoid arthritis. HA of a high molecular mass reduces the chemotaxis and migration of inflammatory cells which acts as a good barrier to the inflammatory process and protects against the effects of free radicals. HA is used in ophthalmology due to its lubricating properties for the corneal endothelium, and improves tissue hydration and cellular resistance to mechanical damage in aesthetic dermatology, and has marginal adverse effects. Several trials indicate its role in tumor markers, liver diseases, and in pharmaceuticals[1]. Hyaluronan plays an important role in cancer growth and metastasis. HA and HA fragment-tumor cell interaction could activate the downstream signaling pathways, promoting cell proliferation, adhesion, migration and invasion, and inducing angiogenesis, lymphangiogenesis, epithelial-mesenchymal transition, stem cell-like property, and chemoradioresistance in digestive cancers[2].
MedChemExpress (MCE) has not independently confirmed the accuracy of these methods. They are for reference only. Further protocols information, click here.
In Vivo
MedChemExpress (MCE) has not independently confirmed the accuracy of these methods. They are for reference only.


Chemical Information
-
CAS No. 9004-61-9
-
Appearance Solid
-
Molecular Weight 379.32 (monomer)
-
Formula (C14H21NO11)n
-
Color White to off-white
-
SMILES
CO[C@H]1[C@H](O)[C@@H](CO)O[C@@H](O[C@H]2[C@@H]([C@H]([C@@H](O[C@H]2C(O)=O)OC)O)O)[C@@H]1NC(C)=O.[n]
-
Synonyms
Hyaluronan; Hyaluronate
-
Structure Classification
-
Shipping
Room temperature in continental US; may vary elsewhere.
-
Storage
4°C, protect from light
* In solvent : -80°C, 6 months; -20°C, 1 month (protect from light)


Publications (21)
-
Journal Impact Factor
-
Most Recent
-
Science
2026 Feb 5;391(6785):eadz4075. PMID: 41643022 -
Immunity
Golgi apparatus-synthesized sulfated glycosaminoglycans mediate polymerization and activation of the cGAMP sensor STING. [Abstract]2021 May 11;54(5):962-975.e8. PMID: 33857420 -
-
Nat Commun
Intraovarian injection of securinine stimulates the growth of small ovarian follicles by reducing stromal suppression. [Abstract]2026 Apr 13;17(1):5061. PMID: 41974717 -
Nat Commun
2025 Jul 1;16(1):5675. PMID: 40593710 -
ACS Nano
A Side-Effect-Free Interventional Therapy for Precisely Eliminating Unresectable Cancer Pain. [Abstract]2023 Dec 12;17(23):23535-23544. PMID: 38084419 -
J Immunother Cancer
Hyaluronic acid-CD44 signaling defines therapeutic resistance and immunosuppressive microenvironment in peritoneal metastasis of gastric cancer. [Abstract]2026 Mar 9;14(3):e014179. PMID: 41802813 -
Adv Healthc Mater
An Injectable Liposome-Hydrogel Composite for Targeted Delivery of a Non-Lactylated Peptide to Rebalance Bone Metabolism in Hyperlipidemia. [Abstract]2026 Feb 21:e05684. PMID: 41721628 -
-
Cell Death Discov
Suppression of the hyaluronic acid pathway induces M1 macrophages polarization via STAT1 in glioblastoma. [Abstract]2022 Apr 11;8(1):193. PMID: 35410993 -
Oncogene
Mesenchymal stromal cells confer breast cancer doxorubicin resistance by producing hyaluronan. [Abstract]2023 Oct;42(44):3221-3235. PMID: 37704784
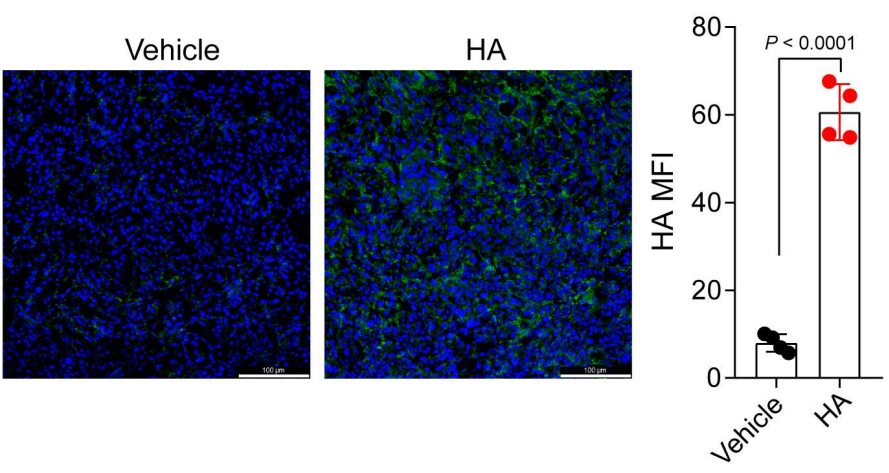
Hyaluronic acid purchased from MedChemExpress. Usage Cited in: Oncogene. 2023 Oct;42(44):3221-3235. [Abstract]
4T1 cells mixed with exogenous Hyaluronic acid (HA, 500 μg) were subcutaneously inoculated into BALB/c mice, the mice were sacrificed on the eighth day after tumor graft. Representative immunofluorescent images of HA (green) and Hoechst33342 (blue) in tumors (left, scale bar, 100 μm), and statistic result of the MFI of HA (right), n = 4. P values were calculated by two-tailed unpaired t tests. E-F, The MSCs supernatant react with increasing dose of DOX. The results showed that exogenous HA was effectively converted into increased intratumoral HA content when assayed on the eighth day after tumor implantation.
-
-
Front Bioeng Biotechnol
Hyaluronic Acid-Modified Nanoplatforms as a Vector for Targeted Delivery of Autophagy-Related Gene to the Endometriotic Lesions in Mice. [Abstract]2022 Jul 1;10:918368. PMID: 35845410 -
Int Immunopharmacol
Microbial metabolite tigloside alleviates osteoarthritis by repolarizing macrophages from M1 to M2 phenotype through Trafd1 destabilization and Trafd1-mediated NF-κB/STAT6 signaling pathways. [Abstract]2026 Jan 1;168(Pt 1):115747. PMID: 41192114 -
Microbiol Spectr
2021 Dec 22;9(3):e0064621. PMID: 34730435 -
J Biol Chem
2021 Jul;297(1):100806. PMID: 34022223 -
Regen Ther
Therapeutic effects of Tetramethylpyrazine on Cartilage in Rat Model of Post-traumatic Osteoarthritis. [Abstract]2026 Mar 7:32:101098. PMID: 41852452 -
Drug Dev Ind Pharm
Multiple stimulus-response berberine plus baicalin micelles with particle size-charge-release triple variable properties for breast cancer therapy. [Abstract]2023 Feb;49(2):189-206. PMID: 36971392 -
J Chem Neuroanat
Caffeine abrogates oxidative stress imbalance: Its implication on lateral geniculate nucleus and visual cortex following hyaluronic acid exposure. [Abstract]2021 Nov:117:101996. PMID: 34214592
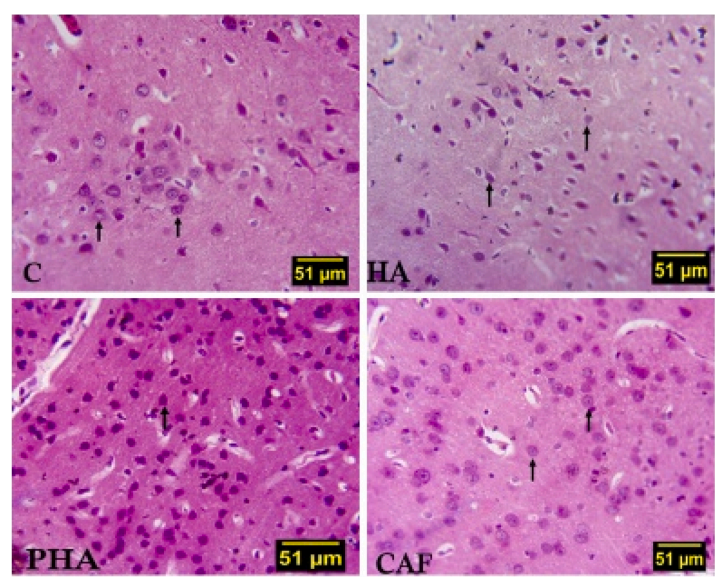
Hyaluronic acid purchased from MedChemExpress. Usage Cited in: J Chem Neuroanat. 2021 Nov:117:101996. [Abstract]
Photomicrograph of the visual cortex in section following hyaluronic acid injection and caffeine treatment. C (control group) revealed a normal neuronal cells distribution pattern with distinct nuclei; HA (Hyaluronic acid group; 25 μL/kg; single injection at the unilateral corneoscleral limbus) revealed pyknotic and scanty distribution of neuronal cells. PHA (intervention group) revealed histological alteration when compared to control group. CAF (caffeine group; 20 mg/kg; i.p.; once daily for 7 days) revealed scantily distribution of normal neuronal cells. Stained with H&E, (Scale bar = 51 μm).
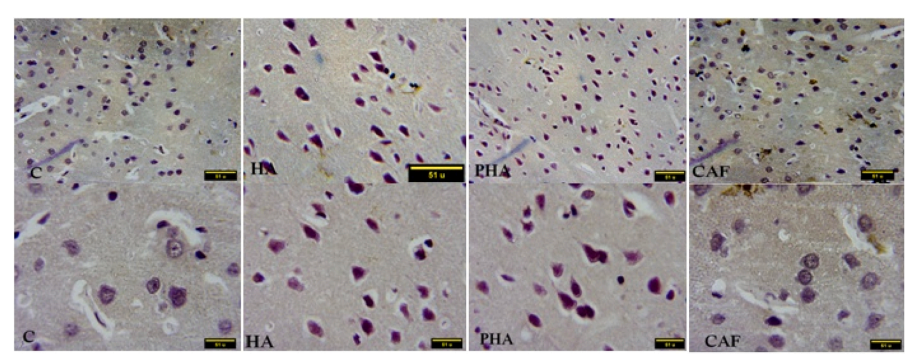
Hyaluronic acid purchased from MedChemExpress. Usage Cited in: J Chem Neuroanat. 2021 Nov:117:101996. [Abstract]
Photomicrograph showing TNF-α in a rat glaucomatous visual cortex. C represents the control group; HA (Hyaluronic acid; 25 μL/kg; single injection at the unilateral corneoscleral limbus) represent the hyaluronic acid group; PHA represents the intervention group; CAF represent the caffeine group. The expressions of TNF-α, and the damaged cells were characterized by a deep brown precipitates, round and shrunken morphology. (Scale bar = 51 μm).
Hyaluronic acid purchased from MedChemExpress. Usage Cited in: J Chem Neuroanat. 2021 Nov:117:101996. [Abstract]
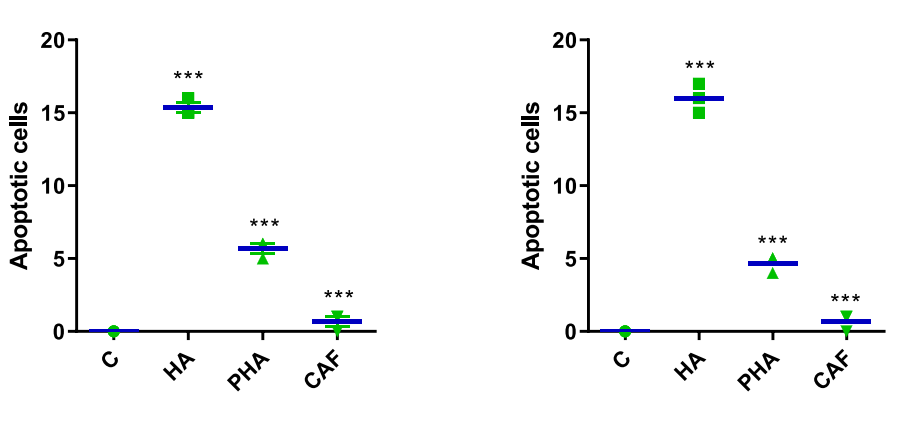
Effect of Caffeine on the tumour necrosis factor in the LGB and visual cortex of HA (25 μL/kg; single injection at the unilateral corneoscleral limbus)-induced rat. A): Tunel assay immunoreactivity in the primary visual cortex. B): Tunel assay immunoreactivity in the Lateral geniculate nucleus (LGN). Data represented as mean ± S.E.M. (n = 4). C = Control, HA= Hyaluronic acid, PHA = Post treatment group, CAF = Caffeine.
Hyaluronic acid purchased from MedChemExpress. Usage Cited in: J Chem Neuroanat. 2021 Nov:117:101996. [Abstract]
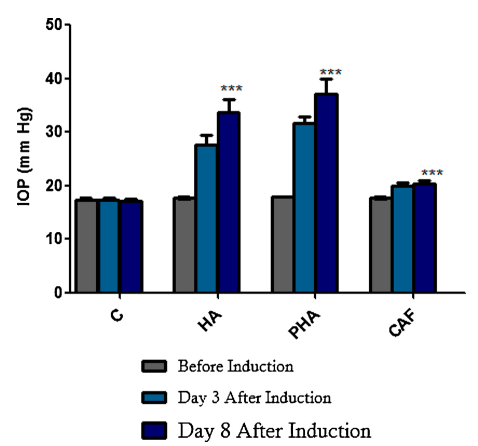
Tonopen measurements of IOP in rats with hyaluronic acid injection and caffeine treatment. The elevated IOP was observed in rats injected with hyaluronic acid compared to the control and caffeine group. The distinction between the control, CAF and HA (Hyaluronic acid group; 25 μL/kg; single injection at the unilateral corneoscleral limbus) group was statistically significant after 8 days of HA injection. Control (C); hyaluronic acid (HA); Post hyaluronic acid (PHA); Caffeine (CAF); Intraocular pressure (IOP) *P < 0.05 (P value = 0.0001).
-
-
Biomed Pharmacother
Hyaluronan delays human amniotic epithelial stem cell senescence by regulating CD44 isoform switch to activate AKT/mTOR signals. [Abstract]2024 Jan:170:116100. PMID: 38159379


Solvent & Solubility
In Vitro:
H2O : 8.33 mg/mL (Need ultrasonic)
DMSO : < 1 mg/mL (insoluble or slightly soluble)
In Vivo:
For the following dissolution methods, please prepare the working solution directly:
It is recommended to prepare fresh solutions and use them promptly within a short period of time.
The percentages shown for the solvents indicate their volumetric ratio in the final prepared solution. If precipitation or phase separation occurs during preparation, heat and/or sonication can be used to aid dissolution.
Add each solvent one by one: PBS
Solubility: 9.09 mg/mL; Clear solution; Need ultrasonic and warming and heat to 60°C

Protocols
-
Collagen: Sirius Red Staining
Sirius Red or picrosirius red staining is a histochemical method for visualizing collagen-rich extracellular matrix in tissue sections, and collagen fibers are detected as red-stained structures under bright-field microscopy with enhanced birefringence under polarized light. Picrosirius red is useful for assessing total collagen organization, distribution, and fibrosis burden, but polarized color should not be interpreted as a definitive collagen type I versus type III readout because color is affected by fiber orientation, thickness, and packing.
-
Human pluripotent stem cell endothelial-cell differentiation
Human pluripotent stem cell endothelial differentiation is based on stepwise developmental patterning: early activation of WNT/GSK3β inhibition promotes mesodermal or vascular progenitor entry, followed by endothelial specification using VEGF-related signaling, BMP4, FGF2, Notch modulation, or cAMP depending on the published protocol. Endothelial differentiation is read out by acquisition of CD31, CD34, VE-cadherin/CD144, KDR/VEGFR2, vWF, Tie2, NOS3, acetylated LDL uptake, tube/network formation, barrier function, and in vivo vessel-forming capacity where tested.
-
Cell migration
Cell migration is a method that plays an important role in wound healing, cell differentiation, embryonic development, etc.
-
Somatic Cell Culture
A method of simulating the in vivo environment in vitro to maintain the cell growth, differentation and main functions.
-
ECM-Embedded Organoid (Matrigel/Dome) Culture
ECM-embedded organoid dome culture embeds epithelial stem cells, crypts, organoid fragments, or tumor-derived epithelial cells in a basement-membrane-like hydrogel such as Matrigel, allowing 3D growth, self-organization, lumen formation, budding or cystic morphogenesis, and lineage maintenance under defined niche-factor-containing medium. The primary readouts are organoid establishment efficiency, growth, morphology, passaging capacity, lineage-marker expression, and, when fluorescently labeled lines are used, microscopy- or flow-cytometry-based quantification of population behavior in 3D culture.
-
Breast Cancer Modeling
Breast cancer is a heterogeneous cancer, and it has been distinguished into four subtypes: luminal A, luminal B, HER2-positive and basal-like. Molecular mutations, epigenetic alterations, hormone exposure and immune microenvironment are related to the progression of breast cancer.
-
Endothelial Tube Formation Assay
Endothelial tube formation assay evaluates the ability of endothelial cells to attach, migrate, align, and organize into capillary-like networks when cultured on gelled basement membrane extract or Matrigel; the readout is the morphology and quantity of tube-like networks, which reflects an in vitro endothelial morphogenesis step related to angiogenesis. Basement membrane extract/Matrigel provides laminin-rich extracellular matrix cues that support endothelial differentiation into capillary-like structures, but it can contain biologically active growth factors, so growth-factor-reduced matrix is preferred when testing defined angiogenic stimulators or inhibitors.
-
Mitochondrial membrane-potential and mitochondrial mass staining
Mitochondrial membrane potential staining measures the electrochemical polarization across the mitochondrial inner membrane in live cells using lipophilic cationic fluorescent probes; early rhodamine-based work showed that selective mitochondrial dye accumulation is lost when the mitochondrial transmembrane potential is dissipated. JC-1 reports mitochondrial polarization by shifting from green monomer fluorescence to red J-aggregate fluorescence as dye concentration increases within energized mitochondria; therefore, the red/green fluorescence ratio is used as a relative readout of mitochondrial membrane potential. TMRE or TMRM staining provides a single-channel relative readout because these cationic rhodamine esters accumulate in polarized mitochondria, and lower fluorescence indicates reduced mitochondrial polarization when acquisition and dye-loading conditions are controlled. Mitochondrial mass staining is commonly performed with MitoTracker Green FM or related MitoTracker dyes as
-
Organotypic 3D Invasion Assay
The organotypic 3D invasion assay measures carcinoma-cell invasion into a fibroblast-remodeled extracellular matrix, usually collagen I with or without basement-membrane matrix, under an air-liquid or grid-supported culture condition; the readout is invasion depth, invaded area, or an invasion index from histological or fluorescence images. This assay models stromal regulation of invasion because fibroblasts or CAFs remodel matrix, generate tracks, and can lead collective carcinoma-cell invasion; the resulting cancer-cell penetration into the gel reflects tumor-stroma-ECM interactions rather than migration on a rigid 2D substrate.
-
Matrigel/ECM Transwell Invasion Assay
The Matrigel/ECM Transwell invasion assay measures the ability of cells to move toward a chemoattractant while crossing an extracellular-matrix barrier placed on a porous membrane; therefore, the readout reflects both chemotactic motility and matrix invasion rather than migration alone. Matrigel is a basement-membrane-rich matrix derived from Engelbreth-Holm-Swarm mouse sarcoma and has been used as a reconstituted basement membrane barrier in chemoinvasion assays. The assay readout is generated by quantifying cells that reach the underside of the insert membrane or lower compartment after incubation, commonly by staining and counting invaded cells or by fluorescence-based quantification.
-
Cell invasion
Cell invasion is the ability of cells to migrate from one area to another via the extracellular matrix. Cell invasion is the response of normal and cancer cells to chemical and mechanical stimuli. Before migrating to a new region, the extracellular matrix is degraded by proteases within the cell. Cell invasion often occurs during wound repair, vascularization and inflammation, abnormal tissue invasion, and tumor cell metastasis.
-
MTT Cell Proliferation Assay
The MTT assay is a colorimetric endpoint assay for estimating viable cell number, cell growth, cytotoxicity, or cell activation in cultured mammalian cells. Living cells reduce the yellow tetrazolium salt MTT into purple/blue formazan, while dead cells do not generate the same signal; the resulting color can be quantified with a multiwell spectrophotometer. MTT reduction is commonly interpreted as a readout of metabolic activity that often correlates with viable cell number, but it should not be treated as a direct cell-counting method unless the assay is optimized for the cell type and experimental condition. Studies show that MTT reduction can involve mitochondrial and non-mitochondrial reducing systems, and formazan may accumulate in intracellular lipid droplets rather than simply marking mitochondria.
-
Cell-Exclusion Zone Migration Assay
The Cell-Exclusion Zone (CEZ) migration assay is an in vitro 2D cell migration method in which a defined cell-free area is created using removable physical barriers such as silicone stoppers, allowing cells to be seeded around the barrier and subsequently migrate into the cleared zone after barrier removal. This approach enables quantification of collective cell migration by monitoring repopulation of the initially cell-free region over time using microscopy-based imaging. Compared with scratch-based wound healing assays, barrier-based exclusion methods are designed to avoid mechanical damage to the extracellular matrix and reduce injury-induced effects on boundary cells, thereby improving interpretability of migration behavior in vitro. The assay readout is typically the progressive reduction in the cell-free area or the number of cells invading the exclusion zone, reflecting coordinated cell motility relevant to physiological processes such as wound healing, epithelial repair, and ca
-
Endothelial Cell Migration/Angiogenic Sprouting Assay
Endothelial cell migration and angiogenic sprouting assays are in vitro (and partially ex vivo-adapted) functional models that quantify the ability of endothelial cells to undergo coordinated migration, extracellular matrix invasion, and multicellular organization into capillary-like sprouts in response to pro-angiogenic stimuli such as VEGF, bFGF, or conditioned microenvironments. These assays are used to model early angiogenic events including tip-cell formation, directional migration, and lumen-like sprout extension, which collectively reflect angiogenic activation and vascular morphogenesis processes observed in vivo.
-
3D Collagen/Hydrogel Matrix Invasion Assay
The 3D collagen/hydrogel matrix invasion assay is based on embedding cells within or on top of a three-dimensional fibrillar extracellular matrix (typically type I collagen or collagen-rich hydrogels) to model cell migration through a physiologically relevant physical barrier. In this system, invasive behavior is quantified by measuring the ability of cells to degrade, remodel, and migrate through the 3D matrix architecture, which better reflects in vivo tissue invasion compared to 2D migration assays. Collagen-based 3D matrices provide structural cues such as fiber alignment and porosity that influence cell motility and integrin-mediated adhesion, enabling observation of collective or single-cell invasion modes depending on matrix density and organization.
-
Spheroid/Tumor Organoid Invasion Assay
The spheroid/tumor organoid invasion assay measures outward movement of cancer cells from a compact 3D aggregate into an extracellular matrix, usually collagen I, basement membrane matrix, or mixed collagen-Matrigel hydrogels; the readout is generated by bright-field, fluorescence, confocal, or time-lapse imaging of cell egress, invasion area, invasion distance, dispersion, protrusion formation, basement-membrane perforation, or cell trajectories. The assay reflects cell-cell cohesion, cell-matrix adhesion, matrix remodeling, protease-dependent invasion, contractility, and invasion behavior in a 3D microenvironment rather than migration on a flat 2D surface.
-
Ex Vivo Tissue Slice/Explant Invasion Assay
Ex vivo organotypic tissue slice cultures are based on maintaining thin, viable tissue sections at an air-liquid interface to preserve native cytoarchitecture and local cell-matrix interactions, enabling observation of cell behavior such as migration and tissue infiltration within a physiologically relevant 3D microenvironment. The method relies on maintaining tissue viability on porous membrane supports, allowing diffusion of nutrients and oxygen while preserving structural integrity for extended culture periods, which makes it suitable for studying dynamic cellular processes in intact tissue contexts such as cell movement and tissue remodeling. .
-
Patient-Derived Organoid Invasion Assay
Patient-derived organoid (PDO) invasion assays are based on the ability of epithelial tumor organoids to self-organize in three-dimensional extracellular matrix (ECM) hydrogels (commonly Matrigel) and to recapitulate key aspects of in vivo tissue architecture, including polarity, proliferation, and invasive outgrowth when exposed to permissive microenvironmental cues. In this system, invasion is operationally defined as the emergence of multicellular protrusions, collective budding, or single-cell dissemination from the organoid core into the surrounding ECM, reflecting epithelial-mesenchymal plasticity and matrix remodeling capacity. Organoid morphology and invasive behavior are typically monitored using brightfield or confocal microscopy over time, enabling quantitative assessment of invasion area, protrusion number, and structural disruption of the organoid spheroid architecture.
-
Mitochondrial membrane-potential fluorescent assay
Mitochondrial membrane potential fluorescent assays estimate ΔΨm in living cells using lipophilic cationic dyes such as TMRM, TMRE, rhodamine 123, and JC-1, which accumulate in mitochondria according to membrane polarization; loss of signal after FCCP or CCCP treatment is interpreted as mitochondrial depolarization. TMRM/TMRE and rhodamine 123 are commonly used for semi-quantitative live-cell microscopy or flow cytometry, while JC-1 can report a shift from red aggregate fluorescence to green monomer fluorescence during depolarization; interpretation requires controls because dye concentration, quenching mode, cell type, dye efflux, and mitochondrial mass can affect fluorescence independently of ΔΨm.
-
Vascular/Branching Fractal Analysis
Vascular/branching fractal analysis quantifies the geometric complexity of vessel trees or vascular networks from segmented 2D images, commonly by converting vessels into binary and/or skeletonized maps and estimating fractal dimension using box-counting or related approaches. Fractal dimension is interpreted as an image-derived readout of vascular branching complexity, space filling, or density, and has been applied to retinal photographs, fluorescein angiography, OCT angiography, capillary perfusion maps, and in vitro Matrigel angiogenesis networks. The assay readout is generated from vessel-positive pixels after image preprocessing, vessel segmentation, binarization, and optional skeletonization; reported outputs include fractal dimension, vessel density, branchpoint density, endpoint density, vessel length density, tortuosity, and generation-based branching metrics when VESGEN-style analysis is used. The biological interpretation is limited to quantitative vascular patterning and s
-
BrdU Incorporation Assay
Bromodeoxyuridine (BrdU) incorporation assay is based on the principle that BrdU, a thymidine analog, is incorporated into newly synthesized DNA during the S phase of the cell cycle, thereby serving as a marker of DNA replication and cellular proliferation. Incorporated BrdU can be detected using anti-BrdU antibodies following DNA denaturation, enabling visualization or quantification of proliferating cells through immunochemical detection methods such as immunofluorescence or immunohistochemistry.
-
CFSE Dye Dilution Proliferation Assay
The CFSE (carboxyfluorescein diacetate succinimidyl ester) dye dilution proliferation assay is based on the covalent labeling of intracellular proteins by a cell-permeant fluorescent dye that becomes fluorescent upon intracellular ester cleavage and then is stably retained within cells. As labeled cells divide, the dye is partitioned equally between daughter cells, resulting in a stepwise halving of fluorescence intensity that can be quantified by flow cytometry to determine the number of cell divisions undergone by each cell population. This fluorescence dilution approach enables quantitative tracking of lymphocyte proliferation at the single-cell level over multiple rounds of division. CFSE-based proliferation analysis has been widely applied to measure antigen-driven lymphocyte expansion in vitro, where discrete fluorescence peaks correspond to successive cell divisions and allow reconstruction of proliferative history within heterogeneous populations.
-
Dye-dilution cell tracking and proliferation staining
Dye-dilution cell tracking assays quantify cell proliferation by covalently labeling intracellular proteins with a stable fluorescent dye that is equally partitioned between daughter cells during mitosis, resulting in stepwise halving of fluorescence intensity with each cell division as measured by flow cytometry histograms. Carboxyfluorescein diacetate succinimidyl ester (CFSE) is a prototypical dye that diffuses into cells, is enzymatically converted into a fluorescent compound, and then covalently binds intracellular amine groups, producing long-lived fluorescence suitable for tracking multiple rounds of division in vitro and in vivo. Successive generations of dividing cells form discrete peaks of decreasing fluorescence intensity, enabling estimation of proliferation history, precursor frequency, and division index within heterogeneous populations. Alternative dyes such as CellTrace Violet (CTV) and far-red membrane dyes (e. g. , PKH26) follow the same dilution principle but differ
-
CCK-8/WST-8 Cell Proliferation Assay
The CCK-8/WST-8 assay is based on the reduction of the water-soluble tetrazolium salt WST-8 to a water-soluble formazan product by cellular dehydrogenases in metabolically active cells, where the generated formazan amount is proportional to the number of living cells and is quantified by measuring absorbance in the visible range, providing a colorimetric readout for cell viability and proliferation assessment. This class of tetrazolium-based assays improves upon earlier MTT-based systems by producing a water-soluble formazan, eliminating the need for organic solubilization steps and enabling direct spectrophotometric measurement in culture medium.
-
Protocol for Cell Cycle
Cell-cycle analysis by flow cytometry measures DNA content in single cells to estimate the fraction of cells in G0/G1, S, and G2/M phases. Propidium iodide intercalates into DNA, and after RNA removal with RNase, fluorescence intensity reflects cellular DNA content: 2N cells are assigned to G0/G1, cells between 2N and 4N to S phase, and 4N cells to G2/M. DNA-content analysis alone cannot reliably separate G0 from G1 or G2 from M. Ki-67 can distinguish quiescent G0 cells from cycling cells, EdU or BrdU incorporation marks active DNA synthesis in S phase, and phospho-histone H3 staining identifies mitotic cells within the 4N population.
-
Cell Counting-Based Growth Curve Assay
Cell counting-based growth curve assays quantify cell proliferation by directly measuring changes in viable cell number over time using manual or automated counting methods such as hemocytometer-based counting or instrument-assisted cell enumeration, enabling construction of growth curves that reflect population expansion dynamics in response to culture conditions. A widely used approach is trypan blue exclusion with hemocytometer counting, where membrane-compromised (non-viable) cells take up the dye, allowing discrimination between viable and non-viable cells while simultaneously enabling total cell number quantification. Repeated sampling across time points allows estimation of proliferation rate, growth phases, and comparative growth kinetics between experimental conditions.
-
Colony Formation (Clonogenic) Assay
The clonogenic (colony formation) assay measures the ability of a single cell to retain reproductive viability and form a macroscopic colony, typically defined as a cluster derived from one progenitor cell after a defined growth period. This assay is widely used to evaluate cell survival after exposure to ionizing radiation or cytotoxic treatments and is considered a standard method in radiation biology for generating dose-response relationships of reproductive cell death. Colony formation reflects long-term proliferative capacity rather than short-term metabolic activity, and survival is quantified by comparing treated versus untreated conditions based on colony number and derived survival fractions.
-
3D Tumor Spheroid Invasion Assay
3D tumor spheroid invasion assay measures outward tumor-cell movement from a compact multicellular spheroid into a surrounding extracellular matrix, producing image-based readouts such as invasion area, invasion distance, cell dispersion, or time-resolved cell movement. The method models tumor-cell interaction with matrix components in three dimensions and is used to study invasive phenotypes in cancer models including glioblastoma, squamous cell carcinoma, breast cancer, prostate cancer, ovarian cancer, and other solid tumor systems.
-
Matrigel Transwell/Boyden Chamber Invasion Assay
Matrigel Transwell/Boyden chamber invasion assay measures the ability of cells to degrade or traverse an extracellular matrix-coated porous membrane and move from an upper chamber toward a chemoattractant in a lower chamber. Invasion is distinguished from migration by coating the membrane with Matrigel or basement membrane matrix; uncoated inserts measure migration, while coated inserts require cells to cross an ECM barrier before reaching the underside of the membrane.
-
Cell Viability Determination by MTT Colorimetric Assay
The following protocol uses the MTT colorimetric assay as a classic literature-established method for assessing cell viability/metabolic activity in cultured mammalian cells. MTT[3-(4,5-dimethylthiazol-2-yl)-2,5-diphenyltetrazolium bromide] is reduced by metabolically active cells to a colored formazan product; the amount of formazan is quantified spectrophotometrically and provides an indirect measure of metabolically active viable cells. Importantly, MTT reduction reflects cellular oxidoreductase/metabolic activity rather than an absolute direct count of living cells, so changes in cellular metabolism can alter the signal independently of cell number.
-
Fibrosis/Collagen Morphometry
Fibrosis and collagen morphometry is based on the quantitative visualization of fibrillar collagen deposition in tissue sections using histochemical stains such as Sirius Red (Picrosirius Red) or Masson's trichrome, followed by image-based or polarization-enhanced analysis to estimate collagen proportional area as a surrogate of extracellular matrix accumulation during fibrotic remodeling. Sirius Red combined with polarized light microscopy enhances detection of collagen fibers due to birefringence properties, enabling more specific visualization of collagen type I and III fibrils compared to conventional bright-field histology, while whole-section or region-restricted digital morphometry reduces field-selection bias in fibrosis assessment. Alternative quantitative approaches include second harmonic generation (SHG) and two-photon excited fluorescence microscopy, which enable label-free detection of fibrillar collagen and have been validated against histological staining and biochemica
-
Invadopodia/Fluorescent Gelatin Degradation Assay
Invadopodia/fluorescent gelatin degradation assay detects proteolytic extracellular matrix degradation by cancer-cell invadopodia, which are actin-rich protrusive structures associated with matrix remodeling, invasion, and metastasis. The readout is generated by culturing cells on fluorescent gelatin and measuring dark degraded areas where fluorescent substrate has been locally removed, often together with immunofluorescent detection of invadopodia markers such as F-actin, cortactin, and TKS5.
-
EdU Incorporation Assay (Click Chemistry-Based DNA Synthesis Measurement)
The EdU incorporation assay measures DNA synthesis by adding the thymidine analog 5-ethynyl-2′-deoxyuridine to cells or tissues, where it is incorporated into newly synthesized DNA during S phase. Incorporated EdU is detected by copper-catalyzed azide-alkyne cycloaddition, in which a fluorescent azide covalently reacts with the ethynyl group on EdU, allowing S-phase cells to be detected by fluorescence microscopy, flow cytometry, or high-content imaging. EdU detection does not require DNA denaturation or anti-BrdU antibody access, which preserves sample structure and improves compatibility with immunostaining and multiparameter cytometry compared with BrdU-based detection. EdU can be cytotoxic in a cell-type- and exposure-dependent manner, so pulse duration, concentration, and continuous-labeling designs should be validated for each cell type.
-
Ki-67 Immunostaining Proliferation Assay
Ki-67 immunostaining measures the growth fraction of a cell population by detecting Ki-67, a nuclear antigen present in proliferating cells and absent in quiescent G0 cells. The readout is the percentage of Ki-67-positive nuclei among total counted cells, commonly called the Ki-67 labeling index or proliferation index.
-
PCNA Immunodetection Proliferation Assay
PCNA immunodetection measures proliferative activity by detecting proliferating cell nuclear antigen, a nuclear protein associated with DNA polymerase δ function and DNA replication. The assay readout is the proportion of PCNA-positive nuclei among total counted cells, but PCNA labeling is not identical to BrdU labeling because PCNA can mark late G1/early S-associated replication competence and may persist beyond active DNA synthesis depending on fixation and extraction conditions.
-
Protocol for Cell Counting and Cell Density Analysis
Cell counting and cell-density analysis estimate the number of cells in a known volume or field area. Manual hemocytometer counting uses a chamber of defined geometry to convert counted cells into cells/mL, while automated counters and image-analysis workflows detect cell objects from optical, brightfield, fluorescence, impedance, or digital-image features. Trypan blue viability counting is based on dye exclusion: viable cells with intact membranes exclude dye, while non-viable cells with compromised membranes stain blue. The readout is total cell density, viable-cell density, dead-cell density, and percent viability. Cell density can also be estimated from microscopy images by counting objects per image area, from flow cytometry using calibrated volume or reference particles, or from in situ microscopy in bioreactors after calibration against reference methods such as hemocytometer or flow cytometry.


Purity & Documentation
-
Data Sheet (278 KB)
-
SDS (394 KB)
- English - EN (394 KB)
- Français - FR (394 KB)
- Deutsch - DE (394 KB)
- Norwegian - NO (394 KB)
- Español - ES (394 KB)
- Swedish - SV (394 KB)
- Italian - IT (394 KB)
- Korean - KR (394 KB)
- Portuguese - PT (394 KB)
-
Handling Instructions (2659 KB)
References
[1]. Salwowska NM, et al. Physiochemical properties and application of hyaluronic acid: a systematic review. J Cosmet Dermatol. 2016 Dec;15(4):520-526. [Content Brief]
[2]. Wu RL, et al. Hyaluronic acid in digestive cancers. J Cancer Res Clin Oncol. 2017 Jan;143(1):1-16. [Content Brief]
[3]. Kogan G, et al. Hyaluronic acid: a natural biopolymer with a broad range of biomedical and industrial applications. Biotechnol Lett. 2007 Jan;29(1):17-25. [Content Brief]
[4]. Coradini, D., et al., (1999). Hyaluronic acid as drug delivery for sodium butyrate: improvement of the anti-proliferative activity on a breast-cancer cell line. International journal of cancer, 81(3), 411–416. [Content Brief]
[5]. Goa, K. L., & Benfield, P. (1994). Hyaluronic acid. A review of its pharmacology and use as a surgical aid in ophthalmology, and its therapeutic potential in joint disease and wound healing. Drugs, 47(3), 536–566. [Content Brief]

Calculators
Concentration (start) × Volume (start) = Concentration (final) × Volume (final)


Hyaluronic acid Related Classifications
HY-B0633A Related Classifications
 Powered by Bioz