



Chamaejasmine

Based on 1 Customer Validation
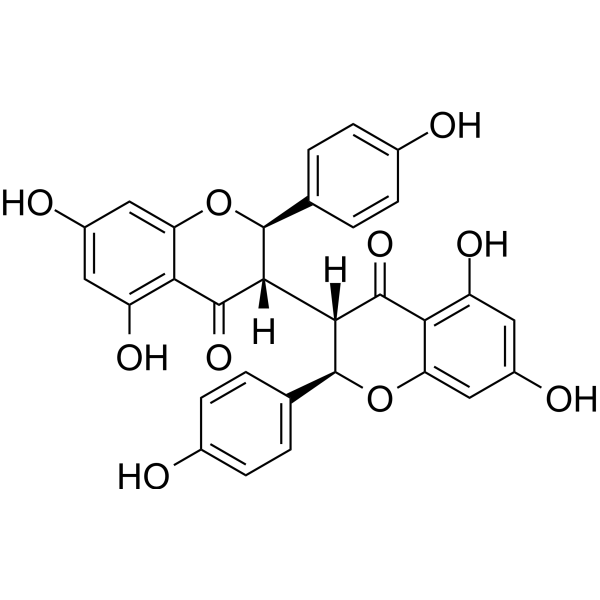
Chamaejasmine (Chamaejasmin) is a natural biflavonoid found in the roots of Stellera chamaejasme, exhibiting antitumor activity. Chamaejasmine inhibits Bcl-2, upregulates Bax, and induces cleavage of caspase-9/-3 and PARP. Chamaejasmine induces ROS production, Δψm loss, cytochrome c release, G2/M arrest, apoptosis, and autophagy. Chamaejasmine induces apoptosis and autophagy through activation of AMPK and inhibition of mTOR, and inhibits microtubule depolymerization by binding to β-tubulin. Chamaejasmine inhibits IL-4, IgE, β-hexosaminidase, and mast cell infiltration, and improves skin barrier function in AD models. Chamaejasmine exhibits cytotoxicity against various cancer cells. Chamaejasmine can be used in research related to various cancers such as lung adenocarcinoma and osteosarcoma, as well as atopic dermatitis.
연구목적의 판매만을 진행합니다. 환자를 대상으로 한 판매는 하지 않습니다.
- Purity : 98.17%
- CAS No.: 69618-96-8
- 화학식: C30H22O10
- 분자량:542.49
-
보관:
-20°C, protect from light
* In solvent : -80°C, 6 months; -20°C, 1 month (protect from light)

To place orders, for customer services and technical support, please contact: MedChemExpress USA
Tel: 609-228-6898 E-mail: [email protected] [email protected]


-
 Biological Activity
-
Chemical Information
-
용액&용해도
- Protocol
- 순도&문서
- References
-
 Help & FAQs




Biological Activity
제품 설명
|
Caspase-3 |
Caspase-9 |
Bcl-2 |
Bax |
IL-4 |
Cellular Effect
|
Cell Line

|
Type | Value | Description | References |
|---|---|---|---|---|
| A549 | IC50 |
7.72 μM
|
Cytotoxicity against human lung adenocarcinoma A549 cells assessed as reduction in cell viability by MTT assay.
Cytotoxicity against human lung adenocarcinoma A549 cells assessed as reduction in cell viability by MTT assay.
|
21952498 |
| H1975 | IC50 |
18.11 μM
|
Cytotoxicity against human non-small cell lung carcinoma H1975 cells assessed as reduction in cell viability by MTT assay.
Cytotoxicity against human non-small cell lung carcinoma H1975 cells assessed as reduction in cell viability by MTT assay.
|
21952498 |
| SMMC-7721 | IC50 |
14.04 μM
|
Cytotoxicity against human hepatoma SMMC-7721 cells assessed as reduction in cell viability by MTT assay.
Cytotoxicity against human hepatoma SMMC-7721 cells assessed as reduction in cell viability by MTT assay.
|
21952498 |
| SK-OV-3 | IC50 |
10.43 μM
|
Cytotoxicity against human adenocarcinoma SKOV-3 cells assessed as reduction in cell viability by MTT assay.
Cytotoxicity against human adenocarcinoma SKOV-3 cells assessed as reduction in cell viability by MTT assay.
|
21952498 |
| MCF7 | IC50 |
4.02 μM
|
Cytotoxicity against human MCF-7 cells assessed as inhibition of cell viability incubated for 72 hrs by MTT assay.
Cytotoxicity against human MCF-7 cells assessed as inhibition of cell viability incubated for 72 hrs by MTT assay.
|
21788932 |
| A549 | IC50 |
4.84 μM
|
Cytotoxicity against human A549 cells assessed as inhibition of cell viability incubated for 72 hrs by MTT assay.
Cytotoxicity against human A549 cells assessed as inhibition of cell viability incubated for 72 hrs by MTT assay.
|
21788932 |
| SGC-7901 | IC50 |
11.97 μM
|
Cytotoxicity against human SGC-7901 cells assessed as inhibition of cell viability incubated for 72 hrs by MTT assay.
Cytotoxicity against human SGC-7901 cells assessed as inhibition of cell viability incubated for 72 hrs by MTT assay.
|
21788932 |
| HCT-8 | IC50 |
12.45 μM
|
Cytotoxicity against human HCT-8 cells assessed as inhibition of cell viability incubated for 72 hrs by MTT assay.
Cytotoxicity against human HCT-8 cells assessed as inhibition of cell viability incubated for 72 hrs by MTT assay.
|
21788932 |
| HeLa | IC50 |
9.88 μM
|
Cytotoxicity against human Hela cells assessed as inhibition of cell viability incubated for 72 hrs by MTT assay.
Cytotoxicity against human Hela cells assessed as inhibition of cell viability incubated for 72 hrs by MTT assay.
|
21788932 |
| HepG2 | IC50 |
14.36 μM
|
Cytotoxicity against human HepG2 cells assessed as inhibition of cell viability incubated for 72 hrs by MTT assay.
Cytotoxicity against human HepG2 cells assessed as inhibition of cell viability incubated for 72 hrs by MTT assay.
|
21788932 |
| PC-3 | IC50 |
2.28 μM
|
Cytotoxicity against human PC-3 cells assessed as inhibition of cell viability incubated for 72 hrs by MTT assay.
Cytotoxicity against human PC-3 cells assessed as inhibition of cell viability incubated for 72 hrs by MTT assay.
|
21788932 |
| LNCaP | IC50 |
5.21 μM
|
Cytotoxicity against human LNCap cells assessed as inhibition of cell viability incubated for 72 hrs by MTT assay.
Cytotoxicity against human LNCap cells assessed as inhibition of cell viability incubated for 72 hrs by MTT assay.
|
21788932 |
| Vero | IC50 |
3.16 μM
|
Cytotoxicity against african green monkey Vero cells assessed as inhibition of cell viability incubated for 72 hrs by MTT assay.
Cytotoxicity against african green monkey Vero cells assessed as inhibition of cell viability incubated for 72 hrs by MTT assay.
|
21788932 |
| MDCK | IC50 |
4.57 μM
|
Cytotoxicity against Madin-Darby canine kidney MDCK cells assessed as inhibition of cell viability incubated for 72 hrs by MTT assay.
Cytotoxicity against Madin-Darby canine kidney MDCK cells assessed as inhibition of cell viability incubated for 72 hrs by MTT assay.
|
21788932 |
In Vitro
Chamaejasmine (2-64 μM; 24-72 h) exhibits the strongest cytotoxic activity against A549 human lung adenocarcinoma cells with an IC50 of 7.72 μM, compared with weaker effects on H1975, SMMC-7721, and SKOV-3 cell lines[1].
Chamaejasmine (0-8 μM; 48 h) induces the release of cytochrome c from mitochondria into the cytosol in A549 cells[1].
Chamaejasmine (0-8 μM; 48 h) upregulates Bax and downregulates Bcl-2 in A549 cells, increasing the Bax/Bcl-2 ratio[1].
Chamaejasmine (0-8 μM; 48 h) induces the cleavage of caspase-3, caspase-9, and PARP in a dose-dependent manner in A549 cells[1].
Chamaejasmine (40-160 μM; 24 h) inhibits the invasion of MG-63 cells in a concentration-dependent manner[2].
Chamaejasmine (0-100 μM; 72 h) exhibits potent in vitro cytotoxicity against multiple human cancer cell lines, with the strongest activity against PC-3 cells (IC50 = 2.28 μM)[4].
Chamaejasmine (24-72 h) inhibits PC-3 cell proliferation in a time-dependent manner, with the inhibitory effect gradually increasing over time[4].
Chamaejasmine (0.5-4 µM; 24-72 h) increases β-tubulin expression but not α-tubulin expression in PC-3 cells[4].
Chamaejasmine (0-8 μM; 48 h) induces G2/M phase cell cycle arrest in A549 cells in a concentration-dependent manner[1].
Chamaejasmine (0-8 μM; 48 h) induces apoptosis in A549 cells in a concentration-dependent manner[1].
Chamaejasmine (0-8 μM; 48 h) induces ROS generation in A549 cells in a concentration-dependent manner[1].
Chamaejasmine (0-8 μM; 48 h) induces dose-dependent disruption of mitochondrial membrane potential in A549 cells[1].
Chamaejasmine (0-160 μM; 24-48 h) inhibits the viability of MG-63, Saos-2, KHOS, and U2OS osteosarcoma cells in a time- and dose-dependent manner[2].
Chamaejasmine (0-160 μM; 48 h) induces apoptosis in MG-63 cells[2].
Chamaejasmine increases caspase-3 activity in MG-63 and KHOS cells, as well as caspase-9 activity in Saos-2 and U2OS cells[2].
Chamaejasmine (0-160 μM; 48 h) induces morphological features of apoptosis in MG-63 cells in a concentration-dependent manner[2].
Chamaejasmine (160 μM; 48 h) increases the expression of cleaved caspase 3, cleaved caspase 9, and bcl-2/bax in MG-63 cells[2].
Chamaejasmine (0-160 μM; 48 h) mediates autophagy in MG-63 cells through AMPK pathway signaling, as evidenced by an increase in acidic vesicular organelles[2].
Chamaejasmine (0-160 μM; 48 h) induces autophagy in MG-63 cells by increasing the levels of ATG-7, LC3B-II, and beclin-1 in a concentration-dependent manner[2].
Chamaejasmine (0-160 μM; 48 h) activates the AMPK/mTOR signaling pathway in MG-63 cells by increasing AMPK phosphorylation and decreasing mTOR phosphorylation[2].
Chamaejasmine induces ROS generation in MG-63 cells, and ROS production is required for Chamaejasmine-induced AMPK activation in MG-63 cells[2].
Chamaejasmine (30 μM; 1 h) most effectively inhibits DNP-specific IgE-induced degranulation in RBL-2H3 cells[3].
MedChemExpress (MCE) has not independently confirmed the accuracy of these methods. They are for reference only. Further protocols information, click here.
-
Cell Line:A549, H1975, SMMC-7721, SKOV-3
-
Concentration:2, 4, 8, 16, 32, 64 μM
-
Incubation Time:24, 48, 72 h
-
Result:Inhibited the growth of A549 cells in a time- and dose-dependent manner.
Showed more notable cytotoxicity against A549 than H1975, SMMC-7721 and SKOV-3, with IC50 values of 7.72, 18.11, 14.04 and 10.43 μM, respectively.
-
Cell Line:A549
-
Concentration:0, 2, 4, 8 μM
-
Incubation Time:48 h
-
Result:Increased the G2/M phase population from 13.06% to 34.53% at 2-8 μM, as compared to 9.36% of G2/M phase cells in untreated control samples.
Exerted growth-inhibitory effects via G2/M phase arrest in a concentration-dependent manner.
-
Cell Line:A549
-
Concentration:0, 2, 4, 8 μM
-
Incubation Time:48 h
-
Result:Increased the percentage of annexin V-FITC binding A549 cells from 13.06% to 76.46% at 2-8 µM in a concentration-dependent manner.
Shifted data points to the Q2 side in a dose-dependent manner, indicating that the cells moved to the late apoptotic stage.
-
Cell Line:A549
-
Concentration:0, 2, 4, 8 μM
-
Incubation Time:48 h
-
Result:Greatly increased cytochrome c in the cytosol of treated cells, indicating cytochrome c release from mitochondria to cytoplasm.\nRevealed a significant increase in the expression of Bax in treated cells and a significant decrease in Bcl-2 expression.
Increased the Bax/Bcl-2 ratio significantly.\nCleaved pro-caspase-9, pro-caspase-3, and pro-PARP to their active forms.
Increased the level of active protein with dose, demonstrating dose-dependent cleavage.
-
Cell Line:MG-63, Saos-2, KHOS, and U2OS
-
Concentration:0, 40, 80, and 160 μM
-
Incubation Time:24 or 48 h
-
Result:Inhibited cell growth of MG-63, Saos-2, KHOS, and U2OS cell lines effectively in a time- and dose-dependent manner.
-
Cell Line:MG-63
-
Concentration:40, 80, and 160 μM
-
Incubation Time:24 h
-
Result:Significantly inhibited cell invasion compared with control cells in a concentration-dependent manner.
-
Cell Line:MG-63
-
Concentration:0, 40, 80, and 160 μM
-
Incubation Time:48 h
-
Result:Induced apoptosis as analyzed by flow cytometry with Annexin V/PI kit.
-
Cell Line:MG-63
-
Concentration:0, 40, 80, and 160 μM
-
Incubation Time:48 h
-
Result:Caused condensed and fragmented nuclei, characteristic of apoptosis, in a concentration-dependent manner.
-
Cell Line:MG-63
-
Concentration:160 μM
-
Incubation Time:48 h
-
Result:Remarkably increased protein expression of cleaved caspase 3, cleaved caspase 9, and bcl-2/bax.
Decreased the ratio of Bcl-2/Bax.\nIncreased activity of p-AMPK and ATG-7.
Baf (100 nM) decreased the level of p-ampk/ampk and the expression of ATG-7 and markedly decreased the effects of chamaejasmine in the chamaejasmine + Baf co-treatment group.
-
Cell Line:MG-63
-
Concentration:0, 40, 80, and 160 μM
-
Incubation Time:48 h
-
Result:Exhibited more acidic vesicular organelles (AVOs) in the cytoplasm.
-
Cell Line:MG-63
-
Concentration:0, 40, 80, and 160 μM
-
Incubation Time:48 h
-
Result:Detected significant conversion of LC3-I to LC3-II.
Increased levels of ATG-7, LC3B-II and beclin-1 in a concentration-dependent manner.\nIncreased the phosphorylation of AMPK and decreased the phosphorylation of mTOR in a concentration-dependent manner.
-
Cell Line:MCF-7, A549, SGC-7901, HCT-8, HO-4980, Hela, HepG2, PC-3, LNCap, Vero, MDCK
-
Concentration:0, 3.13, 6.25, 12.5, 25, 50, 100 μM
-
Incubation Time:72 h
-
Result:Exhibited strong cytotoxicity against all nine cancer cell lines and normal cell lines with IC50 values of 4.02 μM for MCF-7, 4.84 μM for A549, 11.97 μM for SGC-7901, 12.45 μM for HCT-8, 5.31 μM for HO-4980, 9.88 μM for Hela, 14.36 μM for HepG2, 2.28 μM for PC-3, 5.21 μM for LNCap, 3.16 μM for Vero, and 4.57 μM for MDCK.
-
Cell Line:PC-3
-
Concentration:0, 0.5, 2, 4 µM (concentration-dependent); 2 µM (time-dependent)
-
Incubation Time:72 h (concentration-dependent); 0, 24, 48, 72 h (time-dependent)
-
Result:Increased the percentage of polymerized β-tubulin from 124.21% to 132.66% and 178.57% in a concentration-dependent manner.
After treatment with 2 µM, the percentage of polymerized β-tubulin increased to 120.64%, 143.12%, and 190.11%, respectively.
Largely unchanged the percentage of α-tubulin.
In Vivo
MedChemExpress (MCE) has not independently confirmed the accuracy of these methods. They are for reference only.
-
Animal Model:SKH-1 hairless mice (female, six weeks old, DNCB-induced AD-like skin lesions)[3]
-
Dosage:0.5%
-
Administration:topical; twice a day; 2 weeks
-
Result:Attenuated clinical symptoms of DNCB-induced dermatitis.
Reduced epidermal thickness by 81% compared to DNCB control.
Reduced mast cell number by 62% compared to DNCB control.
Decreased serum IgE concentration by 38% versus DNCB control.
Reduced mean total serum IL-4 level to 25.2 pg/mL compared to 42.5 pg/mL in DNCB controls.
Reduced TEWL to 43.5 g/m2h compared with 68.9 g/m2h in DNCB controls.
Increased skin hydration by 45% compared with DNCB controls.


Chemical Information
-
CAS No. 69618-96-8
-
Appearance Solid
-
분자량 542.49
-
화학식 C30H22O10
-
Color White to off-white
-
SMILES
O=C1[C@]([C@@]2([H])[C@H](C3=CC=C(C=C3)O)OC4=CC(O)=CC(O)=C4C2=O)([H])[C@H](C5=CC=C(C=C5)O)OC6=CC(O)=CC(O)=C61
-
Synonyms
Chamaejasmin
-
Structure Classification
-
선적
Room temperature in continental US; may vary elsewhere.
-
보관
-20°C, protect from light
* In solvent : -80°C, 6 months; -20°C, 1 month (protect from light)


용액&용해도
In Vitro:
DMSO : 100 mg/mL (184.34 mM; Need ultrasonic; Hygroscopic DMSO has a significant impact on the solubility of product, please use newly opened DMSO)
Please refer to the solubility information to select the appropriate solvent. Once prepared, please aliquot and store the solution to prevent product inactivation from repeated freeze-thaw cycles.
Storage method and period of stock solution: -80°C, 6 months; -20°C, 1 month (protect from light). When stored at -80°C, please use it within 6 months. When stored at -20°C, please use it within 1 month.
Please refer to the solubility information to select the appropriate solvent. Once prepared, please aliquot and store the solution to prevent product inactivation from repeated freeze-thaw cycles.
Storage method and period of stock solution: -80°C, 6 months; -20°C, 1 month (protect from light). When stored at -80°C, please use it within 6 months. When stored at -20°C, please use it within 1 month.
Concentration (start) × Volume (start) = Concentration (final) × Volume (final)
In Vivo:
Select the appropriate dissolution method based on your experimental animal and administration route.
- For the following dissolution methods, please ensure to first prepare a clear stock solution using an In Vitro approach and then sequentially add co-solvents:
- To ensure reliable experimental results, the clarified stock solution can be appropriately stored based on storage conditions. As for the working solution for In Vivo experiments, it is recommended to prepare freshly and use it on the same day.
- The percentages shown for the solvents indicate their volumetric ratio in the final prepared solution. If precipitation or phase separation occurs during preparation, heat and/or sonication can be used to aid dissolution.
Add each solvent one by one: 10% DMSO 40% PEG300 5% Tween-80 45% Saline
Solubility: ≥ 2.5 mg/mL (4.61 mM); Clear solution
This protocol yields a clear solution of ≥ 2.5 mg/mL (saturation unknown).
Taking 1 mL working solution as an example, add 100 μL DMSO stock solution (25.0 mg/mL) to 400 μL PEG300, and mix evenly; then add 50 μL Tween-80 and mix evenly; then add 450 μL Saline to adjust the volume to 1 mL.
Preparation of Saline: Dissolve 0.9 g sodium chloride in ddH₂O and dilute to 100 mL to obtain a clear Saline solution.
Add each solvent one by one: 10% DMSO 90% (20% SBE-β-CD in Saline)
Solubility: ≥ 2.5 mg/mL (4.61 mM); Clear solution
This protocol yields a clear solution of ≥ 2.5 mg/mL (saturation unknown).
Taking 1 mL working solution as an example, add 100 μL DMSO stock solution (25.0 mg/mL) to 900 μL 20% SBE-β-CD in Saline, and mix evenly.
Preparation of 20% SBE-β-CD in Saline (4°C, storage for one week): 2 g SBE-β-CD powder is dissolved in 10 mL Saline, completely dissolve until clear.
In Vivo Dissolution Calculator
Please enter the basic information of animal experiments:
-
-
-
-
Recommended: Prepare an additional quantity of animals to account for potential losses during experiments.
Please enter your animal formula composition:
-
%DMSO +
Recommended: Keep the proportion of DMSO in working solution below 2% if your animal is weak.
-
%+
-
+%Tween-80 + +
-
%Saline +
The co-solvents required include: DMSO, . All of co-solvents are available by MedChemExpress (MCE). , Tween 80. All of co-solvents are available by MedChemExpress (MCE).
Working solution concentration: 0.22 mg/mL
Method for preparing stock solution: mg drug dissolved in μL DMSO. Stock solution concentration: mg/mL. * In solvent : -80°C, 6 months; -20°C, 1 month (protect from light)
1. Take μL DMSO stock solution;
2. Add μL .
μL , mix evenly;
3. Then add μL Tween 80, mix evenly;
4. Then add μL
Please ensure that the stock solution in the first step is dissolved to a clear state, and add co-solvents in sequence. You can use ultrasonic heating (ultrasonic cleaner, recommended frequency 20-40 kHz), vortexing, etc. to assist dissolution.

Protocol
-
Mitochondrial membrane-potential fluorescent assay
Mitochondrial membrane potential fluorescent assays estimate ΔΨm in living cells using lipophilic cationic dyes such as TMRM, TMRE, rhodamine 123, and JC-1, which accumulate in mitochondria according to membrane polarization; loss of signal after FCCP or CCCP treatment is interpreted as mitochondrial depolarization. TMRM/TMRE and rhodamine 123 are commonly used for semi-quantitative live-cell microscopy or flow cytometry, while JC-1 can report a shift from red aggregate fluorescence to green monomer fluorescence during depolarization; interpretation requires controls because dye concentration, quenching mode, cell type, dye efflux, and mitochondrial mass can affect fluorescence independently of ΔΨm.
-
Mammalian live/dead viability and cytotoxicity staining
Live/dead viability and cytotoxicity staining assays are based on the simultaneous detection of intracellular esterase activity in metabolically active (viable) cells and membrane integrity loss in non-viable cells. In commonly used dual-staining approaches, membrane-permeant fluorogenic substrates are converted by intracellular esterases into fluorescent products in live cells, while impermeant DNA-binding dyes selectively enter cells with compromised plasma membranes and label nucleic acids in dead or dying cells, enabling discrimination between viable and non-viable populations by fluorescence microscopy or flow cytometry.
-
Annexin V plus membrane-impermeant dye apoptosis staining
Annexin V-based apoptosis assays rely on the detection of phosphatidylserine (PS) externalization from the inner leaflet of the plasma membrane to the outer leaflet, an early biochemical hallmark of apoptosis. Fluorescently labeled Annexin V binds PS in a calcium-dependent manner, enabling identification of early apoptotic cells by flow cytometry or fluorescence microscopy. When combined with a membrane-impermeant DNA-binding dye (e. g. , propidium iodide), this approach allows discrimination between viable (Annexin V−/dye−), early apoptotic (Annexin V+/dye−), and late apoptotic or necrotic (Annexin V+/dye+) cell populations by assessing membrane integrity and PS exposure.
-
ROS/oxidative-stress fluorescent staining
ROS/oxidative-stress fluorescent staining uses cell-permeant fluorogenic probes that become fluorescent after oxidation inside cells or tissues; commonly used examples include DCFH-DA/DCFDA for broad cellular oxidant detection, DHE for superoxide-related signal detection, MitoSOX for mitochondrial superoxide-related signal detection, and CellROX probes for oxidative-stress-associated fluorescence readouts. The assay detects probe oxidation rather than a single ROS species unless the probe and analysis method have been chemically validated for that species. DCFH-DA enters cells, is deacetylated by intracellular esterases to DCFH, and produces fluorescent DCF after oxidation, so the readout is used as an operational measure of total cellular oxidative stress rather than a species-specific ROS measurement. DHE and MitoSOX can report superoxide-related oxidation, but red fluorescence alone can include non-specific ethidium-like oxidation products; HPLC or optimized spectral approaches are
-
Protocol for Cell Cycle
Cell-cycle analysis by flow cytometry measures DNA content in single cells to estimate the fraction of cells in G0/G1, S, and G2/M phases. Propidium iodide intercalates into DNA, and after RNA removal with RNase, fluorescence intensity reflects cellular DNA content: 2N cells are assigned to G0/G1, cells between 2N and 4N to S phase, and 4N cells to G2/M. DNA-content analysis alone cannot reliably separate G0 from G1 or G2 from M. Ki-67 can distinguish quiescent G0 cells from cycling cells, EdU or BrdU incorporation marks active DNA synthesis in S phase, and phospho-histone H3 staining identifies mitotic cells within the 4N population.
-
Cell Viability Determination by MTT Colorimetric Assay
The following protocol uses the MTT colorimetric assay as a classic literature-established method for assessing cell viability/metabolic activity in cultured mammalian cells. MTT[3-(4,5-dimethylthiazol-2-yl)-2,5-diphenyltetrazolium bromide] is reduced by metabolically active cells to a colored formazan product; the amount of formazan is quantified spectrophotometrically and provides an indirect measure of metabolically active viable cells. Importantly, MTT reduction reflects cellular oxidoreductase/metabolic activity rather than an absolute direct count of living cells, so changes in cellular metabolism can alter the signal independently of cell number.
-
Apoptosis
Apoptosis, also called programmed cell death, is generally characterized by distinct morphological characteristics.
-
TUNEL staining for apoptotic DNA fragmentation
TUNEL staining detects DNA strand breaks by using terminal deoxynucleotidyl transferase to add labeled nucleotides to exposed 3′-OH DNA termini, generating either microscopic staining in fixed cells or tissue sections, or fluorescence/cytometric signal in cell suspensions. TUNEL positivity reflects DNA fragmentation but should not be interpreted alone as definitive apoptosis, because TUNEL can also label necrotic, autolytic, mechanically damaged, or DNA-repair-associated DNA breaks.
-
Flow cytometric DNA-content cell-cycle staining
Flow cytometric DNA-content cell-cycle staining measures the fluorescence intensity of DNA-bound fluorochromes in single cells or nuclei to estimate DNA content distributions, allowing assignment of populations to G0/G1, S, and G2/M phases by DNA histogram deconvolution. Propidium iodide (PI) intercalates into DNA, and PI fluorescence is proportional to cellular DNA content when staining is performed under conditions that make DNA accessible and minimize non-DNA signal. Cells with G2/M DNA content are expected to show approximately twice the fluorescence intensity of G0/G1 cells, while S-phase cells occupy intermediate fluorescence values. PI-based DNA-content analysis can also detect cells with fractional DNA content, often reported as sub-G1, when DNA fragmentation and extraction during staining reduce retained DNA signal in apoptotic cells. DAPI is an alternative DNA fluorochrome for univariate DNA-content analysis, while bivariate approaches combining DNA content with proliferation
-
Cell Cytotoxicity Assay
Cytotoxicity assays are usually based on the assessment of cell membrane damage, which can also be indirectly detected by measuring cell viability. Detection methods include MTT assay, CKK-8 assay, LDH assay and ATP assay, etc.
-
TPA/Croton Oil Ear Edema and Dermatitis
The TPA (12-O-tetradecanoylphorbol-13-acetate) and croton oil-induced mouse ear edema model is a well-established acute cutaneous inflammation system used to evaluate topical anti-inflammatory activity by measuring edema formation, neutrophil infiltration, vascular permeability, and cytokine-mediated skin responses in vivo. The inflammatory response is triggered by topical application of phorbol esters (TPA) or croton oil constituents, leading to rapid activation of protein kinase C signaling, leukocyte recruitment, and increased vascular permeability, which can be quantified by ear thickness, weight, dye extravasation, and biochemical markers such as myeloperoxidase (MPO) activity and pro-inflammatory mediators in ear tissue homogenates. This model is widely used for screening anti-inflammatory agents, where reductions in edema and inflammatory biomarkers reflect suppression of acute dermal inflammation and immune cell infiltration. Histological evaluation typically confirms epidermal
-
Mitochondrial membrane-potential and mitochondrial mass staining
Mitochondrial membrane potential staining measures the electrochemical polarization across the mitochondrial inner membrane in live cells using lipophilic cationic fluorescent probes; early rhodamine-based work showed that selective mitochondrial dye accumulation is lost when the mitochondrial transmembrane potential is dissipated. JC-1 reports mitochondrial polarization by shifting from green monomer fluorescence to red J-aggregate fluorescence as dye concentration increases within energized mitochondria; therefore, the red/green fluorescence ratio is used as a relative readout of mitochondrial membrane potential. TMRE or TMRM staining provides a single-channel relative readout because these cationic rhodamine esters accumulate in polarized mitochondria, and lower fluorescence indicates reduced mitochondrial polarization when acquisition and dye-loading conditions are controlled. Mitochondrial mass staining is commonly performed with MitoTracker Green FM or related MitoTracker dyes as
-
Autophagy
Autophagy is a process in which eukaryotic cells use lysosomes to degrade their own cytoplasmic proteins and damaged organelles under the regulation of autophagy related gene (Atg). Microtubule-associated proteins light chain 3 (LC3) is recognized as autophagy marker, which transfers from cytoplasmic LC3 (LC3-I) to membrane type (LC3-II). LC3-II/I ratio could be detected by Western Blot and fluorescence microscopy.
-
Apoptosis Solutions
Apoptosis is a regulated, generally non-lytic cell-death pathway that removes unwanted, damaged, infected, or abnormal cells through coordinated morphological changes, caspase activation, DNA fragmentation, and membrane remodeling. The intrinsic apoptosis pathway is controlled mainly by mitochondrial outer membrane permeabilization, BCL-2 family proteins, cytochrome c release, apoptosome formation, caspase-9 activation, and downstream executioner caspase-3/7 activation. The extrinsic apoptosis pathway is initiated by death receptors such as Fas, TNFR, and TRAIL receptors, which recruit adaptor proteins and activate caspase-8 before engaging executioner caspases or mitochondrial amplification through BID cleavage. Apoptosis is linked to many phenotypes, including cancer cell killing, tissue homeostasis, immune regulation, neurodegeneration, infection response, and treatment-induced cytotoxicity; unresolved questions include how apoptosis interacts with necroptosis, pyroptosis, ferroptos
-
Lysosome and acidic-vesicle live-cell staining
Lysosome and acidic-vesicle live-cell staining detects acidic intracellular compartments by using membrane-permeant acidotropic probes that accumulate in low-pH vesicles, including lysosomes, late endosomes, autolysosomes, and acidic phagosomes. LysoTracker staining is commonly used as an intensity-based readout of acidic lysosomal compartment abundance or enlargement, while acridine orange produces green fluorescence in less concentrated compartments and red fluorescence after concentration-dependent accumulation in acidic vesicular organelles. Loss or reduction of acridine-orange red signal can be used as a readout of lysosomal membrane permeabilization or reduced acidic-vesicle integrity. This protocol is designed for live cultured cells and can be adapted for fluorescence microscopy, high-content imaging, plate-reader readout, or flow cytometry when the selected literature supports the readout. Because these dyes report acidotropic accumulation rather than lysosome identity alone,
-
Subcutaneous Cell-Line-Derived Xenograft
Subcutaneous cell-line-derived xenograft (CDX) models are established by implanting cultured human cancer cell lines into immunodeficient mice, where the injected cells form localized tumors that can be monitored in vivo as a measure of tumorigenic potential, growth kinetics, and treatment response. These models are widely used in oncology research because they allow reproducible tumor formation and enable comparative assessment of tumor growth between different cell lines or genetic manipulations in a controlled in vivo microenvironment. Subcutaneous implantation of cancer cells in immunodeficient mice is a standard approach for evaluating tumor growth behavior and therapeutic response across multiple cancer types, including prostate, esophageal, pancreatic, and colon cancer models.
-
Macroautophagy Solutions
Macroautophagy is a conserved lysosome-dependent degradation pathway in which cytoplasmic material is sequestered into double-membrane autophagosomes and delivered to lysosomes for degradation and recycling. The pathway supports cellular homeostasis during nutrient limitation, organelle stress, protein-aggregate accumulation, infection, differentiation, and tissue remodeling by coupling cargo sequestration, autophagosome maturation, lysosomal fusion, and degradation of cargo-derived macromolecules. The core molecular sequence includes initiation by nutrient- and stress-regulated autophagy machinery, autophagosome nucleation, LC3/ATG8-family conjugation to autophagosomal membranes, cargo selection through receptors such as SQSTM1/p62, autophagosome-lysosome fusion, and lysosomal degradation. LC3 was identified as a mammalian homolog of yeast Atg8 that localizes to autophagosomal membranes after processing, and p62/SQSTM1 was shown to connect ubiquitinated cargo with autophagic degradati


순도&문서
-
Data Sheet (298 KB)
-
SDS (252 KB)
- English - EN (252 KB)
- Français - FR (252 KB)
- Deutsch - DE (252 KB)
- Norwegian - NO (252 KB)
- Español - ES (252 KB)
- Swedish - SV (252 KB)
- Italian - IT (252 KB)
- Korean - KR (252 KB)
- Portuguese - PT (252 KB)
-
Handling Instructions (2659 KB)
References


Complete Stock Solution Preparation Table
Please refer to the solubility information to select the appropriate solvent. Once prepared, please aliquot and store the solution to prevent product inactivation from repeated freeze-thaw cycles.
Storage method and period of stock solution: -80°C, 6 months; -20°C, 1 month (protect from light). When stored at -80°C, please use it within 6 months. When stored at -20°C, please use it within 1 month.
| Optional Solvent | Concentration Solvent Mass | 1 mg | 5 mg | 10 mg | 25 mg |
|---|---|---|---|---|---|
| DMSO | 1 mM | 1.8434 mL | 9.2168 mL | 18.4335 mL | 46.0838 mL |
| 5 mM | 0.3687 mL | 1.8434 mL | 3.6867 mL | 9.2168 mL | |
| 10 mM | 0.1843 mL | 0.9217 mL | 1.8434 mL | 4.6084 mL | |
| 15 mM | 0.1229 mL | 0.6145 mL | 1.2289 mL | 3.0723 mL | |
| 20 mM | 0.0922 mL | 0.4608 mL | 0.9217 mL | 2.3042 mL | |
| 25 mM | 0.0737 mL | 0.3687 mL | 0.7373 mL | 1.8434 mL | |
| 30 mM | 0.0614 mL | 0.3072 mL | 0.6145 mL | 1.5361 mL | |
| 40 mM | 0.0461 mL | 0.2304 mL | 0.4608 mL | 1.1521 mL | |
| 50 mM | 0.0369 mL | 0.1843 mL | 0.3687 mL | 0.9217 mL | |
| 60 mM | 0.0307 mL | 0.1536 mL | 0.3072 mL | 0.7681 mL | |
| 80 mM | 0.0230 mL | 0.1152 mL | 0.2304 mL | 0.5760 mL | |
| 100 mM | 0.0184 mL | 0.0922 mL | 0.1843 mL | 0.4608 mL |


Chamaejasmine Related Classifications
HY-N10093 Related Classifications
 Powered by Bioz