



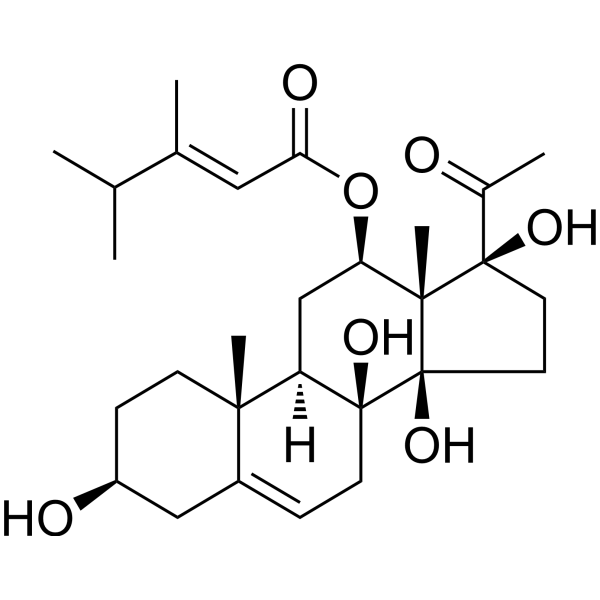
Caudatin
Based on 1 publication(s) in Google Scholar
Caudatin is an orally active and brain-penetrant C-21 steroidal found in Cynanchum bungei decne with a variety of biological activities. Caudatin can inhibit cell proliferation, migration, invasion, cause cell phase arrest, induce apoptosis, autophagy, ROS prodution and loss of mitochondrial membrane potential. Caudatin activates PARP, caspase-3, -7, -9, upregulates pro-apoptotic Bad and Bax and downregulates anti-apoptotic Bcl-2 and Bcl-XL. Caudatin suppresses VEGF, FAK phosphorylation, upregulates p21, p27, DR5 protein expression, activates the p38 MAPK, JNK and PPARα/TFEB-mediated autophagy-lysosomal signaling pathways. Caudatin can be used for the research of cancer, inflammation and neurological disease, such as glioma and Alzheimer's disease.
For research use only. We do not sell to patients.
- Purity : 99.95%
- CAS No.: 38395-02-7
- Formula: C28H42O7
- Molecular Weight:490.63
-
Storage:
4°C, protect from light
* In solvent : -80°C, 6 months; -20°C, 1 month (protect from light)

To place orders, for customer services and technical support, please contact: MedChemExpress USA
Tel: 609-228-6898 E-mail: [email protected] [email protected]


-
 Biological Activity
-
Chemical Information
-
Solvent & Solubility
- Protocols
- Purity & Documentation
- References
-
 Help & FAQs



Publications Citing Use of MedChemExpress (MCE) Caudatin
MoreAll Caspase Isoforms
MoreAll VEGFR Isoforms
More

Biological Activity
Description
IC50 & Target
[1]|
Caspase 3 |
Caspase-7 |
Caspase-9 |
Bax |
Bcl-xL |
Bcl-2 |
bad |
Cellular Effect
|
Cell Line

|
Type | Value | Description | References |
|---|---|---|---|---|
| HCT-116 | IC50 |
64.11 μM
Compound: 1
|
Antiproliferative activity against human HCT-116 cells after 48 hrs by MTT assay
Antiproliferative activity against human HCT-116 cells after 48 hrs by MTT assay
|
[PMID: 34968813] |
| HeLa | IC50 |
>100 μM
Compound: 1
|
Antiproliferative activity against human HeLa cells after 48 hrs by MTT assay
Antiproliferative activity against human HeLa cells after 48 hrs by MTT assay
|
[PMID: 34968813] |
| HepG2 | IC50 |
65.9 μM
Compound: 1
|
Antiproliferative activity against human HepG2 cells after 48 hrs by MTT assay
Antiproliferative activity against human HepG2 cells after 48 hrs by MTT assay
|
[PMID: 34968813] |
| HepG2 2.2.15 | CC50 |
244.58 μM
Compound: 1
|
Cytotoxicity against human HepG2(2.2.15) cells by MTT assay
Cytotoxicity against human HepG2(2.2.15) cells by MTT assay
|
[PMID: 22472044] |
| HepG2 2.2.15 | CC50 |
244.58 μM
Compound: 1
|
Cytotoxicity against human HepG2(2.2.15) cells by modified-MTT assay
Cytotoxicity against human HepG2(2.2.15) cells by modified-MTT assay
|
[PMID: 22687441] |
| HepG2 2.2.15 | IC50 |
>183.44 μM
Compound: 1
|
Antiviral activity against Hepatitis B virus infected in human HepG2(2.2.15) cells assessed as suppression of HbeAg secretion by ELISA
Antiviral activity against Hepatitis B virus infected in human HepG2(2.2.15) cells assessed as suppression of HbeAg secretion by ELISA
|
[PMID: 22472044] |
| HepG2 2.2.15 | IC50 |
>183.44 μM
Compound: 1
|
Antiviral activity against Hepatitis B virus infected in human HepG2(2.2.15) cells assessed as inhibition of viral e antigen secretion by ELISA
Antiviral activity against Hepatitis B virus infected in human HepG2(2.2.15) cells assessed as inhibition of viral e antigen secretion by ELISA
|
[PMID: 22687441] |
| HepG2 2.2.15 | IC50 |
142.67 μM
Compound: 1
|
Antiviral activity against Hepatitis B virus infected in human HepG2(2.2.15) cells assessed as suppression of HBsAg secretion by ELISA
Antiviral activity against Hepatitis B virus infected in human HepG2(2.2.15) cells assessed as suppression of HBsAg secretion by ELISA
|
[PMID: 22472044] |
| HepG2 2.2.15 | IC50 |
142.67 μM
Compound: 1
|
Antiviral activity against Hepatitis B virus infected in human HepG2(2.2.15) cells assessed as inhibition of viral surface antigen secretion by ELISA
Antiviral activity against Hepatitis B virus infected in human HepG2(2.2.15) cells assessed as inhibition of viral surface antigen secretion by ELISA
|
[PMID: 22687441] |
| HepG2 2.2.15 | IC50 |
40.62 μM
Compound: 1
|
Antiviral activity against Hepatitis B virus infected in human HepG2(2.2.15) cells assessed as inhibition of viral DNA replication by RT-PCR analysis
Antiviral activity against Hepatitis B virus infected in human HepG2(2.2.15) cells assessed as inhibition of viral DNA replication by RT-PCR analysis
|
[PMID: 22472044] |
| HepG2 2.2.15 | IC50 |
40.62 μM
Compound: 1
|
Antiviral activity against Hepatitis B virus infected in human HepG2(2.2.15) cells assessed as inhibition of viral DNA replication by PCR analysis
Antiviral activity against Hepatitis B virus infected in human HepG2(2.2.15) cells assessed as inhibition of viral DNA replication by PCR analysis
|
[PMID: 22687441] |
| MCF7 | IC50 |
>100 μM
Compound: 1
|
Antiproliferative activity against human MCF7 cells after 48 hrs by MTT assay
Antiproliferative activity against human MCF7 cells after 48 hrs by MTT assay
|
[PMID: 34968813] |
In Vitro
Caudatin (25-100 μM; 24-72 h) potently inhibits the viability of human glioma U251 and U87 cells in a time- and dose-dependent manner, with U251 cells showing greater sensitivity (IC50 = 52.1 μM at 72 h)[1].
Caudatin (25-100 μM; 72 h) induces dose-dependent apoptosis in human glioma U251 cells, with 71.4% of cells undergoing apoptosis after 72 h treatment with 100 μM caudatin[1].
Caudatin (12.5-100 μM; 72 h) induces dose-dependent PARP cleavage and activation of caspase-3, caspase-7, and caspase-9 in human glioma U251 cells over 72 h[1].
Caudatin (25-100 μM; 5-30 min) induces time-dependent loss of mitochondrial membrane potential in human glioma U251 cells[1].
Caudatin (25-100 μM; 1-72 h) disrupts the balance of Bcl-2 family proteins in human glioma U251 cells, dose-dependently upregulating pro-apoptotic Bad and Bax and downregulating anti-apoptotic Bcl-2 and Bcl-XL over 72 h[1].
Caudatin (25-100 μM; 2-72 h) disturbs intracellular redox homeostasis in human glioma U251 cells by inducing dose-dependent ROS and superoxide accumulation, decreasing mitochondrial mass and GSH content[1].
Caudatin (6-200 μM; 48 h) inhibits HUVEC proliferation in a dose-dependent manner, with 50, 100, and 200 μM concentrations reducing cell viability to 71.5%, 53.6%, and 38.1% respectively after 48 h of treatment[2].
Caudatin (100 μM; 48 h) inhibits HUVEC migration after 48 h of treatment[2].
Caudatin (100 μM; 24 h) inhibits HUVEC invasion after 24 h of treatment[2].
Caudatin (100 μM; 24 h) inhibits HUVEC capillary-like tube formation after 24 h of treatment[2].
Caudatin (50-200 μM; 12-48 h) suppresses FAK phosphorylation in HUVECs in both dose-dependent and time-dependent manners[2].
Caudatin (50-200 μM; 48 h) suppresses the expression of VEGF and phosphorylated VEGFR2 in HUVECs in a dose-dependent manner over 48 h of treatment, without altering total VEGFR2 or AKT levels[2].
Caudatin (5-100 μg/mL; 24 h) inhibits the viability of human MDA-MB-231 and MCF-7 breast cancer cells in a concentration-dependent manner[3].
Caudatin (10-50 μg/mL; 24 h) induces G1-phase cell cycle arrest in human MDA-MB-231 and MCF-7 breast cancer cells[3].
Caudatin (5-50 μg/mL; 24 h) modulates the expression of key cell cycle regulators, including upregulating p21, p27, and p53 and downregulating p-Cdc2, Cdk4, and cyclinB1, in human MDA-MB-231 and MCF-7 breast cancer cells[3].
Caudatin (5-50 μg/mL; 24 h) induces apoptosis in human MDA-MB-231 and MCF-7 breast cancer cells, as evidenced by dose-dependent cleavage of caspase-8, caspase-9, and PARP[3].
Caudatin (5-50 μg/mL; 24 h) upregulates DR5 protein expression in a dose-dependent manner in human MDA-MB-231 and MCF-7 breast cancer cells[3].
Caudatin (5-50 μg/mL; 24 h) activates the endoplasmic reticulum stress response in human MDA-MB-231 and MCF-7 breast cancer cells, as evidenced by dose-dependent upregulation of PERK, BIP, ATF4, and CHOP protein levels[3].
Caudatin (5-50 μg/mL; 24 h) activates the p38 MAPK and JNK signaling pathways in a dose-dependent manner in human MDA-MB-231 and MCF-7 breast cancer cells, without affecting ERK1/2 phosphorylation[3].
Caudatin (10-50 μg/mL; 24 h) triggers apoptosis in human MDA-MB-231 and MCF-7 breast cancer cells[3].
Caudatin binds strongly to the human PPARα ligand binding domain[4].
Caudatin (25 μM; 24 h) rescues mouse hippocampal neuronal HT-22 cells from Aβ1-42-induced cytotoxicity[4].
Caudatin (6.25-25 μM; 24 h) dose-dependently induces autophagy and promotes autophagy flux in mouse neuronal cells[4].
Caudatin (25 μM; 24 h) induces nuclear translocation of PPARα in mouse microglial cells, an effect blocked by the PPARα inhibitor GW6471 (HY-15372)[4].
Caudatin (25 μM) reduces phospho-Tau and APP metabolites in mouse microglial cells overexpressing AD-related mutations in a PPARα-dependent manner[4].
Caudatin (6.25-25 μM) dose-dependently increases TFEB expression and induces TFEB nuclear translocation in mouse neuronal and microglial cells via an MTORC1-independent mechanism[4].
MedChemExpress (MCE) has not independently confirmed the accuracy of these methods. They are for reference only.
-
Cell Line:human glioma U251, U87 cells
-
Concentration:25, 50, 100 μM
-
Incubation Time:24 h; 48 h; 72 h
-
Result:Significantly decreased U251 and U87 cell viability in a time- and dose-dependent manner.
Reduced U251 cell viability to 73.5%, 51.3%, and 28.2% after treatment with 25, 50, 100 μM for 72 h, respectively.
Exhibited IC50 values towards U251 cells of 170.3 μM (24 h), 102.2 μM (48 h), and 52.1 μM (72 h).
-
Cell Line:human glioma U251 cells
-
Concentration:25, 50, 100 μM
-
Incubation Time:72 h
-
Result:Induced significant dose-dependent apoptosis in U251 cells, as measured by the Sub-G1 peak.
Resulted in 10.2%, 34.7%, and 71.4% apoptotic cells after treatment with 25, 50, 100 μM, respectively.
-
Cell Line:human glioma U251 cells
-
Concentration:12.5, 25, 50, 100 μM
-
Incubation Time:72 h
-
Result:Dose-dependently induced PARP cleavage (89 KD fragment) and activation of caspase-3, caspase-7, and caspase-9 in U251 cells.
Resulted in PARP cleavage levels (normalized to β-actin) of 0.1, 0.5, 0.9, and 1.0 for 12.5, 25, 50, and 100 μM, respectively.
Resulted in active caspase-3 levels of 0.4, 0.4, 0.5, and 1.0 for 12.5, 25, 50, and 100 μM, respectively.
Resulted in active caspase-7 levels of 0.5, 0.9, and 1.0 for 25, 50, and 100 μM, respectively.
Resulted in active caspase-9 levels of 0.5, 0.7, and 1.0 for 25, 50, and 100 μM, respectively.
-
Cell Line:human glioma U251 cells
-
Concentration:25, 50, 100 μM (72 h treatment); 50 μM (time-course treatment)
-
Incubation Time:72 h; 1, 6, 12, 24, 48, 72 h (time-course)
-
Result:Dose-dependently upregulated pro-apoptotic Bad and Bax expression, and downregulated anti-apoptotic Bcl-2 and Bcl-XL expression in U251 cells after 72 h treatment.
Decreased Bcl-2 expression (normalized to β-actin) to 0.9, 0.9, 0.8, 0.1, 0.1, and 0.1 at 1, 6, 12, 24, 48, and 72 h, respectively, with 50 μM treatment.
Increased Bad expression to 0.6, 0.7, 0.8, and 1.0 at 12, 24, 48, and 72 h, respectively, with 50 μM treatment.
-
Cell Line:human glioma U251 cells
-
Concentration:50 μM (with 20 μM caspase inhibitor pretreatment)
-
Incubation Time:72 h
-
Result:Reduced 50 μM caudatin-induced apoptosis from 32.4% to 7.4% when cells were pretreated with z-VAD-fmk, and increased cell viability in caudatin-treated cells.
Suppressed caudatin-induced PARP cleavage when cells were pretreated with z-VAD-fmk or z-LEHD-fmk.
Suppressed caudatin-induced activation of caspase-3, caspase-7, and caspase-9 when cells were pretreated with z-VAD-fmk or z-DEVD-fmk.
-
Cell Line:human umbilical vein endothelial cells (HUVECs)
-
Concentration:6, 12, 25, 50, 100, 200 μM
-
Incubation Time:48 h
-
Result:Slightly promoted HUVEC growth at 6 μM.
Significantly inhibited HUVEC viability in a dose-dependent manner at 25, 50, 100, 200 μM, reducing viability to 71.5% (50 μM), 53.6% (100 μM), and 38.1% relative to control.
-
Cell Line:human umbilical vein endothelial cells (HUVECs)
-
Concentration:50, 100, 200 μM (dose-dependent assay); 100 μM (time-dependent assay)
-
Incubation Time:48 h; 12, 24, 48 h (time-dependent assay)
-
Result:Reduced p-FAK levels in a dose-dependent manner at 50, 100, 200 μM after 48 h.
Reduced p-FAK levels in a time-dependent manner at 100 μM after 12, 24, and 48 h.
-
Cell Line:human umbilical vein endothelial cells (HUVECs)
-
Concentration:50, 100, 200 μM
-
Incubation Time:48 h
-
Result:Reduced VEGF and p-VEGFR2 expression in a dose-dependent manner after 48 h, with no significant changes in total VEGFR2 or total AKT levels.
-
Cell Line:human MDA-MB-231 and MCF-7 breast carcinoma cells
-
Concentration:10, 50 μg/mL
-
Incubation Time:24 h
-
Result:Increased the G1-phase population to 64.78±0.98% and decreased the G2/M-phase population to 17.75±0.66% in MDA-MB-231 cells at 10 μg/mL.
Increased the G1-phase population to 69.76±1.83% and decreased the G2/M-phase population to 11.10±1.14% in MDA-MB-231 cells at 50 μg/mL.
Increased the G1-phase population to 57.14±1.11% and decreased the S-phase population to 34.05±1.26% in MCF-7 cells at 10 μg/mL.
Increased the G1-phase population to 73.94±2.01% and decreased the S-phase population to 14.99±1.24% in MCF-7 cells at 50 μg/mL.
-
Cell Line:human MDA-MB-231 and MCF-7 breast carcinoma cells
-
Concentration:5-50 μg/mL
-
Incubation Time:24 h
-
Result:Caused dose-dependent accumulation of p21 and p27 proteins in both cell lines.
Upregulated p53 protein in MCF-7 cells but not in MDA-MB-231 cells.
Downregulated p-Cdc2, Cdk4, and cyclinB1 proteins in both cell lines.
Left Cdc2 protein levels unchanged in both cell lines.
Caused dose-dependent cleavage of caspase-8, caspase-9, and PARP, hallmark features of apoptosis, in both cell lines.
Caused a dose-dependent increase in DR5 protein levels in both cell lines, with no significant change in DR4 protein levels observed.
Caused a dose-dependent increase in protein levels of PERK, BIP, ATF4, and CHOP, markers of ER stress and the unfolded protein response, in both cell lines.
Caused a dose-dependent increase in phosphorylation of p38 MAPK and JNK in both cell lines, with no significant change in ERK1/2 phosphorylation observed.
-
Cell Line:Mouse hippocampal neuronal HT-22 cells
-
Concentration:6.25, 12.5, 25 μM
-
Incubation Time:24 h
-
Result:Significantly reduced SQSTM1 and increased LC3B-II protein levels in HT-22 cells in a dose-dependent manner.
Promoted autophagy flux in N2A tfLC3 cells, as shown by enhanced RFP puncta.
In Vivo
Caudatin (25-50 mg/kg; i.v.; every other day; 16 days) dose-dependently inhibits subcutaneous U251 glioma xenograft growth in male nude mice, while suppressing angiogenesis via reduced VEGF expression, CD34-positive vessel density, and p-AKT/p-FAK levels[2].
Caudatin (20-40 mg/kg; p.o.; daily; 8 months) improves cognitive function, reduces Aβ and pathological Tau pathology, activates PPARα/TFEB-mediated autophagy-lysosomal pathway, and mitigates neuroinflammation in 3XTg-AD mice[4].
Caudatin (20 mg/kg; p.o.; single dose) is brain-permeable in healthy ICR mice, reaching a peak brain concentration of 64.77 ng/g at 15 minutes[4].
MedChemExpress (MCE) has not independently confirmed the accuracy of these methods. They are for reference only.
-
Animal Model:Nude mice with U251 human glioma xenograft (male)[1]
-
Dosage:25 mg/kg; 50 mg/kg
-
Administration:i.v.; every other day; 16 days
-
Result:Reduced tumor volume and tumor weight compared to control.
Induced tumor cell apoptosis (via caspase-3 activation).
Inhibited tumor cell proliferation (via reduced Ki-67 staining).
Suppressed tumor angiogenesis (via reduced CD-31 staining).
Did not affect mouse body weight.
-
Animal Model:Nude mice with U251 human glioma xenograft (male)[2]
-
Dosage:25 mg/kg; 50 mg/kg
-
Administration:i.v.; every other day; 16 days
-
Result:Reduced mean tumor volume and mean tumor weight.
Dose-dependently reduced phosphorylated AKT (p-AKT) and phosphorylated FAK (p-FAK) levels in tumor tissue.
Dose-dependently decreased immunohistochemical staining of Ki-67, VEGF, and CD34 in tumor tissue.
-
Animal Model:3XTg-AD (female, 6 months old, Alzheimer's disease model with K670M/N671L, M146V, P301L mutant gene overexpression); 129/B6/SWJ (female, wildtype littermate)[4]
-
Dosage:20 mg/kg; 40 mg/kg
-
Administration:p.o.; daily; 8 months
-
Result:Reduced escape latency in the Morris water maze (MWM) task, increased time spent in the target quadrant during the MWM probe trial, increased freezing percentage in the contextual fear conditioning test, reduced time spent in the center of the open field chamber, and increased total distance traveled in the open field test compared to vehicle-treated 3XTg-AD mice.
Reduced AT8-positive neuron load in hippocampal brain slices; significantly lowered sarkosyl-insoluble levels of pathological Tau markers PHF1, AT8, CP13, MC1, and HT7 in brain homogenates.
Reduced the number of 4G8-positive Aβ plaques in hippocampal brain slices; significantly lowered formic acid-soluble Aβ1-42 and Aβ1-40 levels in brain homogenates, and reduced SDS-soluble levels of APP metabolites CTFs and pCTFs.
Increased brain homogenate protein levels of PPARα, TFEB, mature CTSD, LAMP1, and LC3B-II, while reducing SQSTM1 levels, compared to vehicle-treated 3XTg-AD mice.
Reduced the number of activated microglia and astrocytes in brain slices, and lowered corresponding protein levels in brain homogenates.
- RNA extraction experimental
- Cell migration
- Somatic Cell Culture
- Alzheimer’s Disease Modeling
- Detection of Apoptosis
- TUNEL staining for apoptotic DNA fragmentation
- Fluorescent plasma-membrane potential dye assay
- Autophagy
- Mitochondrial membrane-potential and mitochondrial mass staining
- Apoptosis Solutions
- Cell invasion
- Lysosome and acidic-vesicle live-cell staining
- MTT Cell Proliferation Assay
- Macroautophagy Solutions
- Western Blot
- Mitochondrial membrane-potential fluorescent assay
- Annexin V plus membrane-impermeant dye apoptosis staining
- BrdU Incorporation Assay
- ROS/oxidative-stress fluorescent staining
- CFSE Dye Dilution Proliferation Assay
- Dye-dilution cell tracking and proliferation staining
- CCK-8/WST-8 Cell Proliferation Assay
- Protocol for Cell Cycle
- Cell Counting-Based Growth Curve Assay
- Research Protocol for Inflammation-related Diseases
- Colony Formation (Clonogenic) Assay
- Research Protocol for Neurological Diseases
- Cell Viability Determination by MTT Colorimetric Assay
- Protocol For Protein Expression And Purification
- Kinase activity and phosphorylation assays
- EdU Incorporation Assay (Click Chemistry-Based DNA Synthesis Measurement)
- Ki-67 Immunostaining Proliferation Assay
- PCNA Immunodetection Proliferation Assay
- Protocol for Cell Counting and Cell Density Analysis
- Protocol for Kinase activity and phosphorylation assays


Chemical Information
-
CAS No. 38395-02-7
-
Appearance Solid
-
Molecular Weight 490.63
-
Formula C28H42O7
-
Color White to off-white
-
SMILES
C[C@@]([C@@H](C[C@]1([H])[C@]23C)OC(/C=C(C)/C(C)C)=O)([C@]4(O)C(C)=O)[C@@]([C@@]1(CC=C2C[C@@H](O)CC3)O)(CC4)O
-
Structure Classification
-
Shipping
Room temperature in continental US; may vary elsewhere.
-
Storage
4°C, protect from light
* In solvent : -80°C, 6 months; -20°C, 1 month (protect from light)


Publications (1)
-
Journal Impact Factor
-
Most Recent


Solvent & Solubility
In Vitro:
DMSO : 50 mg/mL (101.91 mM; Need ultrasonic; Hygroscopic DMSO has a significant impact on the solubility of product, please use newly opened DMSO)
Please refer to the solubility information to select the appropriate solvent. Once prepared, please aliquot and store the solution to prevent product inactivation from repeated freeze-thaw cycles.
Storage method and period of stock solution: -80°C, 6 months; -20°C, 1 month (protect from light). When stored at -80°C, please use it within 6 months. When stored at -20°C, please use it within 1 month.
Please refer to the solubility information to select the appropriate solvent. Once prepared, please aliquot and store the solution to prevent product inactivation from repeated freeze-thaw cycles.
Storage method and period of stock solution: -80°C, 6 months; -20°C, 1 month (protect from light). When stored at -80°C, please use it within 6 months. When stored at -20°C, please use it within 1 month.
Concentration (start) × Volume (start) = Concentration (final) × Volume (final)
In Vivo:
Select the appropriate dissolution method based on your experimental animal and administration route.
- For the following dissolution methods, please ensure to first prepare a clear stock solution using an In Vitro approach and then sequentially add co-solvents:
- To ensure reliable experimental results, the clarified stock solution can be appropriately stored based on storage conditions. As for the working solution for In Vivo experiments, it is recommended to prepare freshly and use it on the same day.
- The percentages shown for the solvents indicate their volumetric ratio in the final prepared solution. If precipitation or phase separation occurs during preparation, heat and/or sonication can be used to aid dissolution.
Add each solvent one by one: 10% DMSO 40% PEG300 5% Tween-80 45% Saline
Solubility: ≥ 2.5 mg/mL (5.10 mM); Clear solution
This protocol yields a clear solution of ≥ 2.5 mg/mL (saturation unknown).
Taking 1 mL working solution as an example, add 100 μL DMSO stock solution (25.0 mg/mL) to 400 μL PEG300, and mix evenly; then add 50 μL Tween-80 and mix evenly; then add 450 μL Saline to adjust the volume to 1 mL.
Preparation of Saline: Dissolve 0.9 g sodium chloride in ddH₂O and dilute to 100 mL to obtain a clear Saline solution.
Add each solvent one by one: 10% DMSO 90% (20% SBE-β-CD in Saline)
Solubility: ≥ 2.5 mg/mL (5.10 mM); Clear solution
This protocol yields a clear solution of ≥ 2.5 mg/mL (saturation unknown).
Taking 1 mL working solution as an example, add 100 μL DMSO stock solution (25.0 mg/mL) to 900 μL 20% SBE-β-CD in Saline, and mix evenly.
Preparation of 20% SBE-β-CD in Saline (4°C, storage for one week): 2 g SBE-β-CD powder is dissolved in 10 mL Saline, completely dissolve until clear.
In Vivo Dissolution Calculator
Please enter the basic information of animal experiments:
-
-
-
-
Recommended: Prepare an additional quantity of animals to account for potential losses during experiments.
Please enter your animal formula composition:
-
%DMSO +
Recommended: Keep the proportion of DMSO in working solution below 2% if your animal is weak.
-
%+
-
+%Tween-80 + +
-
%Saline +
The co-solvents required include: DMSO, . All of co-solvents are available by MedChemExpress (MCE). , Tween 80. All of co-solvents are available by MedChemExpress (MCE).
Working solution concentration: 0.22 mg/mL
Method for preparing stock solution: mg drug dissolved in μL DMSO. Stock solution concentration: mg/mL. * In solvent : -80°C, 6 months; -20°C, 1 month (protect from light)
1. Take μL DMSO stock solution;
2. Add μL .
μL , mix evenly;
3. Then add μL Tween 80, mix evenly;
4. Then add μL
Please ensure that the stock solution in the first step is dissolved to a clear state, and add co-solvents in sequence. You can use ultrasonic heating (ultrasonic cleaner, recommended frequency 20-40 kHz), vortexing, etc. to assist dissolution.


Purity & Documentation
-
Data Sheet (307 KB)
-
SDS (252 KB)
- English - EN (252 KB)
- Français - FR (252 KB)
- Deutsch - DE (252 KB)
- Norwegian - NO (252 KB)
- Español - ES (252 KB)
- Swedish - SV (252 KB)
- Italian - IT (252 KB)
- Korean - KR (252 KB)
- Portuguese - PT (252 KB)
-
Handling Instructions (2659 KB)
References
[1]. Zhu LZ, et al. Caudatin induces caspase-dependent apoptosis in human glioma cells with involvement of mitochondrial dysfunction and reactive oxygen species generation. Cell Biol Toxicol. 2016;32(4):333-345. [Content Brief]
[2]. Wang X, et al. Antiangiogenic properties of caudatin in vitro and in vivo by suppression of VEGF‑VEGFR2‑AKT/FAK signal axis. Mol Med Rep. 2017 Dec;16(6):8937-8943. [Content Brief]
[3]. Fei HR, et al. Caudatin potentiates the anti-tumor effects of TRAIL against human breast cancer by upregulating DR5. Phytomedicine. 2019;62:152950. [Content Brief]
[4]. Krishnamoorthi S, et al. PPARɑ Ligand Caudatin Improves Cognitive Functions and Mitigates Alzheimer's Disease Defects By Inducing Autophagy in Mice Models. J Neuroimmune Pharmacol. 2023;18(3):509-528. [Content Brief]


Complete Stock Solution Preparation Table
Please refer to the solubility information to select the appropriate solvent. Once prepared, please aliquot and store the solution to prevent product inactivation from repeated freeze-thaw cycles.
Storage method and period of stock solution: -80°C, 6 months; -20°C, 1 month (protect from light). When stored at -80°C, please use it within 6 months. When stored at -20°C, please use it within 1 month.
| Optional Solvent | Concentration Solvent Mass | 1 mg | 5 mg | 10 mg | 25 mg |
|---|---|---|---|---|---|
| DMSO | 1 mM | 2.0382 mL | 10.1910 mL | 20.3820 mL | 50.9549 mL |
| 5 mM | 0.4076 mL | 2.0382 mL | 4.0764 mL | 10.1910 mL | |
| 10 mM | 0.2038 mL | 1.0191 mL | 2.0382 mL | 5.0955 mL | |
| 15 mM | 0.1359 mL | 0.6794 mL | 1.3588 mL | 3.3970 mL | |
| 20 mM | 0.1019 mL | 0.5095 mL | 1.0191 mL | 2.5477 mL | |
| 25 mM | 0.0815 mL | 0.4076 mL | 0.8153 mL | 2.0382 mL | |
| 30 mM | 0.0679 mL | 0.3397 mL | 0.6794 mL | 1.6985 mL | |
| 40 mM | 0.0510 mL | 0.2548 mL | 0.5095 mL | 1.2739 mL | |
| 50 mM | 0.0408 mL | 0.2038 mL | 0.4076 mL | 1.0191 mL | |
| 60 mM | 0.0340 mL | 0.1698 mL | 0.3397 mL | 0.8492 mL | |
| 80 mM | 0.0255 mL | 0.1274 mL | 0.2548 mL | 0.6369 mL | |
| 100 mM | 0.0204 mL | 0.1019 mL | 0.2038 mL | 0.5095 mL |


Caudatin Related Classifications
HY-N1983 Related Classifications
 Powered by Bioz
Keywords
- Caudatin
- 38395-02-7
- Apoptosis
- Autophagy
- Reactive Oxygen Species (ROS)
- Mitochondrial Metabolism
- PARP
- Caspase
- Bcl-2 Family
- VEGFR
- FAK
- WDR5
- p38 MAPK
- JNK
- PPAR
- human MDA-MB-231 breast cancer cells
- caspase-7
- glioma
- caspase-9
- Alzheimer’s disease
- HUVECs
- human glioma U251 cells
- caspase-3
- human MCF-7 breast cancer cells
- human glioma U87 cells
- Inhibitor
- inhibitor
- inhibit