



Nodularin

Based on 1 Customer Validation
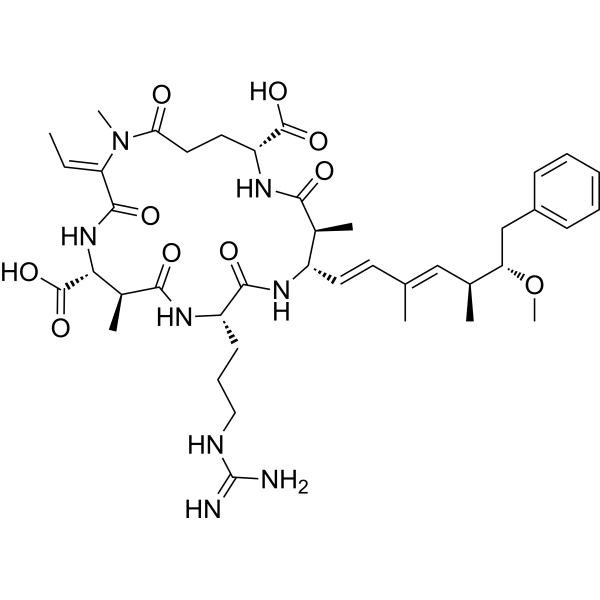
Nodularin is a hepatotoxin, tumor promoter, and protein phosphatase inhibitor. Nodularin induces apoptosis (apoptosis) in normal cells (including caspase activation, upregulation of Bcl-XS, and upregulation of BAX/P53), triggers hyperphosphorylation of the MAPK/ERK, mTOR/S6K and p38 MAPK signaling pathways, and induces oxidative stress, endoplasmic reticulum membrane instability, peroxisome proliferation and increased lysosomal enzyme activity. Nodularin promotes DEN (HY-N7434)-initiated hepatocyte proliferation and adenoma formation, and inhibits proliferation, phagocytosis and chemotaxis of normal lymphocytes, oocyte maturation and vitellogenesis, as well as angiogenesis. Nodularin exhibits hepatotoxicity, reproductive and endocrine toxicity, and embryonic developmental toxicity in various animal models. Nodularin can be used in studies related to liver cancer, hepatotoxicity and reproductive endocrine toxicity.
For research use only. We do not sell to patients.
- Purity : 99.85%
- CAS No.: 118399-22-7
- Formula: C41H60N8O10
- Molecular Weight:824.96
-
Storage:
Sealed storage, away from moisture.
Powder -80°C, 2 years , -20°C, 1 year* In solvent : -80°C, 6 months; -20°C, 1 month (sealed storage, away from moisture)

To place orders, for customer services and technical support, please contact: MedChemExpress USA
Tel: 609-228-6898 E-mail: [email protected] [email protected]


-
 Biological Activity
-
Chemical Information
- Protocols
- Purity & Documentation
- References
-
 Help & FAQs


-
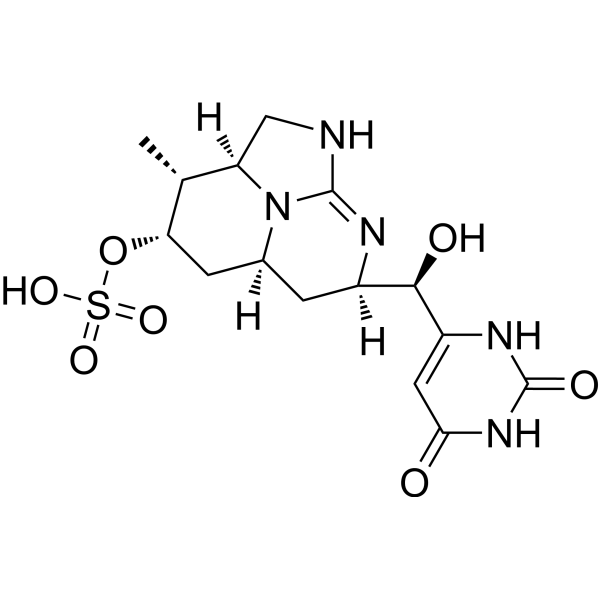
HY-121360
CylindrospermopsinCyanotoxin -
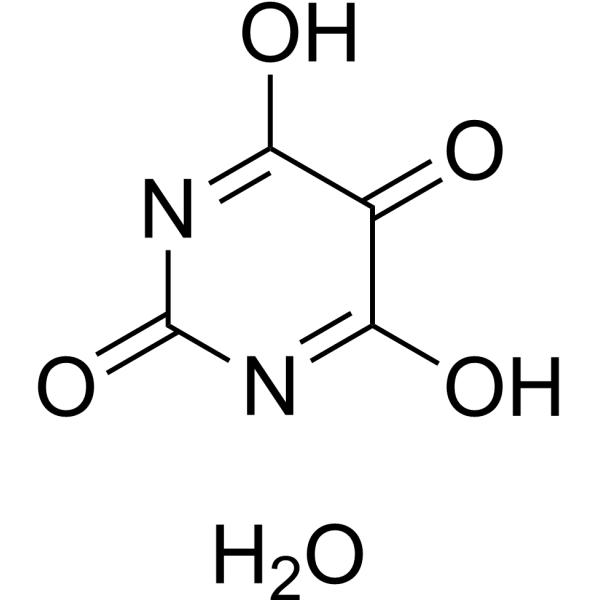
HY-W017227
Alloxan hydrateDiabetogenic Agent/Proteasome Inhibitor -
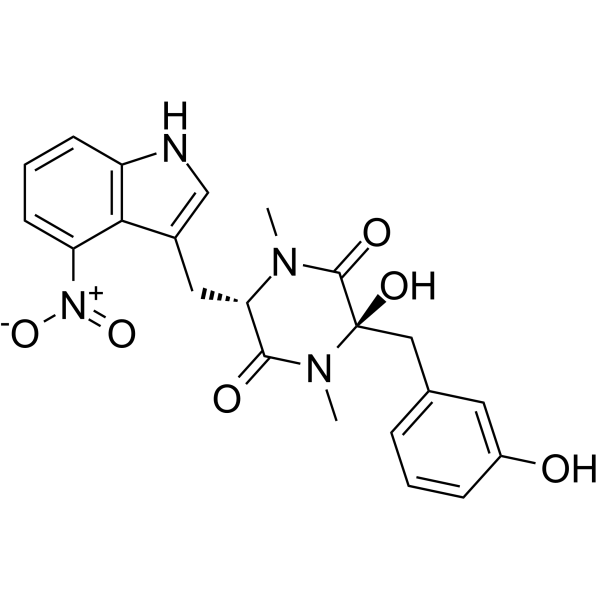
HY-124212
Thaxtomin APhytotoxin -
HY-103447S1
Zearalenone-13C18Mycotoxin Compound -
HY-126856
HC-ToxinHDAC Inhibitor -

HY-125778
Cochlioquinone B -
HY-N10258
(+)-SorokinianinPhytotoxin -

HY-N11952
DihydropyrenophorinMacrolide
All Caspase Isoforms
More

Biological Activity
Description
|
PP1 |
PP2A |
Bax |
Caspase 8 |
Caspase 9 |
Caspase 3 |
Caspase-7 |
In Vitro
Nodularin (1 mM) induces the expression of TNF-α, fos family proto-oncogenes and jun family proto-oncogenes in primary hepatocytes of male Fischer 344 rats[1].
Nodularin (2.5-10 μg/L; 6 h) inhibits human chorionic gonadotropin (HCG)-induced germinal vesicle breakdown (GVBD) in late vitellogenic oocytes of female zebrafish (Danio rerio), and reduces their maturation rates to 47.33%, 43.67% and 36.67%, respectively[3].
Nodularin (200 nM; 10 min) disrupts the colocalization of SOD1 and actin filaments in primary rat hepatocytes, which is characterized by the reorganization of actin into aggregates, while SOD1 remains in the submembrane region[4].
Nodularin (200 nM; 20 min) abolishes the weak interaction between SOD1 and actin in primary rat hepatocytes, as detected by co-immunoprecipitation and Western blotting[4].
Nodularin (5-200 nM; 2-20 min) induces apoptosis in primary rat hepatocytes, accompanied by membrane budding and actin rearrangement; specifically, 5 μM triggers the effect within 2-4 minutes, while 200 nM triggers the effect within 10-20 minutes[4].
Nodularin (5 μM; 2 min) alters the subcellular localization of SOD1 in primary rat hepatocytes, shifting it from the submembrane region to apoptotic membrane budding structures[4].
Nodularin (200 nM; 20 min) causes massive accumulation of SOD1 in the cytoplasmic matrix and endoplasmic reticulum lamellae of apoptotic bodies in primary rat hepatocytes, with only a small amount localized in mitochondria and endoplasmic reticulum[4].
Nodularin (200 nM; 10 min) induces phosphorylation of SOD1 in primary rat hepatocytes, generating two distinct phosphorylated isoforms (P1 and P2) detectable by autoradiography[4].
Nodularin (5 μM; 2 min) significantly increases the phosphorylation level of SOD1 in primary rat hepatocytes, and two distinct phosphorylated isoforms (P1 and P2) are detectable via immunoprecipitation and autoradiography[4].
Nodularin (5 μM; 1.5-4 min) induces ROS production in primary rat hepatocytes, with approximately 50% of cells showing positive ROS staining at 1.5 min and 4 min post-exposure[4].
Nodularin (200 nM; 10 min) does not alter the enzymatic activity of SOD1 in primary rat hepatocytes, and CaMKII inhibition has no effect on this activity[4].
Nodularin (200 nM; 10 min) induces CaMKII-dependent post-translational modifications (phosphorylation and/or oxidation) of SOD1 in primary rat hepatocytes, which can be detected as an acidic shift by two-dimensional Western blotting[4].
Nodularin (1-10 μg/mL; 6-48 h) induces dose- and time-dependent basal DNA strand breaks and oxidative DNA damage (oxidized purines) in HepG2 cells, with the peak of damage occurring at 24 h; significant micronucleus formation in HepG2 cells is induced only at a concentration of 2.5 μg/mL and for durations of 24 h or longer[6].
Nodularin (1-10 μg/mL; 6-48 h) induces apoptosis in HepG2 cells in a dose- and time-dependent manner[6].
Nodularin (0.1-200 nM; 24 h) induces concentration-dependent increases in the activities of caspase 8, 9, and 3/7, as well as concentration-dependent nuclear apoptosis, in primary rat hepatocytes[7].
Nodularin (100-200 nM; 24 h) induces DNA fragmentation in primary rat hepatocytes[7].
Nodularin (10-100 nM; 1-8 h) induces time- and concentration-dependent hyperphosphorylation of ERK1/2, p90RSK (Ser380), p90RSK (Thr359/Ser363), p85S6K (Thr412), p70S6K (Thr389) and p38 (Thr180/Tyr182) in primary rat hepatocytes[7].
Nodularin (5-10 μg/mL; 24 h) exhibits aneuploidy-inducing activity in HepG2 cells and induces the formation of centromere-positive micronuclei[6].
Nodularin (10-100 nM; 1-24 h) induces a time- and concentration-dependent increase in total Bcl-xL levels in primary rat hepatocytes, with significant late activation observed after 24 h[7].
Nodularin (1-10 µg·mL-1; 2 h) neither inhibits nor enhances the in vitro free radical scavenging (antioxidant) activity of purified glutathione (GSH)[8].
Nodularin (0.001-0.1 μg/mL; 24 h) induces concentration-dependent cytotoxicity in primary carp head kidney leukocytes and CLC cells, with primary head kidney leukocytes showing higher sensitivity: significant cytotoxicity appears at concentrations ≥0.05 μg/mL, whereas CLC cells exhibit a significant effect only at 0.1 μg/mL[9].
Nodularin (0.001-0.1 μg/mL; 2 h) increases ROS/RNS production in CLC cells and primary carp head kidney leukocytes at all tested concentrations, without showing a clear dose-dependent response[9].
Nodularin (0.001-0.01 μg/mL; 24 h) regulates the mRNA expression of cytokines in CLC cells and primary head kidney leukocytes of carp. It significantly increases TNF-α expression at both tested concentrations, but exerts no significant effect on TGF-β expression[9].
Nodularin (0.001-0.1 μg/mL; 24 h) induces dose-dependent inhibition of phagocytic activity in CLC cells and primary carp head kidney leukocytes, with significant inhibition observed at concentrations ≥0.01 μg/mL[9].
Nodularin (0.001-0.1 μg/mL; 24 h) exerts a dose-dependent inhibitory effect on the chemotaxis of primary carp head kidney leukocytes and CLC cells, and the inhibitory response of primary head kidney leukocytes is stronger at all effective concentrations[9].
At non-cytotoxic concentrations, Nodularin (0.001-0.05 μg/mL; 24 h) does not affect the production or release of IL-1β in LPS (HY-D1056A1)-stimulated CLC cells[9].
Nodularin (0.001-0.1 μg/mL; 72 h) significantly inhibits the proliferation of primary head kidney (HK) lymphocytes from common carp at concentrations ≥0.01 μg/mL, and the inhibitory effect is stronger when used in combination with concanavalin A (ConA) stimulation[9].
MedChemExpress (MCE) has not independently confirmed the accuracy of these methods. They are for reference only. Further protocols information, click here.
-
Cell Line:HepG2 human hepatoma cells
-
Concentration:1, 2.5, 5 and 10 μg/mL
-
Incubation Time:6, 12, 24 and 48 h
-
Result:Increased the frequency of apoptotic cells steadily with treatment time and dose, with significant elevations observed at 10 μg/mL for 12 and 24 h, and at 5 and 10 μg/mL for 48 h.\nIncreased the frequency of early apoptotic cells in a dose-dependent manner, peaking at 24 h, with significant elevations observed at 10 μg/mL for 6, 12, 24, and 2.5, 5, 10 μg/mL for 48 h.
Increased the frequency of late apoptotic + necrotic cells gradually with dose and treatment time, reaching a peak at 48 h, with significant elevations observed at 10 μg/mL for 12, 24, and 2.5, 5, 10 μg/mL for 48 h.
-
Cell Line:Primary rat hepatocytes
-
Concentration:0.1, 1, 10, 50, 100 and 200 nM
-
Incubation Time:24 h
-
Result:Induced a concentration-dependent increase in the activities of caspase 8, caspase 9, and caspase 3/7 in primary rat hepatocytes after 24 h of exposure.
Caspase 9 and caspase 3/7 were significantly activated at concentrations of 50 nM and above, whereas caspase 8 showed a significant increase only at 100 nM.
Consistent with the activation of caspases, it also induced nuclear apoptosis, as evidenced by condensed, fragmented, or crescent‑shaped nuclei in DAPI-stained cells at concentrations of 50 nM and above.
DNA fragmentation was observed at 100 and 200 nM.
-
Cell Line:Primary rat hepatocytes
-
Concentration:10, 50 and 100 nM
-
Incubation Time:1, 2, 3, 4, 6, 7 and 8 h
-
Result:Induced a time- and concentration-dependent increase in ERK1/2 phosphorylation in primary rat hepatocytes. Significant activation was observed from 6 h onward at 100 nM, from 7 h onward at 50 nM, and from 8 h onward at 10 nM.
Induced a time- and concentration-dependent increase in p90RSK (Ser380) phosphorylation. Significant activation was observed at 10 nM from 3 h onward, with maximal increases of approximately 5- to 6-fold at later time points.
Induced a time- and concentration-dependent increase in p90RSK (Thr359/Ser363) phosphorylation. Significant activation was observed at 10 nM from 6 h onward, with maximal increases of up to 7-fold at 8 h.
Induced a time- and concentration-dependent increase in p85S6K (Thr412) and p70S6K (Thr389) phosphorylation. Significant activation in the higher concentration groups was observed from 6 h onward, with maximal increases of up to 12-fold for p85S6K phosphorylation at later time points.
Induced a time- and concentration-dependent increase in p38 (Thr180/Tyr182) phosphorylation. Significant activation at 50 nM was observed from 2 h onward, whereas significant activation at all tested concentrations (≥10 nM) was observed from 4 h onward.
-
Cell Line:carp leucocyte cell line (CLC) cells, primary common carp (Cyprinus carpio L.) head kidney (HK) leukocytes
-
Concentration:0.001, 0.01, 0.05 and 0.1 μg/mL
-
Incubation Time:24 h
-
Result:Reduced mitochondrial activity to 75% of control and membrane integrity to 76% of control in primary HK leukocytes at 0.05 μg/mL.
Reduced mitochondrial activity to 68% of control and membrane integrity to 45% of control in primary HK leukocytes at 0.1 μg/mL.
Reduced mitochondrial activity to 89% of control and membrane integrity to 82% of control in CLC cells at 0.1 μg/mL.
Caused no significant cytotoxicity at 0.001 or 0.01 μg/mL for either cell type.
-
Cell Line:CLC cells, primary common carp HK leukocytes
-
Concentration:0.001, 0.01, 0.05, 0.1 μg/mL
-
Incubation Time:24 h
-
Result:Reduced migration to ~52% of control in primary HK leukocytes at 0.01 μg/mL.
Reduced migration to ~33% of control in primary HK leukocytes at 0.05 μg/mL.
Reduced migration to ~30% of control in primary HK leukocytes at 0.1 μg/mL.
Reduced migration to ~80% of control in CLC cells at 0.01, 0.05, and 0.1 μg/mL.
Caused no significant reduction in migration for either cell type at 0.001 μg/mL.
-
Cell Line:CLC cells, primary common carp HK leukocytes
-
Concentration:0.001 and 0.01 μg/mL
-
Incubation Time:24 h
-
Result:Increased IL-1β mRNA expression by 2.5-fold relative to control in primary HK leukocytes at 0.01 μg/mL, with no effect on CLC cells.
Increased TNF-α mRNA expression by ~4-fold in CLC cells and ~2.5-fold in HK leukocytes at 0.001 μg/mL.
Increased TNF-α mRNA expression by ~3-fold in CLC cells and ~3.2-fold in HK leukocytes at 0.01 μg/mL, with no clear dose-dependency.
Increased IL-10 mRNA expression by 1.9-fold in CLC cells and 3.2-fold in HK leukocytes at 0.001 μg/mL, while 0.01 μg/mL had no significant effect.
Caused a slight, non-significant upregulation of TGF-β mRNA expression in both cell types at both concentrations.
-
Cell Line:LPS-stimulated CLC cells
-
Concentration:0.001, 0.01, 0.05 μg/mL
-
Incubation Time:24 h
-
Result:Caused no statistically significant changes in extracellular or intracellular IL-1β levels compared to control cells at any tested concentration.
-
Cell Line:primary common carp HK leukocytes
-
Concentration:0.001, 0.01, 0.05, 0.1 μg/mL
-
Incubation Time:72 h
-
Result:Reduced HK lymphocyte proliferation significantly compared to control at 0.01, 0.05, and 0.1 μg/mL.
Caused significantly lower proliferation levels in the Nodularin + ConA group (0.01 to 0.1 μg/mL Nodularin) than those with Nodularin alone.
Caused no significant reduction in proliferation at 0.001 μg/mL.
In Vivo
A single intraperitoneal administration of Nodularin (8 μg/kg) causes a statistically significant increase in the activities of hepatic β-D-glucuronidase, α-glucosidase, lysosomal esterase and N-acetylglucosaminidase in multiple cellular fractions within 24 h, with the peak effect typically occurring at 30 min post-administration, and also induces endoplasmic reticulum membrane instability[2].
Nodularin (2.5-10 μg/L; waterborne exposure; continuous exposure for 14 days) disrupts the reproductive endocrine system of female zebrafish by reducing the levels of gonadotropins and E2, increasing T levels, altering oocyte development, inducing oxidative stress, and regulating gene expression in the hypothalamic-pituitary-gonadal-liver axis[3].
Nodularin (0.5-4 μM; immersion; initiated at 3 hours post-fertilization until the end of the experiment) induces dose-dependent developmental toxicity, oxidative stress, and apoptosis in zebrafish embryos, with the most severe effects observed at the 4 μM dose[5].
Nodularin (25 μg/kg; i.p.; twice a week; for 10 consecutive weeks) induces selective atrophy of the left and caudal liver lobes in normal saline-pretreated F344 rats through sustained inhibition of PP1/PP2A, peroxisome proliferation, and induction of the pro-apoptotic protein Bcl-Xs, while promoting enlargement of the right and middle liver lobes via upregulation of the anti-apoptotic protein Bcl-Xl[10].
Nodularin (25 μg/kg; i.p.; twice a week; for 10 consecutive weeks) promotes hepatocyte proliferation and adenoma formation in DEN (HY-N7434)-induced F344 rats by restoring PP1/PP2A activity, promoting peroxisome proliferation, maintaining the expression of the anti-apoptotic protein Bcl-XL, and simultaneously blocking hepatic lobe atrophy[10].
MedChemExpress (MCE) has not independently confirmed the accuracy of these methods. They are for reference only.
-
Animal Model:7-week-old male Fischer 344 rats (F344/KIST substrain) were given a single intraperitoneal injection of N-nitrosodiethylamine (DEN, 200 mg/kg body weight) at week 0, and subsequent administrations were started from week 3
[1] -
Dosage:25 µg/kg
-
Administration:i.p.; twice weekly; 10 weeks
-
Result:Increased area of eosinophilic nodules to 13.43 mm2/cm2 by week 12, up from 3.23 mm2/cm2 at week 10.
Peaked frequency of homogeneously stained GST-P-positive dense nodules (DN) at 124.5 nodules/cm2 by week 12, then decreased to 60.0 nodules/cm2 by week 18.
Detected heterogeneously stained GST-P-positive pale nodules (PN) first at week 15, reaching 18.0 nodules/cm2 by week 22.
Peaked total area of GST-P-positive nodules at 47.5 mm2/cm2 by week 12, then decreased to 31.5 mm2/cm2 by week 18, with PN areas reaching 7.8 mm2/cm2 by week 22.
Recorded PCNA labeling indices at week 12 of 43.9 nuclei/100 hepatocytes in background parenchyma and 34.3 nuclei/100 hepatocytes in DN, both significantly higher than control (8.5).
Observed background PCNA indices dropped to 11.4 nuclei/100 hepatocytes by week 15, while DN retained a significantly higher index of 30.5; PN had an index of 18.0, higher than control but lower than DN.
Measured PN PCNA index of 12.2 nuclei/100 hepatocytes and DN PCNA index of 32.6 nuclei/100 hepatocytes by week 22.
Peaked PCNA indices in nodularin-only group at 38.4 nuclei/100 hepatocytes at week 12, then returned to control levels (10.2) by week 22.
-
Animal Model:Swiss mice (8-week-old female, 22-25 g)[2]
-
Dosage:8 μg/kg
-
Administration:i.p.; single injection
-
Result:Increased β-D-glucuronidase activity to 157% at 15 min, 175% at 30 min, 130% at 60 min, and 150% at 24 h in complete liver homogenate.
Increased α-glucosidase activity to 150% at 15 min, 162% at 30 min, 133% at 60 min, and 148% at 24 h in complete liver homogenate.
Increased lysosomal esterase activity to 130% at 30 min and 153% at 24 h in complete liver homogenate.
Increased N-acetyl-glucosaminidase activity to 162% at 30 min and 143% at 60 min in complete liver homogenate.
Increased β-D-glucuronidase activity to 220%, 242%, 213%, and 248% in lysosomal fraction at 15, 30, 60 min, and 24 h; increased to 204%, 173%, 150%, and 146% in microsomal fraction at 15, 30, 60 min, and 24 h; decreased to 51%, 70%, 38%, and 63% in cytosol fraction at 15, 30, 60 min, and 24 h.
Increased α-glucosidase activity to 162%, 175%, 153%, and 171% in lysosomal fraction at 15, 30, 60 min, and 24 h; increased to 159% at 15 min and 167% at 30 min in cytosol fraction; decreased to 45%, 54%, 36%, and 63% in microsomal fraction at 15, 30, 60 min, and 24 h.
Increased lysosomal esterase activity to 178% at 60 min and 171% at 24 h in lysosomal fraction; decreased to 66% at 60 min in microsomal fraction.
Increased N-acetyl-glucosaminidase activity to 157%, 177%, and 164% in lysosomal fraction at 15, 30, and 60 min; increased to 190% at 30 min and 143% at 24 h in cytosol fraction; decreased to 51%, 59%, 44%, and 69% in microsomal fraction at 15, 30, 60 min, and 24 h.
-
Animal Model:Danio rerio (adult female)[3]
-
Dosage:2.5 μg/L; 5 μg/L; 10 μg/L
-
Administration:waterborne exposure; continuous; 14 days
-
Result:Decreased gonadosomatic index (GSI) by 4.75% (to 14.68%), 8.83% (to 10.60%), and 11.04% (to 8.39%) in the 2.5 μg/L, 5 μg/L, and 10 μg/L groups, respectively, compared to control (19.43%).
Decreased hepatosomatic index (HSI) by 0.6% (to 1.82%), 0.89% (to 1.53%), and 1.11% (to 1.31%) in the 2.5 μg/L, 5 μg/L, and 10 μg/L groups, respectively, compared to control (2.42%).
Increased perinucleolus stage oocytes to 24%, 33%, and 40%; cortical alveolus stage oocytes to 25%, 28%, and 30%; decreased vitellogenic stage oocytes to 27%, 24%, and 21%; post-vitellogenic stage oocytes to 24%, 15%, and 9% in the 2.5 μg/L, 5 μg/L, and 10 μg/L groups, respectively, compared to control values of 20%, 22%, 30%, and 28%.
Decreased follicle-stimulating hormone (FSH) levels to 25.93 mIU/mL (2.5 μg/L), 19.57 mIU/mL (5 μg/L), and 16.08 mIU/mL (10 μg/L) compared to control (28.16 mIU/mL), with significant decreases at 5 μg/L and 10 μg/L.
Decreased luteinizing hormone (LH) levels to 8.20 mIU/mL (2.5 μg/L), 5.11 mIU/mL (5 μg/L), and 4.48 mIU/mL (10 μg/L) compared to control (14.27 mIU/mL), with significant decreases at all doses.
Decreased 17β-estradiol (E2) levels to 26.67 pg/mL (2.5 μg/L), 20.25 pg/mL (5 μg/L), and 16.95 pg/mL (10 μg/L) compared to control (39.33 pg/mL), with significant decreases at 5 μg/L and 10 μg/L.
Increased testosterone (T) levels to 109.71 pg/mL (2.5 μg/L), 121.65 pg/mL (5 μg/L), and 127.74 pg/mL (10 μg/L) compared to control (100.48 pg/mL), with significant increases at 5 μg/L and 10 μg/L.
Decreased E2/T ratio significantly at all nodularin doses.
Increased ovarian malondialdehyde (MDA) content to 0.0138 μM/mg (2.5 μg/L), 0.0139 μM/mg (5 μg/L), and 0.0141 μM/mg (10 μg/L) compared to control (0.0123 μM/mg).
Increased ovarian DPPH radical scavenging activity to 81.76% (2.5 μg/L), 83.01% (5 μg/L), and 83.96% (10 μg/L) compared to control (75.76%).
Upregulated oxidative stress genes (sod, cat, gpx) in the brain, ovary, and liver at all nodularin doses; at 10 μg/L, sod was upregulated 1.75-fold (ovary), 3.45-fold (liver), 2.73-fold (brain); cat was upregulated 2.11-fold (ovary), 3.40-fold (liver), 1.63-fold (brain); gpx was upregulated 1.77-fold (ovary), 1.45-fold (liver), 2.44-fold (brain).
Upregulated brain genes gnrh2 and gnrh3 1.69/2.39-fold and 1.68/2.61-fold at 5/10 μg/L, respectively; upregulated cyp19a1b 1.81-fold at 10 μg/L; downregulated fshβ 0.57/0.54-fold at 5/10 μg/L; downregulated lhβ 0.73/0.47/0.473-fold at 2.5/5/10 μg/L.
Downregulated ovary genes fshr, 3βhsd, and cdc2 at all doses; downregulated lhr 0.62/0.59-fold at 5/10 μg/L; downregulated 20βhsd 0.41/0.3-fold at 5/10 μg/L; downregulated cyp19a1a 0.52/0.11-fold at 5/10 μg/L; downregulated nprα, mprα, 17βhsd, and cyclinβ at 5/10 μg/L.
Downregulated liver genes vtg1 0.73/0.28-fold at 5/10 μg/L; downregulated vtg2 0.74-fold at 10 μg/L; downregulated vtg3 0.71/0.47/0.23-fold at 2.5/5/10 μg/L.
-
Animal Model:Zebrafish (Danio rerio) embryos of wild-type AB strain, Tg(flk1:EGFP) transgenic line, and Tg(fli1a:NGFP) transgenic line were used. Exposure was initiated at 3 hours post fertilization (hpf)[5]
-
Dosage:0.5 μM, 1 μM, 2 μM, 4 μM
-
Administration:immersion; continuous; from 3 hpf through experimental endpoint
-
Result:Decreased hatching rates to 73.84% (2 μM) and 70.00% (4 μM) at 48 hpf.
Increased mortality rates to 25.00% (0.5 μM), 36.65% (1 μM), 42.50% (2 μM), and 53.00% (4 μM) at 96 hpf.
Increased heart rates to 104.00 bpm (1 μM), 104.50 bpm (2 μM), 110.00 bpm (4 μM) at 48 hpf, and decreased heart rates to 81.00 bpm (2 μM) and 80.00 bpm (4 μM) at 96 hpf.
Decreased endothelial cell migration from caudal hematopoietic tissue to 82.29% (0.5 μM), 71.36% (1 μM), 62.09% (2 μM), and 61.26% (4 μM) of control at 72 hpf.
Increased ROS fluorescence intensity to 6.02-fold of control (0.5 μM) at 120 hpf.
Decreased SOD activity to 64.36% (0.5 μM) and 49.02% (1 μM) of control at 24 hpf.
Decreased CAT activity to 76.07% (1 μM) of control at 24 hpf.
Decreased GSH production to 74.73% (1 μM) of control at 24 hpf.
Increased MDA content to 1.52-fold (0.5 μM) and 1.61-fold (1 μM) of control at 24 hpf.
Increased acridine orange fluorescence intensity to 1.35-fold (0.5 μM), 1.31-fold (1 μM), 1.67-fold (2 μM), and 1.62-fold (4 μM) of control at 120 hpf.
Increased 8-OHdG content to 14.75-fold of control (4 μM) at 24 hpf.
Up-regulated DLL4 (1.38-fold) and VEGFC (1.33-fold), down-regulated CDH5 (47.81%) and VEGFA (44.74%) of control, up-regulated BAX (6.52-fold), P53 (1.56-fold), and CASPASE 3 (1.54-fold), and increased BAX/BCL-2 ratio to 6.12-fold of control for 1 μM at 24 hpf.
Up-regulated BAX (2.70-fold) and increased BAX/BCL-2 ratio to 2.57-fold of control for 0.5 μM at 24 hpf.
-
Animal Model:F344/KIST male rats (7-week-old) treated with saline instead of DEN as the initiator[10]
-
Dosage:25 μg/kg
-
Administration:i.p.; twice weekly; 10 weeks
-
Result:Reduced left liver lobe weight to 0.90 g (week 8), 0.45 g (week 10), 0.81 g (week 12), 0.25 g (week 15), and 0.67 g (week 22) compared to control values of 2.61 g, 3.17 g, 3.17 g, 3.10 g, and 3.34 g respectively.
Reduced caudate liver lobe weight to 0.03 g (week 10), 0.08 g (week 12), 0.16 g (week 15), and 0.07 g (week 22) compared to control values of 0.56 g, 0.56 g, 0.44 g, and 0.76 g respectively.
Increased right liver lobe weight to 3.23 g (week 12), 3.37 g (week 15), and 4.10 g (week 22) compared to control values of 2.04 g, 2.49 g, and 2.08 g respectively.
Increased middle liver lobe weight to 4.47 g (week 8), 4.97 g (week 10), 4.38 g (week 12), 6.26 g (week 15), and 7.33 g (week 22) compared to control values of 2.85 g, 3.92 g, 3.92 g, 3.54 g, and 3.85 g respectively.
Inhibited whole liver protein phosphatase 1 (PP1) and 2A (PP2A) activity to 29.3% of control (week 12) and 50.1% of control (week 15), with persistently lower activity in left liver lobe than right liver lobe through week 22.
Increased palmitoyl-CoA oxidase activity to 0.81 nmole/min/mg protein (week 4), 2.22 nmole/min/mg protein (week 8), 2.19 nmole/min/mg protein (week 10), 2.91 nmole/min/mg protein (week 12), and 2.01 nmole/min/mg protein (week 15) compared to control activity of 0.41 nmole/min/mg protein.
Increased microsomal cytochrome P-450 4A1 (CYP4A1) expression in left and right liver lobes.
Induced pro-apoptotic protein Bcl-Xs expression in left liver lobe from week 4 to week 15, with transiently increased anti-apoptotic Bcl-Xl expression at week 4 then return to control levels.
Induced persistent anti-apoptotic Bcl-Xl expression in right liver lobe with no detectable Bcl-Xs expression.
Caused broad fibrosis and atrophy in left liver lobe, and transient peri-central necrosis in right liver lobe that regenerated to normal by 10 weeks after treatment cessation.
-
Animal Model:7-week-old male Fischer 344 (F344/KIST) rats were given a single intraperitoneal injection of N‑nitrosodiethylamine (DEN (HY-N7434), 200 mg/kg body weight) as an initiator at week 0, and administrations were started from week 3 after initiation[10]
-
Dosage:25 μg/kg
-
Administration:i.p.; twice weekly; 10 weeks
-
Result:Blocked liver lobe atrophy and induced hypertrophy of all four liver lobes, with left lobe weight measuring 1.73 g (week 4), 1.83 g (week 8), 3.60 g (week 10), 3.44 g (week 12), 3.09 g (week 15), and 4.53 g (week 22) compared to control values of 2.25 g, 2.61 g, 3.17 g, 3.17 g, 3.10 g, and 3.34 g respectively.
Inhibited PP1/PP2A activity initially, with activity recovering to 52.7% of control (week 12) and 78% of control (week 15).
Increased palmitoyl-CoA oxidase activity to 0.89 nmole/min/mg protein (week 4), 1.20 nmole/min/mg protein (week 8), 1.29 nmole/min/mg protein (week 10), and 1.22 nmole/min/mg protein (week 12) compared to control activity of 0.41 nmole/min/mg protein, with levels lower than in saline-initiated nodularin-treated rats.
Induced microsomal cytochrome P-450 4A1 (CYP4A1) expression relative to controls with some variation.
Induced persistent anti-apoptotic Bcl-Xl expression across all liver lobes, with no Bcl-Xs induction.
Promoted adenoma formation in liver tissue.


Chemical Information
-
CAS No. 118399-22-7
-
Appearance Solid
-
Molecular Weight 824.96
-
Formula C41H60N8O10
-
Color White to off-white
-
Structure Classification
-
Initial Source
-
Shipping
Room temperature in continental US; may vary elsewhere.
-
Storage
Sealed storage, away from moisture
Powder -80°C 2 years -20°C 1 year * In solvent : -80°C, 6 months; -20°C, 1 month (sealed storage, away from moisture)

Protocols
-
Reproductive and Developmental Toxicity Study
Reproductive and developmental toxicity studies detect adverse effects of prenatal or peri/postnatal exposure on maternal condition, pregnancy maintenance, embryo-fetal survival, fetal growth, structural development, and offspring reproductive or developmental endpoints; classic rat protocols generate readouts by comparing treated groups with vehicle, pair-fed, or untreated controls for implantation, resorption, fetal weight, crown-rump length, external morphology, visceral morphology, skeletal ossification, anogenital distance, nipple/areola retention, and postnatal cohort outcomes.
-
Human pluripotent stem cell endothelial-cell differentiation
Human pluripotent stem cell endothelial differentiation is based on stepwise developmental patterning: early activation of WNT/GSK3β inhibition promotes mesodermal or vascular progenitor entry, followed by endothelial specification using VEGF-related signaling, BMP4, FGF2, Notch modulation, or cAMP depending on the published protocol. Endothelial differentiation is read out by acquisition of CD31, CD34, VE-cadherin/CD144, KDR/VEGFR2, vWF, Tie2, NOS3, acetylated LDL uptake, tube/network formation, barrier function, and in vivo vessel-forming capacity where tested.
-
Vascular/Branching Fractal Analysis
Vascular/branching fractal analysis quantifies the geometric complexity of vessel trees or vascular networks from segmented 2D images, commonly by converting vessels into binary and/or skeletonized maps and estimating fractal dimension using box-counting or related approaches. Fractal dimension is interpreted as an image-derived readout of vascular branching complexity, space filling, or density, and has been applied to retinal photographs, fluorescein angiography, OCT angiography, capillary perfusion maps, and in vitro Matrigel angiogenesis networks. The assay readout is generated from vessel-positive pixels after image preprocessing, vessel segmentation, binarization, and optional skeletonization; reported outputs include fractal dimension, vessel density, branchpoint density, endpoint density, vessel length density, tortuosity, and generation-based branching metrics when VESGEN-style analysis is used. The biological interpretation is limited to quantitative vascular patterning and s
-
Annexin V plus membrane-impermeant dye apoptosis staining
Annexin V-based apoptosis assays rely on the detection of phosphatidylserine (PS) externalization from the inner leaflet of the plasma membrane to the outer leaflet, an early biochemical hallmark of apoptosis. Fluorescently labeled Annexin V binds PS in a calcium-dependent manner, enabling identification of early apoptotic cells by flow cytometry or fluorescence microscopy. When combined with a membrane-impermeant DNA-binding dye (e. g. , propidium iodide), this approach allows discrimination between viable (Annexin V−/dye−), early apoptotic (Annexin V+/dye−), and late apoptotic or necrotic (Annexin V+/dye+) cell populations by assessing membrane integrity and PS exposure.
-
ROS/oxidative-stress fluorescent staining
ROS/oxidative-stress fluorescent staining uses cell-permeant fluorogenic probes that become fluorescent after oxidation inside cells or tissues; commonly used examples include DCFH-DA/DCFDA for broad cellular oxidant detection, DHE for superoxide-related signal detection, MitoSOX for mitochondrial superoxide-related signal detection, and CellROX probes for oxidative-stress-associated fluorescence readouts. The assay detects probe oxidation rather than a single ROS species unless the probe and analysis method have been chemically validated for that species. DCFH-DA enters cells, is deacetylated by intracellular esterases to DCFH, and produces fluorescent DCF after oxidation, so the readout is used as an operational measure of total cellular oxidative stress rather than a species-specific ROS measurement. DHE and MitoSOX can report superoxide-related oxidation, but red fluorescence alone can include non-specific ethidium-like oxidation products; HPLC or optimized spectral approaches are
-
Cell migration
Cell migration is a method that plays an important role in wound healing, cell differentiation, embryonic development, etc.
-
Liver Cancer Modeling
Liver cancer can be classified into primary liver cancer and secondary liver cancer. Secondary liver cancer is the metastatic liver cancer. Primary liver cancer includes hepatocellular carcinoma (HCC), intrahepatic cholangiocarcinoma (ICC) and fibrolamellar HCC, of which HCC is the most common form, accounting for approximately 90% of primary liver cancers[1]. HCC mouse models include chemical agent-induced models, transplanted tumor models, and genetic engineered models.
-
Cell Viability Determination by MTT Colorimetric Assay
The following protocol uses the MTT colorimetric assay as a classic literature-established method for assessing cell viability/metabolic activity in cultured mammalian cells. MTT[3-(4,5-dimethylthiazol-2-yl)-2,5-diphenyltetrazolium bromide] is reduced by metabolically active cells to a colored formazan product; the amount of formazan is quantified spectrophotometrically and provides an indirect measure of metabolically active viable cells. Importantly, MTT reduction reflects cellular oxidoreductase/metabolic activity rather than an absolute direct count of living cells, so changes in cellular metabolism can alter the signal independently of cell number.
-
Phagocytosis Functional Assay
A phagocytosis functional assay measures the ability of phagocytic cells, such as neutrophils, macrophages, monocytes, or microglia/macrophages, to bind and internalize particulate targets including bacteria, yeast particles, beads, or myelin particles. Fluorescent flow-cytometry assays detect target uptake as fluorescence associated with gated phagocytes, while pH-sensitive dyes such as pHrodo increase signal in acidic phagosomal compartments and therefore preferentially report internalized particles rather than particles remaining outside the cell. Microscopy or high-content imaging can be used to confirm intracellular localization and, in some protocols, to follow uptake kinetics.
-
Apoptosis
Apoptosis, also called programmed cell death, is generally characterized by distinct morphological characteristics.
-
TUNEL staining for apoptotic DNA fragmentation
TUNEL staining detects DNA strand breaks by using terminal deoxynucleotidyl transferase to add labeled nucleotides to exposed 3′-OH DNA termini, generating either microscopic staining in fixed cells or tissue sections, or fluorescence/cytometric signal in cell suspensions. TUNEL positivity reflects DNA fragmentation but should not be interpreted alone as definitive apoptosis, because TUNEL can also label necrotic, autolytic, mechanically damaged, or DNA-repair-associated DNA breaks.
-
Chemotaxis Gradient Chamber Assay 1
The chemotaxis gradient chamber assay is based on the principle of observing directional cell migration in response to a stable, linear or quasi-linear concentration gradient of a chemoattractant formed between two fluid reservoirs separated by a narrow observation chamber. Cells placed within the chamber respond to the gradient by polarized movement toward higher chemoattractant concentrations, allowing quantification of chemotactic behavior in real time under microscopy. The classic Zigmond chamber design enables simultaneous visualization of gradient formation and individual cell trajectories, making it suitable for studying leukocyte chemotaxis and other motile cell types in vitro.
-
Under-Agarose Cell Migration Assay
The under-agarose cell migration assay is a classical in vitro chemotaxis method designed to evaluate directed cell movement through a semi-solid agarose matrix toward soluble chemoattractant gradients, enabling visualization and quantification of leukocyte or motile cell migration in a confined 2D-like environment. In this system, cells and chemoattractants are placed in separate wells cut into an agarose gel, allowing diffusion-driven gradient formation that guides directional migration, which is typically assessed by measuring migration distance, cell morphology changes, and accumulation toward the chemoattractant source. This assay has been widely used to study neutrophil and leukocyte chemotaxis as a simple alternative to filter-based migration systems and allows direct microscopic observation of migrating cells under near-physiological confinement conditions.
-
Transwell/Boyden Chamber Migration Assay
The Transwell/Boyden chamber migration assay measures cell movement through a porous membrane separating an upper and lower chamber, usually after a chemoattractant gradient is established by placing cells in the upper chamber and chemoattractant-containing medium in the lower chamber. The readout is generated by quantifying cells that traverse the membrane and appear on the lower membrane surface or in the lower chamber, depending on whether the cell type is adherent or non-adherent. This assay reflects chemotactic or haptotactic migration rather than matrix invasion unless an extracellular-matrix barrier is added to the membrane.
-
Endothelial Tube Formation Assay
Endothelial tube formation assay evaluates the ability of endothelial cells to attach, migrate, align, and organize into capillary-like networks when cultured on gelled basement membrane extract or Matrigel; the readout is the morphology and quantity of tube-like networks, which reflects an in vitro endothelial morphogenesis step related to angiogenesis. Basement membrane extract/Matrigel provides laminin-rich extracellular matrix cues that support endothelial differentiation into capillary-like structures, but it can contain biologically active growth factors, so growth-factor-reduced matrix is preferred when testing defined angiogenic stimulators or inhibitors.
-
Apoptosis Solutions
Apoptosis is a regulated, generally non-lytic cell-death pathway that removes unwanted, damaged, infected, or abnormal cells through coordinated morphological changes, caspase activation, DNA fragmentation, and membrane remodeling. The intrinsic apoptosis pathway is controlled mainly by mitochondrial outer membrane permeabilization, BCL-2 family proteins, cytochrome c release, apoptosome formation, caspase-9 activation, and downstream executioner caspase-3/7 activation. The extrinsic apoptosis pathway is initiated by death receptors such as Fas, TNFR, and TRAIL receptors, which recruit adaptor proteins and activate caspase-8 before engaging executioner caspases or mitochondrial amplification through BID cleavage. Apoptosis is linked to many phenotypes, including cancer cell killing, tissue homeostasis, immune regulation, neurodegeneration, infection response, and treatment-induced cytotoxicity; unresolved questions include how apoptosis interacts with necroptosis, pyroptosis, ferroptos
-
Lysosome and acidic-vesicle live-cell staining
Lysosome and acidic-vesicle live-cell staining detects acidic intracellular compartments by using membrane-permeant acidotropic probes that accumulate in low-pH vesicles, including lysosomes, late endosomes, autolysosomes, and acidic phagosomes. LysoTracker staining is commonly used as an intensity-based readout of acidic lysosomal compartment abundance or enlargement, while acridine orange produces green fluorescence in less concentrated compartments and red fluorescence after concentration-dependent accumulation in acidic vesicular organelles. Loss or reduction of acridine-orange red signal can be used as a readout of lysosomal membrane permeabilization or reduced acidic-vesicle integrity. This protocol is designed for live cultured cells and can be adapted for fluorescence microscopy, high-content imaging, plate-reader readout, or flow cytometry when the selected literature supports the readout. Because these dyes report acidotropic accumulation rather than lysosome identity alone,
-
Hepatotoxicity Study
This protocol evaluates hepatotoxicity using complementary in vivo mouse APAP acute liver injury and in vitro hepatocyte-based cytotoxicity readouts. In vivo APAP injury is assessed by serum ALT/AST, liver histology, hepatic glutathione, protein adducts, necrosis, inflammation, and regeneration-related endpoints. In vitro hepatotoxicity is assessed by loss of viability, leakage of ALT/AST/LDH, oxidative-stress markers, mitochondrial function, nuclear morphology, intracellular calcium, and high-content imaging endpoints.
-
Chemotaxis Gradient Chamber Assay 2
Chemotaxis gradient chamber assays measure directional cell migration in response to a soluble chemical gradient by imaging cells as they move across a defined observation region; the readout is generated from time-lapse cell trajectories, displacement toward the gradient, forward migration index, trajectory plots, rose/polar plots, and statistical tests of non-random directionality. The Dunn chamber is a direct-viewing glass chamber in which cells migrate across a bridge between control and chemoattractant wells, allowing observation of cells in a linear concentration gradient; related direct-viewing formats include the Insall chamber, which supports defined unidirectional gradients and high numerical-aperture microscopy, and the μ-Slide Chemotaxis chamber, which supports long-term live-cell imaging and gradient characterization with fluorescent dye.
-
Endothelial Cell Migration/Angiogenic Sprouting Assay
Endothelial cell migration and angiogenic sprouting assays are in vitro (and partially ex vivo-adapted) functional models that quantify the ability of endothelial cells to undergo coordinated migration, extracellular matrix invasion, and multicellular organization into capillary-like sprouts in response to pro-angiogenic stimuli such as VEGF, bFGF, or conditioned microenvironments. These assays are used to model early angiogenic events including tip-cell formation, directional migration, and lumen-like sprout extension, which collectively reflect angiogenic activation and vascular morphogenesis processes observed in vivo.


Purity & Documentation
-
Data Sheet (334 KB)
-
SDS (254 KB)
- English - EN (254 KB)
- Français - FR (254 KB)
- Deutsch - DE (254 KB)
- Norwegian - NO (254 KB)
- Español - ES (254 KB)
- Swedish - SV (254 KB)
- Italian - IT (254 KB)
- Korean - KR (254 KB)
- Portuguese - PT (254 KB)
-
Handling Instructions (2659 KB)
References
[1]. Song KY, et al. Effect of nodularin on the expression of glutathione S-transferase placental form and proliferating cell nuclear antigen in N-nitrosodiethylamine initiated hepatocarcinogenesis in the male Fischer 344 rat. Carcinogenesis. 1999 Aug;20(8):1541-8. [Content Brief]
[2]. Lankoff A, et al. Influence of microcystine-YR and nodularin on the activity of some glucosidases in mouse liver. Toxicology. 2000 May 05;146(2-3):177-85. [Content Brief]
[3]. Biswas C, et al. Toxicological effects of nodularin on the reproductive endocrine system of female zebrafish (Danio rerio). Aquatic toxicology (Amsterdam, Netherlands). 2024 Aug;273:107000. [Content Brief]
[4]. Hjørnevik LV, et al. Nodularin exposure induces SOD1 phosphorylation and disrupts SOD1 co-localization with actin filaments. Toxins. 2012 Dec 14;4(12):1482-99. [Content Brief]
[5]. Chen G, et al. Nodularin induced oxidative stress contributes to developmental toxicity in zebrafish embryos. Ecotoxicology and environmental safety. 2020 May;194:110444. [Content Brief]
[6]. Lankoff A, et al. Nodularin-induced genotoxicity following oxidative DNA damage and aneuploidy in HepG2 cells. Toxicology letters. 2006 Jul 14;164(3):239-48. [Content Brief]
[7]. Ufelmann H, et al. Nodularin-triggered apoptosis and hyperphosphorylation of signaling proteins in cultured rat hepatocytes. Toxicology in vitro : an international journal published in association with BIBRA. 2015 Feb;29(1):16-26. [Content Brief]
[8]. Adamski M, et al. Effect of Microcystin-LR, Nodularin, Anatoxin-a, β-N-Methylamino-L-Alanine and Domoic Acid on Antioxidant Properties of Glutathione. Life (Basel, Switzerland). 2022 Jan 31;12(2):227. [Content Brief]
[9]. Rymuszka A, et al. Cytotoxic and immunological responses of fish leukocytes to nodularin exposure in vitro. Journal of applied toxicology : JAT. 2021 Oct;41(10):1660-1672. [Content Brief]
[10]. Lim IK, et al. Selective left-lobe atrophy by nodularin treatment accompanied by reduced protein phosphatase 1/2A and increased peroxisome proliferation in rat liver. International journal of cancer. 2001 Jan 01;91(1):32-40. [Content Brief]

Calculators
Concentration (start) × Volume (start) = Concentration (final) × Volume (final)


Nodularin Related Classifications
HY-P2040 Related Classifications
 Powered by Bioz
Keywords
- Nodularin
- 118399-22-7
- Phosphatase
- Apoptosis
- Caspase
- Bcl-2 Family
- p38 MAPK
- Ribosomal S6 Kinase (RSK)
- Reactive Oxygen Species (ROS)
- CLC cells
- primary rat hepatocytes
- Fischer 344 rats
- primary common carp HK leukocytes
- zebrafish (Danio rerio)
- protein phosphatase 2A
- protein phosphatase 1
- hepatocellular carcinoma
- mouse liver
- HepG2 cells
- Inhibitor
- inhibitor
- inhibit