



SZUH280

Based on 1 Customer Validation
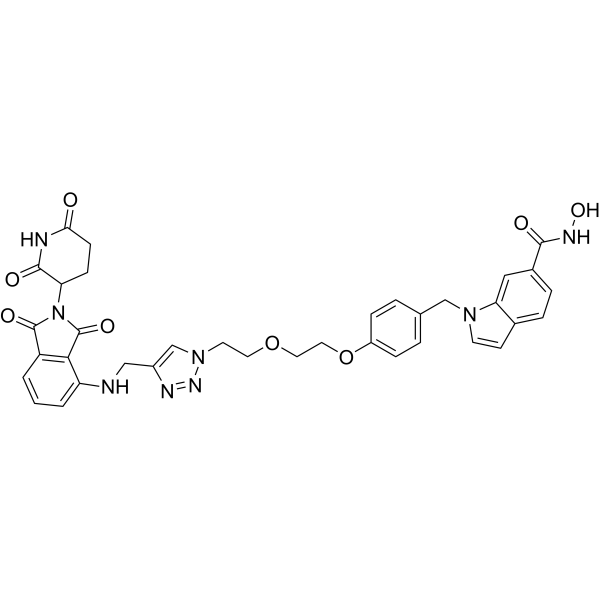
SZUH280 is a selective HDAC8 PROTAC degrader with a DC50 of 0.58 μM. SZUH280 recruits the CRBN E3 ubiquitin ligase to mediate polyubiquitination and proteasomal degradation of HDAC8, and exhibits higher selectivity for HDAC8 over other HDAC family members. SZUH280 induces apoptosis and G2/M cell cycle arrest in cancer cells. SZUH280 impairs DNA damage repair and promotes radiosensitization in cancer cells. SZUH280 inhibits the proliferation of cancer cells. SZUH280 is used in research related to lung cancer and breast cancer.
(Pink: HDAC8 ligand (HY-187005); Blue: Cereblon ligand (HY-41547); Black: linker).
Nos produits utilisent uniquement pour la recherche. Nous ne vendons pas aux patients.
- Pureté : 99.11%
- CAS No.: 2770263-77-7
- Formule: C36H34N8O8
- Masse moléculaire:706.70
-
Stockage:Powder -20°C, 3 years ; In solvent -80°C, 6 months , -20°C, 1 month

To place orders, for customer services and technical support, please contact: MedChemExpress USA
Tel: 609-228-6898 E-mail: [email protected] [email protected]


-
 Activité biologique
-
Chemical Information
-
Solvant et solubilité
- Protocole
- Pureté et documentation
- Références
-
 Help & FAQs


Voir tous les produits spécifiques à Isoform PROTACs
MoreVoir tous les produits spécifiques à Isoform DNA/RNA Synthesis
More

Activité biologique
Description
IC50 & Target
[1]|
HDAC8 0.58 μM (DC50) |
Cellular Effect
|
Cell Line

|
Type | Value | Description | References |
|---|---|---|---|---|
| A549 | GI50 |
9.55 μM
Compound: D10
|
Growth inhibition of human A549 cells incubated for 72 hrs by MTT assay
Growth inhibition of human A549 cells incubated for 72 hrs by MTT assay
|
[PMID: 37607440] |
| A549 | IC50 |
6.04 μM
Compound: 16e
|
Antiproliferative activity against human A549 cells assessed as inhibition of cell growth measured after 72 hrs under irradiation by CCK-8 method
Antiproliferative activity against human A549 cells assessed as inhibition of cell growth measured after 72 hrs under irradiation by CCK-8 method
|
[PMID: 36516047] |
| A549 | IC50 |
9.55 μM
Compound: 16e
|
Antiproliferative activity against human A549 cells assessed as inhibition of cell growth measured after 72 hrs by CCK-8 method
Antiproliferative activity against human A549 cells assessed as inhibition of cell growth measured after 72 hrs by CCK-8 method
|
[PMID: 36516047] |
In Vitro
SZUH280 (10 μM; 4-48 h) induces maximal HDAC8 degradation in A549 cells at 18 h of treatment, and HDAC8 protein levels slowly recover over 48 h following washout[1].
SZUH280 (0.5-8 μM; 20 h) reduces HDAC8 protein levels in a dose-dependent manner in both A549 and HCT116 cells as measured by immunofluorescence[1].
SZUH280 (3 days) inhibits A549 cell proliferation with an IC50 of 9.55 μM, and its activity is enhanced when combined with irradiation[1].
SZUH280 (2.5-20 μM; 7-10 days) suppresses clonogenic growth of A549 and HCT116 cells in a dose-dependent manner[1].
SZUH280 (1.25-20 μM; 72 h) induces dose-dependent apoptosis and G2/M cell cycle arrest in A549 cells[1].
SZUH280 (5 μM; 24 h) hampers DNA damage repair and promotes radiosensitization in A549 lung cancer cells[1].
SZUH280 (16e) (10 μM; 20 h) exerts minimal effects on HDAC mRNA levels but induces a distinct gene expression profile compared to PCI-34051 in A549 cells[1].
SZUH280 (20 h) demonstrates highly selective degradation of HDAC8 at the proteome level in A549 cells[1].
SZUH280 degrades HDAC8 and reduces SMAD3 protein levels in MDA-MB-231 breast cancer cells[1].
MedChemExpress (MCE) has not independently confirmed the accuracy of these methods. They are for reference only.
-
Cell Line:A549 human lung cancer cells
-
Concentration:0.1 μM, 0.3 μM, 1 μM, 3 μM, 10 μM
-
Incubation Time:20 h
-
Result:Exhibited a DC50 value of 0.58 μM for HDAC8 in A549 cells.
Achieved a maximum degradation (Dmax) of >95% at 10 μM.
Showed no obvious hook effect at concentrations up to 10 μM.
-
Cell Line:A549 human lung cancer cells
-
Concentration:10 μM
-
Incubation Time:5, 8, 11, 14, 18, 24 h (time-course); 20 h treatment followed by 4, 6, 8, 16, 20, 24, 48 h washout
-
Result:Showed a dramatic reduction of HDAC8 protein levels at 16 h in the time-course assay.
Induced maximum HDAC8 degradation after 18 h of treatment.
Resulted in slow recovery of HDAC8 protein levels within 48 h after removal in the washout experiment.
-
Cell Line:A549 human lung cancer cells
-
Concentration:5 μM
-
Incubation Time:20 h (2 h pretreatment with modulators before 16e addition)
-
Result:Mediated HDAC8 degradation was attenuated by the proteasome inhibitor MG132.
Mediated HDAC8 degradation was abolished by inhibition of neddylation with MLN4924.
Mediated HDAC8 degradation was competitively inhibited by the HDAC8 inhibitor PCI-34051.
Mediated HDAC8 degradation was blocked by the pan-HDAC inhibitor SAHA.
-
Cell Line:A549 human lung cancer cells, HCT116 human colon cancer cells
-
Concentration:0.5 μM, 1 μM, 2 μM, 4 μM, 8 μM
-
Incubation Time:20 h
-
Result:Significantly reduced HDAC8 foci formation in a dose-dependent manner in both A549 and HCT116 cells compared with untreated controls.
-
Cell Line:A549 human lung cancer cells
-
Concentration:10 μM
-
Incubation Time:20 h
-
Result:Slightly downregulated the mRNA levels of HDAC1, HDAC2, HDAC3, HDAC6, Sirt7, and HDAC8, with reductions of <10%.
Did not markedly change HDAC8 mRNA levels.
Altered the expression of top 10 genes including CYP1B1, OASL, TIPARP, MAFK, EREG, ARPIN, DKK1, NPTX1, MAPK4, and FSTL4.
Exhibited a gene expression profile distinct from that of PCI-34051, with DEGs enriched in biological processes including neuron death, ubiquitin-mediated proteolysis, cell apoptotic process, tyrosine kinase activity, and neuron migration.
-
Cell Line:A549 cells
-
Concentration:1.25 μM; 2.5 μM; 5 μM; 10 μM; 25 μM
-
Incubation Time:72 h
-
Result:Induced dose-dependent apoptosis in A549 cells.
In Vivo
MedChemExpress (MCE) has not independently confirmed the accuracy of these methods. They are for reference only.
-
Animal Model:NOD/SCID (severe combined immunodeficient)[1]
-
Dosage:5 mg/kg
-
Administration:i.p.; every 5 days; 6 weeks
-
Result:Significantly inhibited A549 xenograft tumor growth compared to the control group.
Markedly decreased HDAC8 protein expression in tumor tissues, as confirmed by both western blot and immunohistochemistry.
In combination with 3 Gy irradiation, achieved much stronger antitumor activity than SZUH280 alone, indicating a synergistic interaction.
In combination with 3 Gy irradiation, significantly increased γ-H2AX expression in tumor tissues.
Did not cause weight loss or overt toxicity in treated mice.
- Detection of Apoptosis
- TUNEL staining for apoptotic DNA fragmentation
- Flow cytometric DNA-content cell-cycle staining
- Annexin V plus membrane-impermeant dye apoptosis staining
- BrdU Incorporation Assay
- Apoptosis Solutions
- Protocol for Cell Cycle
- Breast Cancer Modeling
- Genotoxicity/Mutagenicity Study
- Cell Viability Determination by MTT Colorimetric Assay


Chemical Information
-
CAS No. 2770263-77-7
-
Appearance Solid
-
Masse moléculaire 706.70
-
Formule C36H34N8O8
-
Color Light yellow to yellow
-
SMILES
O=C(C1=CC=C2C(N(C=C2)CC3=CC=C(C=C3)OCCOCCN4C=C(N=N4)CNC5=CC=CC(C(N6C7C(NC(CC7)=O)=O)=O)=C5C6=O)=C1)NO
-
Livraison
Room temperature in continental US; may vary elsewhere.
-
Stockage
Powder -20°C 3 years In solvent -80°C 6 months -20°C 1 month


Solvant et solubilité
In Vitro:
DMSO : 116.67 mg/mL (165.09 mM; Need ultrasonic; Hygroscopic DMSO has a significant impact on the solubility of product, please use newly opened DMSO)
Please refer to the solubility information to select the appropriate solvent. Once prepared, please aliquot and store the solution to prevent product inactivation from repeated freeze-thaw cycles.
Storage method and period of stock solution: -80°C, 6 months; -20°C, 1 month. When stored at -80°C, please use it within 6 months. When stored at -20°C, please use it within 1 month.
Please refer to the solubility information to select the appropriate solvent. Once prepared, please aliquot and store the solution to prevent product inactivation from repeated freeze-thaw cycles.
Storage method and period of stock solution: -80°C, 6 months; -20°C, 1 month. When stored at -80°C, please use it within 6 months. When stored at -20°C, please use it within 1 month.
Concentration (start) × Volume (start) = Concentration (final) × Volume (final)


Pureté et documentation
-
Fiche technique (290 KB)
-
SDS (252 KB)
- English - EN (252 KB)
- Français - FR (252 KB)
- Deutsch - DE (252 KB)
- Norwegian - NO (252 KB)
- Español - ES (252 KB)
- Swedish - SV (252 KB)
- Italian - IT (252 KB)
- Korean - KR (252 KB)
- Portuguese - PT (252 KB)
-
Instruction de manipulation (2659 KB)
Références


Complete Stock Solution Preparation Table
Please refer to the solubility information to select the appropriate solvent. Once prepared, please aliquot and store the solution to prevent product inactivation from repeated freeze-thaw cycles.
Storage method and period of stock solution: -80°C, 6 months; -20°C, 1 month. When stored at -80°C, please use it within 6 months. When stored at -20°C, please use it within 1 month.
| Optional Solvent | Concentration Solvent Mass | 1 mg | 5 mg | 10 mg | 25 mg |
|---|---|---|---|---|---|
| DMSO | 1 mM | 1.4150 mL | 7.0751 mL | 14.1503 mL | 35.3757 mL |
| 5 mM | 0.2830 mL | 1.4150 mL | 2.8301 mL | 7.0751 mL | |
| 10 mM | 0.1415 mL | 0.7075 mL | 1.4150 mL | 3.5376 mL | |
| 15 mM | 0.0943 mL | 0.4717 mL | 0.9434 mL | 2.3584 mL | |
| 20 mM | 0.0708 mL | 0.3538 mL | 0.7075 mL | 1.7688 mL | |
| 25 mM | 0.0566 mL | 0.2830 mL | 0.5660 mL | 1.4150 mL | |
| 30 mM | 0.0472 mL | 0.2358 mL | 0.4717 mL | 1.1792 mL | |
| 40 mM | 0.0354 mL | 0.1769 mL | 0.3538 mL | 0.8844 mL | |
| 50 mM | 0.0283 mL | 0.1415 mL | 0.2830 mL | 0.7075 mL | |
| 60 mM | 0.0236 mL | 0.1179 mL | 0.2358 mL | 0.5896 mL | |
| 80 mM | 0.0177 mL | 0.0884 mL | 0.1769 mL | 0.4422 mL | |
| 100 mM | 0.0142 mL | 0.0708 mL | 0.1415 mL | 0.3538 mL |


SZUH280 Related Classifications
HY-152147 Related Classifications
 Powered by Bioz