



Oleacein

Based on 1 Customer Validation
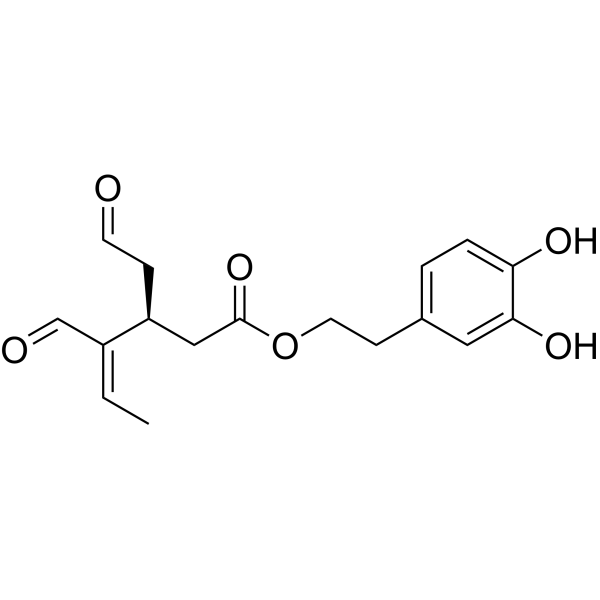
Oleacein is an orally active Oleuropein derivative found in J. grandiflorum, possessing NLRP3/ACE inhibitory, anti-inflammatory, antioxidant, and free radical scavenging activities. Oleacein reduces oxidative stress, pro-inflammatory factor release, leukocyte infiltration, and blood-brain barrier disruption by inhibiting the inflammasome, NF-κB, and AKT/ERK pathways, while upregulating Nrf-2/HO-1 and IL-10, and induces endothelial cell apoptosis. Oleacein can bind TrkB to activate BDNF/TrkB signaling to alleviate neuroinflammation, and modulates metabolic pathways such as PPARγ, adiponectin, SREBP-1, and Glut-4, affecting lipid accumulation and adipocyte function. Oleacein can be used in research related to autoimmune diseases, metabolic diseases, cancer, and depression.
Nos produits utilisent uniquement pour la recherche. Nous ne vendons pas aux patients.
- Pureté : 90.0%
- CAS No.: 149183-75-5
- Formule: C17H20O6
- Masse moléculaire:320.34
-
Stockage:Pure form -20°C, 3 years ; In solvent -80°C, 6 months , -20°C, 1 month

To place orders, for customer services and technical support, please contact: MedChemExpress USA
Tel: 609-228-6898 E-mail: [email protected] [email protected]


-
 Activité biologique
-
Chemical Information
- Protocole
- Pureté et documentation
- Références
-
 Help & FAQs




Activité biologique
Description
In Vitro
Oleacein (1-50 µM; 24 hours) increases BDNF mRNA expression in SH-SY5Y cells in a dose-dependent manner; co-application with ANA-12 (HY-12497), LY294002 (HY-10108), or PD98059 (HY-12028) blocks this increase[6].
Oleacein (1-50 μM; 40 min) inhibits f-MLP (HY-P0224) and PMA (HY-18739)-induced ROS production in human PMNs, with IC50 values of 1.8 μM and 1.5 μM, respectively[2].
Oleacein (1-50 μM; 15 min preincubation) inhibits MPO release from human PMNs with an IC50 of 8.8 μM[2].
Oleacein (100 µM) reduces the invasion of BAECs through Matrigel[5].
Oleacein (100-200 µM) reduces MMP-2 release/activity in BAEC conditioned medium[5].
Oleacein (100 µM; 5 hours) completely prevents tube formation by BAECs on Matrigel[5].
Oleacein (100 µM) does not disrupt preformed BAEC tubular networks[5].
Oleacein (25-100 µM; 2 hours) impairs FBS-induced phosphorylation of AKT and ERK1/2 in BAEC[5].
Oleacein (1-50 μM; 45 min) scavenges superoxide anions in the cell-free xanthine/xanthine oxidase assay, with an IC50 of 17.1 μM[2].
Oleacein (1-50 μM; 40 min) has an IC50 of 50.6 μM in the cell-free HRPO/luminol assay[2].
Oleacein (1-50 μM; 5 min) scavenges HOCl in a cell-free TNB assay with an IC50 of 1.5 μM[2].
Oleacein (5-50 μM; 60 min) scavenges nitric oxide in the cell-free DAF-2 assay with an IC50 of 3.3 μM[2].
Oleacein (1-50 μM; 20 min) inhibits ONOO--activated luminol chemiluminescence in a cell-free assay, with an IC50 of 3.7 μM[2].
MedChemExpress (MCE) has not independently confirmed the accuracy of these methods. They are for reference only.
-
Cell Line:BV2 microglia
-
Concentration:0.5, 1, 10 and 25 µM
-
Incubation Time:24 h
-
Result:No cytotoxic effect on BV2 cells was observed after 24 h at 1-24 µM.
-
Cell Line:BV2 microglia
-
Concentration:1, 10, 20 µM
-
Incubation Time:Pre-incubation for 30 min; 4 h; 24 h (LPS stimulation)
-
Result:LPS-induced phosphorylation of p65-NFκB and overexpression of NLRP3 were up-regulated after 4 h, and Oleacein reduced this upregulation.
Cell preincubation with Oleacein also led to a dose-dependent inhibition of LPS-induced iNOS and COX-2 production, whereas Oleacein did not affect their basal expression per se.
-
Cell Line:BV2 microglia
-
Concentration:1, 10, 20 µM
-
Incubation Time:24 h
-
Result:The presence of Oleacein also reduced the ability of LPS to induce TNFα and mature IL-1β secretion in a dose-dependent manner.
-
Cell Line:RGC-5 retinal ganglion cells
-
Concentration:10, 20 µM
-
Incubation Time:24 h
-
Result:Apoptotic cells increased to 48.4% from 2.7% without stimulus at 24 h.
After coincubation with Oleacein, t-BOOH-induced apoptotic cells decreased to 11.5% at 10 µM and 5.2% at 20 µM.
-
Cell Line:BAEC
-
Concentration:100, 200 µM
-
Incubation Time:7 h
-
Result:The results showed that OLCN inhibited EC migration significantly after 7 h of incubation at both 100 and 200 µM, and this effect was observed in a dose-response manner.
No sign of cell damage was observed at higher doses of the compounds during the assay.
-
Cell Line:BAEC
-
Concentration:25, 50, 100 µM
-
Incubation Time:2 h
-
Result:However, in presence of OLCN and OLCT, the phosphorylation of these signaling proteins was strongly decreased in BAEC at 25, 50, and 100 µM, pointing to an impairment of the activation of the studied signaling pathways by the compounds.
-
Cell Line:Human neuroblastoma SH-SY5Y cells
-
Concentration:1, 5, 10, 20, 30, 40 and 50 µM
-
Incubation Time:24 h (OC incubation); 24 h (inhibitor co-incubation)
-
Result:A dose-dependent increase in BDNF expression in SH-SY5Y cells resulted from OC, starting from 10 µM.
Co-administration of OC with ANA-12, LY294002, or PD98059 inhibited the OC-induced upregulation of BDNF expression.
In Vivo
Oleacein (20 mg/kg; oral (gavage); once daily; 8 weeks) reduces adipocyte size and inflammatory infiltration, decreases PPARγ and SREBP-1, increases Adiponectin, and restores muscle Glut-4[3] in already obese HFD-fed mice.
MedChemExpress (MCE) has not independently confirmed the accuracy of these methods. They are for reference only.
-
Animal Model:C57BL/J6 (female, 8-10 weeks old)[1]
-
Dosage:10 mg/kg
-
Administration:i.p.; daily; from immunization day until the end of the experiment (~22-24 days postimmunization)
-
Result:Delayed EAE onset and reduced severity.
Untreated EAE mice began showing symptoms around day 10; first neurological symptoms (score 1) were observed at day 9 with mean day of onset 11.6.
OLE-treated EAE mice showed no disease signs at that time and only minimal pathological abnormalities.
On day 24, untreated EAE mice had an average disease score of 2.5, whereas in OLE-treated EAE mice 9/11 showed inability to curl the distal end of the tail (score 0.5) and 2/11 showed tail atony (score 1).
Reduced serum MOG35-55-specific IgG1 by 64% in EAE mice.
Histological evaluation showed reduced leukocyte infiltration in optic nerve, spinal cord, and cerebellum, and decreased demyelination in optic nerve of OLE-treated EAE mice.
Prevented EAE-induced BBB disruption, shown by reduced brain IgG extravasation, and did not modify BBB integrity in control animals.
In spinal cord, OLE prevented EAE-induced increases in TNFα, MCP-1, GM-CSF, IL-13, and IL-33, and increased IL-10.
In serum, OLE prevented EAE-induced increases in TNFα and GM-CSF; the serum active IL-1β increase was lower (~80%) in OLE-treated EAE mice.
Inhibited EAE-induced superoxide anion production in cerebellum, spinal cord, and optic nerve; prevented increases in MDA and AOPP in serum and spinal cord; ameliorated the EAE-induced drop in serum FRAP, although it did not normalize it; and increased serum Sestrin-3 levels in EAE mice.
-
Animal Model:C57BL/6JOlaHsd (male; 5-week-old at start)[3]
-
Dosage:20 mg/kg
-
Administration:p.o. (oral gavage); once daily; for 5 weeks
-
Result:After 5 weeks, oleacein prevented the increase in adipocyte size in HFD-fed mice compared with HFD-only mice and reduced inflammatory infiltration of macrophages and lymphocytes, as assessed by CD68 and CD45 immunohistochemistry.
FSP1 mRNA expression was about 50% lower in mice given HFD plus this compound than in HFD mice.
In abdominal adipose tissue, FAS and SREBP-1 protein levels were reduced and Adiponectin levels were increased in mice given HFD plus this compound compared with HFD mice; PPARγ was unchanged.
Glut-4 immunostaining was higher in abdominal fat and muscle tissues of mice given HFD plus this compound than in HFD mice.
-
Animal Model:C57BL/6JOlaHsd (male; from initial HFD group after first 5-week period)[3]
-
Dosage:20 mg/kg
-
Administration:p.o. (oral gavage); once daily; for an additional 8 weeks
-
Result:After the additional 8 weeks, this compound reduced PPARγ and SREBP-1 protein expression and increased Adiponectin production compared with HFD-only mice; FAS expression was unchanged.
Adipocyte cell size and inflammatory infiltrate results were similar to the first set, with lower adipocyte size and reduced inflammatory infiltration in mice given HFD plus this compound.
Glut-4 immunoreactivity was increased in fat and muscle; the increase in muscle paralleled enhanced Glut-4 protein expression in muscle plasma membranes by Western blot.
-
Animal Model:ApoE-knockout (ApoE-KO; C57BL/6J background; male; 11 weeks old at study start)[4]
-
Dosage:50 mg/kg
-
Administration:oral; five days per week; 10 weeks
-
Result:In ApoE-KO + ATD + OLEA mice, food intake was 20.39 g/week, beverage intake was 43.88 mL/week, and total energy intake was 91.74 kcal/week.
Did not reduce body weight in ApoE-KO + ATD mice.
Reduced serum total cholesterol and c-LDL, did not affect c-HDL, reduced serum TAGs toward WT + STD levels, and reduced the TAGs/HDL ratio to levels comparable to WT + STD.
Liver TAG content was reduced by more than 50% compared with both WT + ATD and ApoE-KO + ATD groups, although it remained approximately double the WT + STD level.
Liver weight was 1379.8 mg; serum ALT was 36.13 U/L; serum AST was 62.17 U/L; ALT and AST trended lower than in ApoE-KO + ATD, with no signs of hepatic toxicity.
Liver histology showed less intense Oil Red-O staining and fewer, smaller fat vacuoles; aorta histology showed less endothelium denudation and reduced intima/media disorganization and thickening.
Hepatic SOD1 and SOD2 mRNA expression were normalized to WT + STD levels, and serum SOD activity was increased.
Hepatic SCD1, FABP1, and CPT1 were downregulated; ACADL was modestly increased; MMP9 expression showed a trend toward reduction; most other lipid-metabolism genes did not differ.
GTT and ITT showed no differences in glucose handling, though the OLEA-supplemented group showed a trend toward improved glycaemic control at week 10.
-
Animal Model:Bdnf-IRES-AkaLuc (C57BL/6J background)[6]
-
Dosage:10 mg/kg body weight
-
Administration:p.o.; single dose
-
Result:A single oral dose of this compound (10 mg/kg) significantly augmented BDNF protein expression in the mouse brain compared with the saline baseline (Fig. 1C, D); n = 4 per group.
-
Animal Model:ICR (male, 8 weeks old)[6]
-
Dosage:10 mg/kg body weight
-
Administration:p.o.; daily; 10 consecutive days
-
Result:Tail suspension test: immobility time 60.21 s in the this compound group.
Hippocampal mRNA expression: Tnf 0.74, Il6 0.81, Il1β 2.06, Bdnf 0.89.
Hippocampal protein: proBDNF 0.32 pg/µg protein; mBDNF 0.13 pg/µg protein.
DNA microarray (OC+LPS vs LPS): 219 genes differentially expressed, with 113 upregulated and 106 downregulated; 11 genes upregulated by LPS were downregulated by this compound.
Interleukin and TNF signal intensities were decreased in the this compound condition.
MCODE analysis of the functional network showed that antigen presentation and natural killer cell-mediated cytotoxicity were upregulated in the LPS condition but downregulated in the this compound condition.
Functional enrichment implicated PI3K/Akt and MAPK pathways.
-
Animal Model:DBA-1/J (male, 3 weeks old at housing, 4 weeks old at randomization, 10 weeks old at CIA induction)[7]
-
Dosage:0.025% w/w, equivalent to 250 mg/kg
-
Administration:p.o.; ad libitum; starting 6 weeks before CIA induction and continuing until the end of the experiment (day 43 after the first immunization); fresh diet provided daily
-
Result:In CIA mice fed the this compound diet, arthritis onset was delayed and footpad thickness and inflammation of forelegs and hind legs were reduced compared with SD-CIA mice from days 35 to 42.
Histopathological scores in the this compound group were: soft tissue inflammation mild (+); synovial infiltration negative (−); inflammatory pannus negative (−); cartilage loss and bone resorption negative (−).
Inflammatory and arthritic signs were almost not detected; synovium appearance was similar to controls; only some samples showed moderate inflammation and mild proliferation of synovial cells.
MMP-9 immunostaining in the this compound group was similar to controls.
Showed only some cells of synovial villi immunopositive, while chondrocytes and surface cells remained negative.
Paw homogenate levels of IL-1β, TNF-α, IL-6, and IL-17 were reduced in this compound-fed mice compared with CIA controls.
Serum MMP-3 levels were reduced in this compound-enriched diet-fed mice compared with CIA controls.
COX-2 and mPGES-1 protein expression levels in paw homogenates were reduced in this compound-fed mice compared with CIA controls, and PGE2 levels were reduced.
iNOS protein expression in paws was downregulated in this compound-fed mice compared with CIA controls.
Induced Nrf2 and HO-1 overexpression in paw homogenates compared with CIA controls.
pJAK-3 and pSTAT-3 protein expression in hind paw homogenates was suppressed in this compound-fed mice compared with CIA controls.
JNK and p38 phosphorylation in hind paw homogenates was ameliorated in this compound-fed mice compared with CIA controls.
IκB-α degradation was prevented and p65 phosphorylation was reduced in this compound-fed mice compared with CIA controls.
-
Animal Model:BALB/c (female, 25 g, 12 weeks old at supply, randomized at 16 weeks of age)[8]
-
Dosage:0.01% (w/w) OLA, corresponding to 100 mg/kg in supplemented chow
-
Administration:p.o. via fresh diet; daily; 24 weeks starting at 16 weeks of age
-
Result:Otherwise, dietary OLA significantly ameliorated these manifestations in lymphoid organs, decreasing splenomegaly.
The changes observed in the thymus weight were not statistically significant.
In OLA-supplemented mice, renal histopathological alterations were: hemorrhage 5%, inflammatory cells 30%, glomeruli alterations 25%, and interstitial fibrosis 5%.
However, after dietary supplementation with OLA, only a few mesangial deposits were identified in the renal glomeruli by IHC; no extraglomerular deposits were detected.
In IF, immunocomplexes were found in mesangial cells, with some subendothelial deposits having a granular appearance.
Nevertheless, no extraglomerular deposits were observed.
However, dietary supplementation with OLA significantly downregulated the expression of the proinflammatory enzymes COX-2, iNOS, and mPGES-1 to levels similar to those of the naïve control animals.
However, an OLA-enriched diet significantly downregulated the phosphorylation of JAK3 and STAT3.
On the other hand, we detected a significant increase in Nrf-2 protein expression in the OLA-supplemented group.
This increase was also found in HO-1 protein expression, but it was not statistically significant.
Interestingly, the OLA-enriched diet reduced p65 and p50 translocation to the nucleus compared to the SD-pristane group.
Nevertheless, an OLA-supplemented diet significantly decreased the phosphorylation of ERK and JNK MAPKs.
Nonetheless, OLA dietary supplementation significantly modulated the activation of the canonical inflammasome via the inhibition of NLRP3 and caspase-1 protein expression.
However, no statistically significant changes in ASC expression were observed after OLA dietary supplementation.
Moreover, the OLA-enriched diet also significantly regulated the non-canonical inflammasome, down-regulating pro-caspase 11 protein expression.
Collectively, the levels of IL-18 were also reduced by an OLA-enriched diet.
However, a diet supplemented with OLA could not counteract the endothelial response after ACh exposure.
In contrast, OLA-enriched diets normalized NOX-1 protein expression.
The OLA diet was not able to significantly reduce the phosphorylation of Thr495 peNOS.
Nevertheless, after 6 months, the OLA-supplemented diet was able to counteract the miRNA overexpression and modulate the expression of miRNA-24-3p, miRNA-146a, miRNA-23b, and miRNA-126 in comparison to the SD-pristane group.
Furthermore, an OLA-supplemented diet was able to restore DNMT-1 expression in renal tissue from pristane-induced mice.
- 3T3-L1 preadipocyte-to-adipocyte differentiation
- Detection of Apoptosis
- TUNEL staining for apoptotic DNA fragmentation
- Annexin V plus membrane-impermeant dye apoptosis staining
- ROS/oxidative-stress fluorescent staining
- Large-size fat particle sorting
- Apoptosis Solutions
- Research Protocol for Inflammation-related Diseases
- Research Protocol for Neurological Diseases
- Pyroptosis Solutions
- Lipid Droplets: Oil Red O/Sudan Dye Lipid Staining


Chemical Information
-
CAS No. 149183-75-5
-
Appearance Oil
-
Masse moléculaire 320.34
-
Formule C17H20O6
-
Color Light yellow to brown
-
SMILES
C/C=C(C=O)\[C@@H](CC=O)CC(OCCC1=CC=C(O)C(O)=C1)=O
-
Structure Classification
-
Initial Source
-
Livraison
Room temperature in continental US; may vary elsewhere.
-
Stockage
Pure form -20°C 3 years In solvent -80°C 6 months -20°C 1 month


Pureté et documentation
-
Fiche technique (313 KB)
-
SDS (252 KB)
- English - EN (252 KB)
- Français - FR (252 KB)
- Deutsch - DE (252 KB)
- Norwegian - NO (252 KB)
- Español - ES (252 KB)
- Swedish - SV (252 KB)
- Italian - IT (252 KB)
- Korean - KR (252 KB)
- Portuguese - PT (252 KB)
-
Instruction de manipulation (2659 KB)
Références

Calculators
Concentration (start) × Volume (start) = Concentration (final) × Volume (final)


Oleacein Related Classifications
HY-N8630 Related Classifications
 Powered by Bioz
Keywords
- Oleacein
- 149183-75-5
- Angiotensin-converting Enzyme (ACE)
- NOD-like Receptor (NLR)
- Apoptosis
- Free Radical Scavengers
- Keap1-Nrf2
- NF-κB
- Interleukin Related
- ERK
- Akt
- BDNF
- NLRP3
- PPARγ
- TrkB
- atherosclerosis
- experimental autoimmune encephalomyelitis
- inflammasome
- oxidative stress
- proinflammatory cytokines
- Inhibitor
- inhibitor
- inhibit