



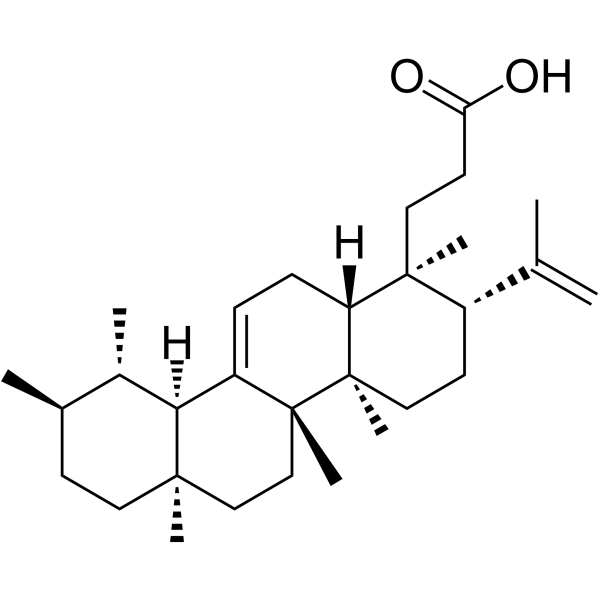
Roburic acid
Based on 1 publication(s) in Google Scholar
Roburic acid acts as an anti-inflammatory, anti-tumor and osteoclastogenesis inhibitor, with a Ki of 7.066 μM against human TNF, an IC50 of 9 μM against human COX-2, and an IC50 of 5 μM against ovine COX-1. Roburic acid reduces the production of inflammatory mediators such as NO and IL-6 in macrophages by inhibiting the NF-κB and MAPK (p38/JNK) pathways. By competitively inhibiting the TNF-TNF-R1 interaction, Roburic acid blocks the downstream NF-κB signaling pathway, thereby inducing cell cycle arrest and apoptosis in cancer cells. Roburic acid specifically inhibits osteoclastogenesis and bone resorption by suppressing the RANKL/TRAF6/NF-κB/NFATc1 axis. Roburic acid can be used in research related to osteolytic diseases such as osteoporosis, colorectal cancer and inflammatory diseases.
For research use only. We do not sell to patients.
- Purity : 99.93%
- CAS No.: 6812-81-3
- Formula: C30H48O2
- Molecular Weight:440.70
-
Storage:
4°C, sealed storage, away from moisture and light
* In solvent : -80°C, 6 months; -20°C, 1 month (sealed storage, away from moisture and light)

To place orders, for customer services and technical support, please contact: MedChemExpress USA
Tel: 609-228-6898 E-mail: [email protected] [email protected]


-
 Biological Activity
-
Chemical Information
-
Solvent & Solubility
- Protocols
- Purity & Documentation
- References
-
 Help & FAQs


Publications Citing Use of MedChemExpress (MCE) Roburic acid
More

Biological Activity
Description
IC50 & Target
|
COX-1 5 μM (IC50) |
COX-2 9 μM (IC50) |
Cellular Effect
|
Cell Line

|
Type | Value | Description | References |
|---|---|---|---|---|
| A549 | IC50 |
>10 μM
Compound: 11
|
Inhibition of microsomal PGES1 isolated from IL-1beta-stimulated human A549 cells preincubated for 15 mins followed by substrate addition measured after 1 min by RP-HPLC analysis
Inhibition of microsomal PGES1 isolated from IL-1beta-stimulated human A549 cells preincubated for 15 mins followed by substrate addition measured after 1 min by RP-HPLC analysis
|
[PMID: 24844534] |
In Vitro
Roburic acid (1-10 μM; 6 days) inhibits RANKL-induced osteoclastogenesis in BMMs, with the most potent effect in the early stage (Day 1-3), and does so without cell toxicity at tested concentrations[2].
Roburic acid (10 μM; 7 days) has no effect on osteoblast differentiation in MC3T3-E1 cells[2].
Roburic acid (5-10 μM) arrests RANKL-induced F-actin belt formation in BMM-derived osteoclasts[2].
Roburic acid (5-10 μM; 2 days) suppresses RANKL-induced osteoclast resorption activity in BMMs[2].
Roburic acid (5-10 μM; 6 days) dose-dependently downregulates the expression of osteoclast-related genes in RANKL-stimulated BMMs[2].
Roburic acid (1-10 μM; 7 h) inhibits RANKL-induced NF-κB activity in RAW264.7 cells[2].
Roburic acid (10 μM; 10 min-5 days) inhibits RANKL-induced TRAF6 expression, ERK phosphorylation, and IκB-α degradation in BMMs[2].
Roburic acid (1-10 μM; 48 h) enhances RANKL-suppressed Nrf2/ARE activity in RAW264.7 cells in a dose-dependent manner[2].
Roburic acid (10 μM; 1-3 days) upregulates HO-1 protein expression in RANKL-stimulated BMMs[2].
Roburic acid (10 μM; 1-5 days) reduces the expression of NFATc1 and its target proteins (Integrin αV, c-Fos, CTSK) in RANKL-stimulated BMMs[2].
Roburic acid (10 μM; 25 h) abates RANKL-stimulated calcium oscillations in BMMs[2].
Roburic acid (1-10 μM; 24 h) inhibits RANKL-induced NFATc1 activity in RAW264.7 cells[2].
Roburic acid (10-40 μM; 4 h) inhibits TNF-induced NF-κB activation in 293-TNF Res (NF-κB) cells[3].
Roburic acid (0-20 μM; 48 h) inhibits the viability of HCT-116, HCT-15, HT29, and Colo205 human colorectal cancer cells with IC50 values of 3.90, 4.77, 5.35, and 14.54 μM, respectively[3].
Roburic acid (4-16 μM; 8 days) inhibits colony formation in HCT-116 and HCT-15 human colorectal cancer cells[3].
Roburic acid (4-16 μM; 26 h) suppresses DNA synthesis in HCT-116 and HCT-15 human colorectal cancer cells[3].
Roburic acid (4-16 μM; 24 h) triggers G0/G1 cell cycle arrest in HCT-116 and HCT-15 human colorectal cancer cells[3].
Roburic acid (4-16 μM; 24 h) induces apoptosis in HCT-116 and HCT-15 human colorectal cancer cells[3].
Roburic acid (8 μM) inhibits TNF-induced NF-κB signaling in HCT-116 and HCT-15 human colorectal cancer cells[3].
Roburic acid (8 μM; 4.5 h) inhibits TNF-induced p65 nuclear translocation in HCT-116 and HCT-15 human colorectal cancer cells[3].
Roburic acid (5-20 μM; 25 h) dose-dependently inhibits LPS (HY-D1056)-induced NO, iNOS and IL-6 expression and NF-κB p65 nuclear translocation in RAW264.7 cells[5].
Roburic acid (5-20 μM; 1.5 h) dose-dependently inhibits LPS-induced phosphorylation of IKKα/β, p38 and JNK MAPKs in RAW264.7 cells[5].
MedChemExpress (MCE) has not independently confirmed the accuracy of these methods. They are for reference only. Further protocols information, click here.
-
Cell Line:RANKL-stimulated bone marrow macrophages (BMMs)
-
Concentration:5 and 10 μM
-
Incubation Time:6 days
-
Result:Dose-dependently decreased the mRNA levels of osteoclast-related genes (c-Fos, Acp5, Nfatc1, Atp6v0d2, Ctsk, Mmp9) that were upregulated by RANKL.
-
Cell Line:RANKL-stimulated bone marrow macrophages (BMMs)
-
Concentration:10 μM
-
Incubation Time:10, 20, 30, 60 min (short-term); 1, 3, 5 days (long-term)
-
Result:Restricted TRAF6 expression, ERK1/2 phosphorylation, and IκB-α degradation in RANKL-stimulated BMMs.
-
Cell Line:RANKL-stimulated bone marrow macrophages (BMMs)
-
Concentration:10 μM
-
Incubation Time:1, 3, 5 days
-
Result:Boosted HO-1 protein expression that was downgraded by RANKL from Day 1 to 3.\nAttenuated the expression of NFATc1, Integrin αV, c-Fos, and CTSK in RANKL-stimulated BMMs.
-
Cell Line:HCT-116, HCT-15, HT29, Colo205 human colorectal cancer cell lines
-
Concentration:0, 1, 2, 4, 6, 8, 10, 15 and 20 μM
-
Incubation Time:48 h
-
Result:Inhibited cell viability in all tested cell lines with IC50 values of 3.90 μM (HCT-116), 4.77 μM (HCT-15), 5.35 μM (HT29), and 14.54 μM (Colo205).
-
Cell Line:HCT-116, HCT-15 human colorectal cancer cells
-
Concentration:4, 8 and 16 μM
-
Incubation Time:8 days
-
Result:Significantly inhibited colony formation in a concentration-dependent manner.
-
Cell Line:HCT-116, HCT-15 human colorectal cancer cells
-
Concentration:4, 8 and 16 μM; 10 μM (EdU)
-
Incubation Time:24 h (roburic acid treatment; 2 h EdU incubation)
-
Result:Markedly suppressed DNA synthesis in both cell lines.
-
Cell Line:HCT-116, HCT-15 human colorectal cancer cells
-
Concentration:4, 8 and 16 μM
-
Incubation Time:24 h
-
Result:Significantly increased the percentage of G0/G1 phase cells and decreased the percentages of S and G2 phase cells in both cell lines in a concentration-dependent manner.
-
Cell Line:HCT-116, HCT-15 human colorectal cancer cells
-
Concentration:4, 8 and 16 μM
-
Incubation Time:24 h (serum-free medium)
-
Result:Led to a significant, concentration-dependent increase in the number of Annexin V-FITC-positive (apoptotic) cells in both cell lines.
-
Cell Line:HCT-116, HCT-15 human colorectal cancer cells
-
Concentration:8 μM; 10 ng/mL (TNF)
-
Incubation Time:4 h (pretreatment; followed by TNF stimulation for indicated times)
-
Result:Inhibited TNF-induced phosphorylation of IKKα/β, IκBα, and p65, degradation of IκBα, and expression of NF-κB-target genes (XIAP, Mcl-1, Survivin, Cyclin D1, c-Myc) in both cell lines.
-
Cell Line:HCT-116, HCT-15 human colorectal cancer cells
-
Concentration:8 μM; 10 ng/mL (TNF)
-
Incubation Time:4 h (pretreatment; 30 min TNF stimulation)
-
Result:Significantly inhibited TNF-induced p65 nuclear translocation in both cell lines.
-
Cell Line:RAW264.7 macrophage cells
-
Concentration:5, 10, 20 and 50 μM
-
Incubation Time:24 h
-
Result:Inhibited less than 20% of cell proliferation at concentrations up to 20 μM; showed greater inhibition at 50 μM relative to untreated cells.
-
Cell Line:LPS-stimulated RAW264.7 macrophage cells
-
Concentration:5, 10 and 20 μM
-
Incubation Time:1 h pre-treatment, followed by 24 h LPS stimulation
-
Result:Suppressed LPS-induced iNOS protein expression in a dose-dependent manner; showed the most significant, statistically significant reduction at 20 μM relative to LPS-only treated cells.
-
Cell Line:LPS-stimulated RAW264.7 macrophage cells
-
Concentration:5, 10 and 20 μM
-
Incubation Time:1 h pre-treatment, followed by 24 h LPS stimulation
-
Result:Attenuated LPS-promoted IL-6 production in a dose-dependent manner; showed the most potent, statistically significant inhibition at 20 μM relative to LPS-only treated cells.
-
Cell Line:LPS-stimulated RAW264.7 macrophage cells
-
Concentration:5, 10 and 20 μM
-
Incubation Time:1 h pre-incubation, followed by 30 min LPS stimulation
-
Result:Increased cytosolic p65 levels and decreased nuclear p65 levels in a dose-dependent manner, indicating inhibition of LPS-induced NF-κB p65 translocation to the nucleus.
-
Cell Line:LPS-stimulated RAW264.7 macrophage cells
-
Concentration:5, 10 and 20 μM
-
Incubation Time:1 h pre-treatment, followed by 15 min LPS stimulation (phosphorylation); 1 h pre-treatment, followed by 30 min LPS stimulation (degradation)
-
Result:Suppressed LPS-induced phosphorylation and degradation of IκBα in a dose-dependent manner; showed the most significant inhibition at 20 μM relative to LPS-only treated cells, with statistical significance.
-
Cell Line:LPS-stimulated RAW264.7 macrophage cells
-
Concentration:5, 10 and 20 μM
-
Incubation Time:1 h pre-treatment, followed by 30 min LPS stimulation
-
Result:Inhibited LPS-induced phosphorylation of IKKα/β in a dose-dependent manner; showed the most potent, statistically significant inhibition at 20 μM relative to LPS-only treated cells.\n
Suppressed LPS-induced phosphorylation of p38 and JNK in a dose-dependent manner; showed the most significant inhibition at 20 μM relative to LPS-only treated cells, with statistical significance.
In Vivo
Roburic acid (10 mg/kg; i.p.; once every 2 days; 7 weeks) alleviates OVX-induced bone loss in mice by improving trabecular bone parameters[2].
Roburic acid (5-10 mg/kg; i.p.; once daily; 18 days) suppresses colorectal cancer tumor growth in xenograft mice by blocking NF-κB signaling, with significant reductions in tumor volume and weight[3].
MedChemExpress (MCE) has not independently confirmed the accuracy of these methods. They are for reference only.
-
Animal Model:Sprague-Dawley (male, 180-220 g, adjuvant-induced arthritis model)[1]
-
Dosage:5 mg/kg
-
Administration:i.v.; on days 17, 20, 23, 26
-
Result:Slightly reduced paw swelling and arthritis score.
Limited reduction in inflammatory cell infiltration and synovial hyperplasia.
Moderated relief of cartilage and bone tissue disappearance; moderate reduction in spleen and thymus indices.
Limited downregulation of IL-1β, IL-6, and TNF-α secretion in ankle joints; moderate reduction in osteoclast number.
Limited increase in ALP expression, moderate lowering of RANKL/OPG ratio; moderate improvement in bone mineral density (BMD), limited reduction in trabecular separation (Tb.Sp), and moderate increase in trabecular bone thickness (Tb.Th).
-
Animal Model:C57BL/6J mice (10-week-old female, ovariectomized)[2]
-
Dosage:10 mg/kg
-
Administration:i.p.; once every 2 days; 7 weeks
-
Result:Significantly increased trabecular bone parameters including bone volume/tissue volume (BV/TV), bone surface/tissue volume (BS/TV), trabecular number (Tb.N), and trabecular pattern factor (Tb.Pf) compared to the OVX group; Reduced bone deterioration observed via representative micro-CT images.
-
Animal Model:BALB/c nude (male, 5 weeks old, subcutaneous colorectal cancer xenograft model)[3]
-
Dosage:5, 10 mg/kg
-
Administration:i.p.; once daily; 18 days
-
Result:Significantly decreased tumor volume and weight of HCT-116 and HCT-15 xenografts.
Inhibited phosphorylation of p65 in tumor tissues.
Promoted cleavage of Caspase3 in tumor tissues; suppressed protein expression of Bcl-xL, XIAP, and Cyclin D1 in tumor tissues. Downregulated expression of p-p65 and Ki-67 in treated tumors; increased level of cleaved Caspase3 in treated tumors.


Chemical Information
-
CAS No. 6812-81-3
-
Appearance Solid
-
Molecular Weight 440.70
-
Formula C30H48O2
-
Color White to off-white
-
SMILES
C[C@](C1=CC2)(CC[C@]3(C)[C@@]1([H])[C@@H](C)[C@H](C)CC3)[C@@](CC[C@H]4C(C)=C)(C)[C@@]2([H])[C@@]4(C)CCC(O)=O
-
Structure Classification
-
Initial Source
-
Shipping
Room temperature in continental US; may vary elsewhere.
-
Storage
4°C, sealed storage, away from moisture and light
* In solvent : -80°C, 6 months; -20°C, 1 month (sealed storage, away from moisture and light)


Publications (1)
-
Journal Impact Factor
-
Most Recent
-
Int J Mol Sci
Cycloastragenol Improves Fatty Acid Metabolism Through NHR-49/FAT-7 Suppression and Potent AAK-2 Activation in Caenorhabditis elegans Obesity Model. [Abstract]2026 Jan 13;27(2):772. PMID: 41596421


Solvent & Solubility
In Vitro:
DMSO : 33.33 mg/mL (75.63 mM; ultrasonic and warming and heat to 60°C; Hygroscopic DMSO has a significant impact on the solubility of product, please use newly opened DMSO)
Please refer to the solubility information to select the appropriate solvent. Once prepared, please aliquot and store the solution to prevent product inactivation from repeated freeze-thaw cycles.
Storage method and period of stock solution: -80°C, 6 months; -20°C, 1 month (sealed storage, away from moisture and light). When stored at -80°C, please use it within 6 months. When stored at -20°C, please use it within 1 month.
Please refer to the solubility information to select the appropriate solvent. Once prepared, please aliquot and store the solution to prevent product inactivation from repeated freeze-thaw cycles.
Storage method and period of stock solution: -80°C, 6 months; -20°C, 1 month (sealed storage, away from moisture and light). When stored at -80°C, please use it within 6 months. When stored at -20°C, please use it within 1 month.
Concentration (start) × Volume (start) = Concentration (final) × Volume (final)
In Vivo:
Select the appropriate dissolution method based on your experimental animal and administration route.
- For the following dissolution methods, please ensure to first prepare a clear stock solution using an In Vitro approach and then sequentially add co-solvents:
- To ensure reliable experimental results, the clarified stock solution can be appropriately stored based on storage conditions. As for the working solution for In Vivo experiments, it is recommended to prepare freshly and use it on the same day.
- The percentages shown for the solvents indicate their volumetric ratio in the final prepared solution. If precipitation or phase separation occurs during preparation, heat and/or sonication can be used to aid dissolution.
In Vivo Dissolution Calculator
Please enter the basic information of animal experiments:
-
-
-
-
Recommended: Prepare an additional quantity of animals to account for potential losses during experiments.
Please enter your animal formula composition:
-
%DMSO +
Recommended: Keep the proportion of DMSO in working solution below 2% if your animal is weak.
-
%+
-
+%Tween-80 + +
-
%Saline +
The co-solvents required include: DMSO, . All of co-solvents are available by MedChemExpress (MCE). , Tween 80. All of co-solvents are available by MedChemExpress (MCE).
Working solution concentration: 0.22 mg/mL
Method for preparing stock solution: mg drug dissolved in μL DMSO. Stock solution concentration: mg/mL. * In solvent : -80°C, 6 months; -20°C, 1 month (sealed storage, away from moisture and light)
1. Take μL DMSO stock solution;
2. Add μL .
μL , mix evenly;
3. Then add μL Tween 80, mix evenly;
4. Then add μL
Please ensure that the stock solution in the first step is dissolved to a clear state, and add co-solvents in sequence. You can use ultrasonic heating (ultrasonic cleaner, recommended frequency 20-40 kHz), vortexing, etc. to assist dissolution.

Protocols
-
Apoptosis
Apoptosis, also called programmed cell death, is generally characterized by distinct morphological characteristics.
-
TUNEL staining for apoptotic DNA fragmentation
TUNEL staining detects DNA strand breaks by using terminal deoxynucleotidyl transferase to add labeled nucleotides to exposed 3′-OH DNA termini, generating either microscopic staining in fixed cells or tissue sections, or fluorescence/cytometric signal in cell suspensions. TUNEL positivity reflects DNA fragmentation but should not be interpreted alone as definitive apoptosis, because TUNEL can also label necrotic, autolytic, mechanically damaged, or DNA-repair-associated DNA breaks.
-
Cell Cytotoxicity Assay
Cytotoxicity assays are usually based on the assessment of cell membrane damage, which can also be indirectly detected by measuring cell viability. Detection methods include MTT assay, CKK-8 assay, LDH assay and ATP assay, etc.
-
Flow cytometric DNA-content cell-cycle staining
Flow cytometric DNA-content cell-cycle staining measures the fluorescence intensity of DNA-bound fluorochromes in single cells or nuclei to estimate DNA content distributions, allowing assignment of populations to G0/G1, S, and G2/M phases by DNA histogram deconvolution. Propidium iodide (PI) intercalates into DNA, and PI fluorescence is proportional to cellular DNA content when staining is performed under conditions that make DNA accessible and minimize non-DNA signal. Cells with G2/M DNA content are expected to show approximately twice the fluorescence intensity of G0/G1 cells, while S-phase cells occupy intermediate fluorescence values. PI-based DNA-content analysis can also detect cells with fractional DNA content, often reported as sub-G1, when DNA fragmentation and extraction during staining reduce retained DNA signal in apoptotic cells. DAPI is an alternative DNA fluorochrome for univariate DNA-content analysis, while bivariate approaches combining DNA content with proliferation
-
Annexin V plus membrane-impermeant dye apoptosis staining
Annexin V-based apoptosis assays rely on the detection of phosphatidylserine (PS) externalization from the inner leaflet of the plasma membrane to the outer leaflet, an early biochemical hallmark of apoptosis. Fluorescently labeled Annexin V binds PS in a calcium-dependent manner, enabling identification of early apoptotic cells by flow cytometry or fluorescence microscopy. When combined with a membrane-impermeant DNA-binding dye (e. g. , propidium iodide), this approach allows discrimination between viable (Annexin V−/dye−), early apoptotic (Annexin V+/dye−), and late apoptotic or necrotic (Annexin V+/dye+) cell populations by assessing membrane integrity and PS exposure.
-
BrdU Incorporation Assay
Bromodeoxyuridine (BrdU) incorporation assay is based on the principle that BrdU, a thymidine analog, is incorporated into newly synthesized DNA during the S phase of the cell cycle, thereby serving as a marker of DNA replication and cellular proliferation. Incorporated BrdU can be detected using anti-BrdU antibodies following DNA denaturation, enabling visualization or quantification of proliferating cells through immunochemical detection methods such as immunofluorescence or immunohistochemistry.
-
Apoptosis Solutions
Apoptosis is a regulated, generally non-lytic cell-death pathway that removes unwanted, damaged, infected, or abnormal cells through coordinated morphological changes, caspase activation, DNA fragmentation, and membrane remodeling. The intrinsic apoptosis pathway is controlled mainly by mitochondrial outer membrane permeabilization, BCL-2 family proteins, cytochrome c release, apoptosome formation, caspase-9 activation, and downstream executioner caspase-3/7 activation. The extrinsic apoptosis pathway is initiated by death receptors such as Fas, TNFR, and TRAIL receptors, which recruit adaptor proteins and activate caspase-8 before engaging executioner caspases or mitochondrial amplification through BID cleavage. Apoptosis is linked to many phenotypes, including cancer cell killing, tissue homeostasis, immune regulation, neurodegeneration, infection response, and treatment-induced cytotoxicity; unresolved questions include how apoptosis interacts with necroptosis, pyroptosis, ferroptos
-
Protocol for Cell Cycle
Cell-cycle analysis by flow cytometry measures DNA content in single cells to estimate the fraction of cells in G0/G1, S, and G2/M phases. Propidium iodide intercalates into DNA, and after RNA removal with RNase, fluorescence intensity reflects cellular DNA content: 2N cells are assigned to G0/G1, cells between 2N and 4N to S phase, and 4N cells to G2/M. DNA-content analysis alone cannot reliably separate G0 from G1 or G2 from M. Ki-67 can distinguish quiescent G0 cells from cycling cells, EdU or BrdU incorporation marks active DNA synthesis in S phase, and phospho-histone H3 staining identifies mitotic cells within the 4N population.
-
Research Protocol for Inflammation-related Diseases
The NLRP3 inflammasome is a cytosolic innate immune signaling platform that integrates priming signals and danger-signal activation to promote caspase-1 activation, maturation of IL-1β and IL-18, and gasdermin D-mediated pyroptotic cell death. The core experimental logic is to determine whether inflammatory disease phenotypes are driven by increased NLRP3 expression, ASC-containing inflammasome assembly, caspase-1 cleavage, GSDMD cleavage, and extracellular release of IL-1β/IL-18 rather than by nonspecific cell injury alone. The pathway is strongly linked to inflammation-related disease phenotypes because monosodium urate crystals activate NALP3/NLRP3 inflammasome signaling in gout-like crystal inflammation, cholesterol crystals activate NLRP3 inflammasomes in atherogenesis models, and DSS-induced intestinal inflammation has been reported to involve NLRP3 inflammasome activity. However, experimental colitis studies also show context-dependent protective effects of NLRP3 inflammasome co
-
Osteoclast differentiation from monocyte/macrophage precursors
Osteoclast differentiation is an in vitro induction assay in which monocyte/macrophage-lineage precursors are exposed to macrophage colony-stimulating factor (M-CSF) and receptor activator of NF-κB ligand (RANKL), generating multinucleated osteoclasts that are commonly identified by tartrate-resistant acid phosphatase (TRAP) staining and functionally confirmed by resorption pits on dentin, bone, or mineralized substrates. M-CSF supports survival and expansion of osteoclast precursors, while RANKL binding to RANK drives osteoclast commitment, fusion, maturation, and resorptive function; osteoprotegerin inhibits this pathway by binding RANKL and preventing RANK activation. The main readouts are the number of TRAP-positive multinucleated cells, formation of F-actin rings, and resorbed surface area; TRAP-positive multinucleated cells indicate osteoclast differentiation, whereas pit formation on dentin, bone, or mineralized coating indicates functional bone-resorbing activity.


Purity & Documentation
-
Data Sheet (302 KB)
-
SDS (252 KB)
- English - EN (252 KB)
- Français - FR (252 KB)
- Deutsch - DE (252 KB)
- Norwegian - NO (252 KB)
- Español - ES (252 KB)
- Swedish - SV (252 KB)
- Italian - IT (252 KB)
- Korean - KR (252 KB)
- Portuguese - PT (252 KB)
-
Handling Instructions (2659 KB)
References
[1]. Jia N, et al. Metabolic reprogramming of proinflammatory macrophages by target delivered roburic acid effectively ameliorates rheumatoid arthritis symptoms. Signal Transduct Target Ther. 2023;8(1):280. Published 2023 Jul 28. [Content Brief]
[2]. Wang G, et al. Roburic acid attenuates osteoclastogenesis and bone resorption by targeting RANKL-induced intracellular signaling pathways. J Cell Physiol. 2022;237(3):1790-1803. [Content Brief]
[3]. Xu H, et al. Roburic Acid Targets TNF to Inhibit the NF-κB Signaling Pathway and Suppress Human Colorectal Cancer Cell Growth. Front Immunol. 2022;13:853165. Published 2022 Feb 9. [Content Brief]
[4].
Cao H, et al. Discovery of cyclooxygenase inhibitors from medicinal plants used to treat inflammation. Pharmacol Res. 2010 Jun;61(6):519-24.
[Content Brief]
[5]. Chen Y, et al. Roburic Acid Suppresses NO and IL-6 Production via Targeting NF-κB and MAPK Pathway in RAW264.7 Cells. Inflammation. 2017;40(6):1959-1966. [Content Brief]


Complete Stock Solution Preparation Table
Please refer to the solubility information to select the appropriate solvent. Once prepared, please aliquot and store the solution to prevent product inactivation from repeated freeze-thaw cycles.
Storage method and period of stock solution: -80°C, 6 months; -20°C, 1 month (sealed storage, away from moisture and light). When stored at -80°C, please use it within 6 months. When stored at -20°C, please use it within 1 month.
| Optional Solvent | Concentration Solvent Mass | 1 mg | 5 mg | 10 mg | 25 mg |
|---|---|---|---|---|---|
| DMSO | 1 mM | 2.2691 mL | 11.3456 mL | 22.6912 mL | 56.7279 mL |
| 5 mM | 0.4538 mL | 2.2691 mL | 4.5382 mL | 11.3456 mL | |
| 10 mM | 0.2269 mL | 1.1346 mL | 2.2691 mL | 5.6728 mL | |
| 15 mM | 0.1513 mL | 0.7564 mL | 1.5127 mL | 3.7819 mL | |
| 20 mM | 0.1135 mL | 0.5673 mL | 1.1346 mL | 2.8364 mL | |
| 25 mM | 0.0908 mL | 0.4538 mL | 0.9076 mL | 2.2691 mL | |
| 30 mM | 0.0756 mL | 0.3782 mL | 0.7564 mL | 1.8909 mL | |
| 40 mM | 0.0567 mL | 0.2836 mL | 0.5673 mL | 1.4182 mL | |
| 50 mM | 0.0454 mL | 0.2269 mL | 0.4538 mL | 1.1346 mL | |
| 60 mM | 0.0378 mL | 0.1891 mL | 0.3782 mL | 0.9455 mL |


Roburic acid Related Classifications
HY-N0481 Related Classifications
 Powered by Bioz