



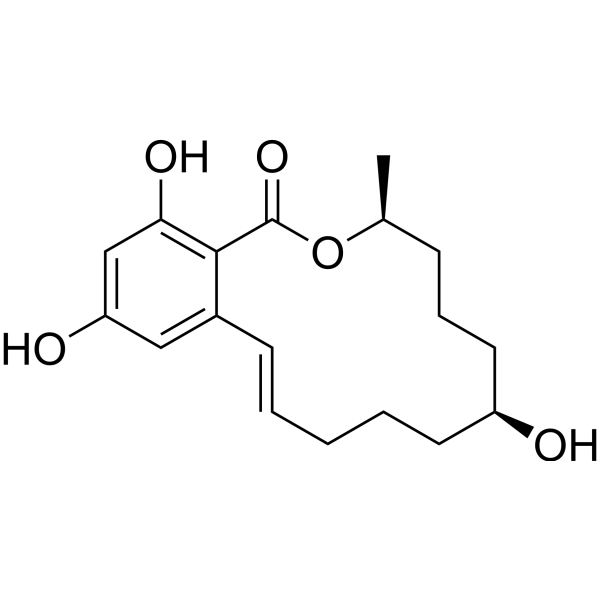
β-Zearalenol

Based on 1 Customer Validation
β-Zearalenol is a zearalenone metabolite and Estrogen receptor binder (Kd = 0.406 nM) that induces apoptosis through activation of p53, JNK, and p38 kinases and the mitochondrial apoptosis pathway, while inhibiting CYP19A1 and inducing autophagy via SIRT1. β-Zearalenol is used in research on cardiotoxicity, mycotoxin-induced reproductive toxicity, and breast cancer.
For research use only. We do not sell to patients.
- Purity : 99.84%
- CAS No.: 71030-11-0
- Formula: C18H24O5
- Molecular Weight:320.38
-
Storage:Powder -20°C, 3 years , 4°C, 2 years ; In solvent -80°C, 6 months , -20°C, 1 month

To place orders, for customer services and technical support, please contact: MedChemExpress USA
Tel: 609-228-6898 E-mail: [email protected] [email protected]


-
 Biological Activity
-
Chemical Information
-
Solvent & Solubility
- Protocols
- Purity & Documentation
- References
-
 Help & FAQs


-
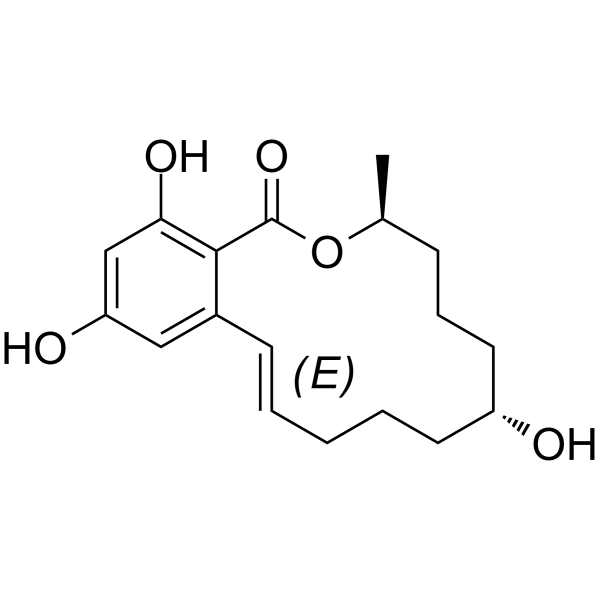
HY-N6710
α-ZearalenolEstrogen Receptor/ERR Inhibitor -
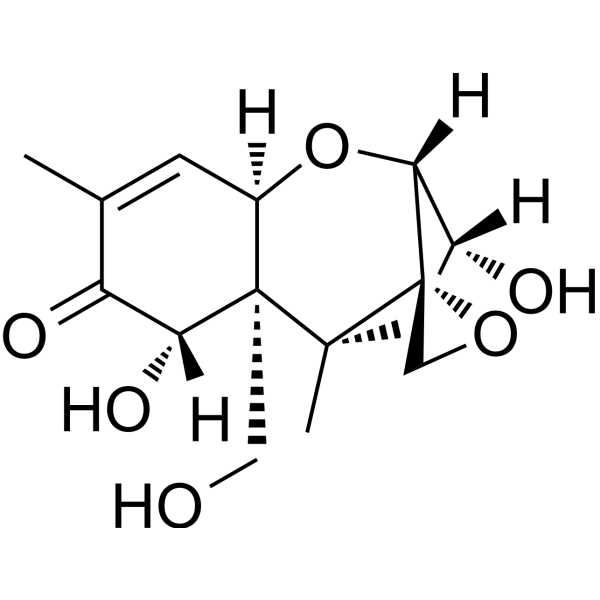
HY-N6684
DeoxynivalenolMycotoxin -
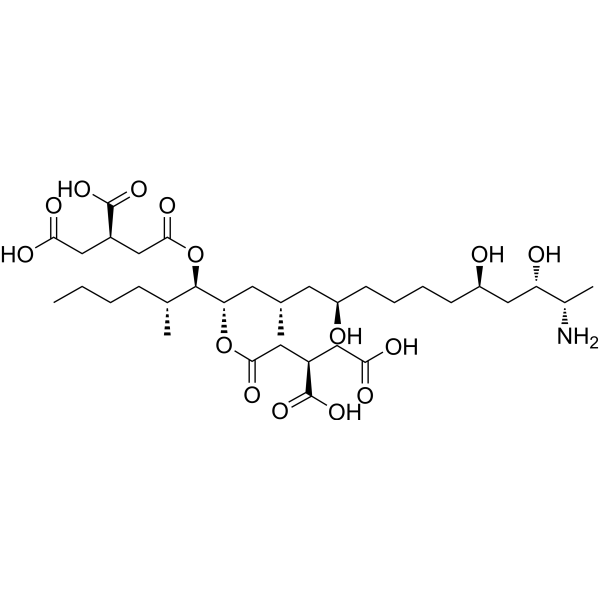
HY-N6719
Fumonisin B1Sphingosine N-acyltransferase Inhibitor -
HY-N2026
PropylparabenBacterial Inhibitor -
HY-N6678
ZearalanoneSerum Albumin Binder -
HY-B0421
Mycophenolic acidIMPDH Inhibitor -
HY-N6741R
β-Zearalenol (Standard)Reference Standard -

HY-B0421R
Mycophenolic acid (Standard)IMPDH Inhibitor -
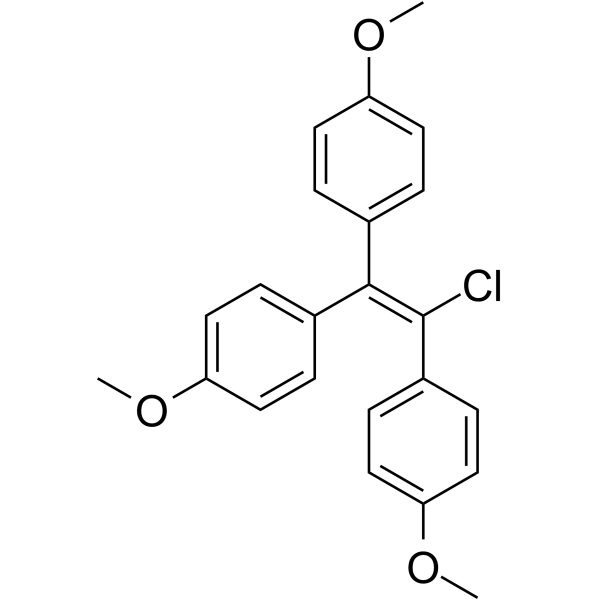
HY-B2158
ChlorotrianiseneEstrogen Receptor Modulator -

HY-N2026R
Propylparaben (Standard)Bacterial Inhibitor -
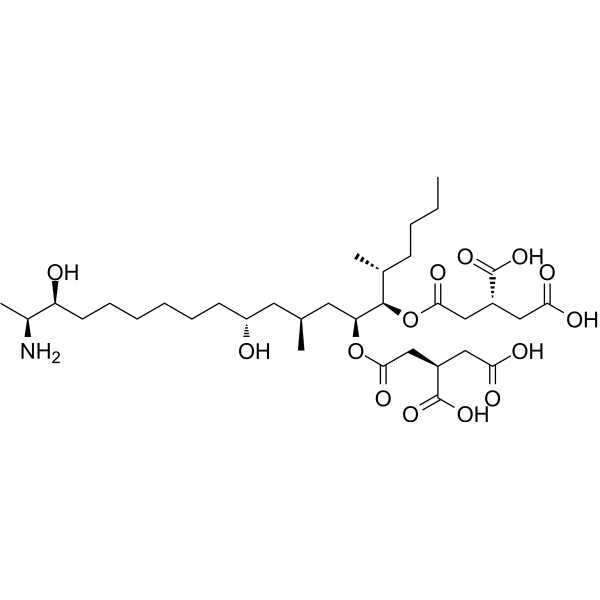
HY-N6726
Fumonisin B3Mycotoxin -

HY-B2158R
Chlorotrianisene (Standard)Estrogen Receptor Modulator


Biological Activity
Description
|
Estrogen receptor 0.406 nM (Kd) |
JNK |
p38 |
CYP19A1 |
SIRT1 |
Cellular Effect
|
Cell Line

|
Type | Value | Description | References |
|---|---|---|---|---|
| H9c2 | LD50 |
80 μM
|
Cytotoxicity against rat embryonic cardiomyoblast H9c2 cells assessed as cell death incubated for 24 hrs by FDA assay using flow cytometry.
Cytotoxicity against rat embryonic cardiomyoblast H9c2 cells assessed as cell death incubated for 24 hrs by FDA assay using flow cytometry.
|
27889531 |
| Vero | IC50 |
50 μM
|
Cytotoxicity against african green monkey Vero cells assessed as reduction in cell viability incubated for 24 hrs by MTT assay.
Cytotoxicity against african green monkey Vero cells assessed as reduction in cell viability incubated for 24 hrs by MTT assay.
|
18755238 |
| Vero | IC50 |
60 μM
|
Inhibition of protein synthesis in african green monkey Vero cells assessed as reduction in [3H] leucine uptake after 24 hrs pre-incubation followed by 2 hrs pulse.
Inhibition of protein synthesis in african green monkey Vero cells assessed as reduction in [3H] leucine uptake after 24 hrs pre-incubation followed by 2 hrs pulse.
|
18755238 |
| Vero | IC50 |
90 μM
|
Inhibition of DNA synthesis in african green monkey Vero cells assessed as reduction in [3H] thymidine uptake after 24 hrs pre-incubation followed by 2 hrs pulse.
Inhibition of DNA synthesis in african green monkey Vero cells assessed as reduction in [3H] thymidine uptake after 24 hrs pre-incubation followed by 2 hrs pulse.
|
18755238 |
| HCT-116 | IC50 |
300 μM
|
Cytotoxicity against human colon carcinoma HCT116 cells assessed as reduction in cell viability incubated for 24 hrs by FDA staining followed by flow cytometry.
Cytotoxicity against human colon carcinoma HCT116 cells assessed as reduction in cell viability incubated for 24 hrs by FDA staining followed by flow cytometry.
|
26584763 |
| Caco-2 | IC50 |
60 μM
|
Inhibitory concentration of 50% of cell viability (IC50) for β-Zol against human Caco-2 colon cancer cells assessed by MTT assay after 48 hrs incubation.
Inhibitory concentration of 50% of cell viability (IC50) for β-Zol against human Caco-2 colon cancer cells assessed by MTT assay after 48 hrs incubation.
|
19705349 |
In Vitro
β-Zearalenol (β-ZOL) (0-50 μM; 24 h) reduces the viability of RAW264.7 macrophages, YD-38, and Detroit 551 cells in a dose-dependent manner[1].
β-Zearalenol (10-50 μM; 24 h) induces apoptosis in RAW264.7 macrophages, manifested as a dose-dependent increase in the sub-G1 cell population[1].
β-Zearalenol (50 μM; 24 h) primarily induces apoptosis, rather than necrosis, in RAW264.7 macrophages[1].
β-Zearalenol (50 μM; 24 h) induces caspase-independent cell death in RAW264.7 macrophages[1].
β-Zearalenol (300 μM; 24 h) induces caspase-3 activation in HCT116 cells[8].
β-Zearalenol (300 μM; 24 h) induces HCT116 cell death mediated by Bax and Bak[8].
β-Zearalenol (30-120 μM; 24 h) activates caspase-3 in human Caco-2 cells[9].
β-Zearalenol (10-50 μM; 12 h) induces a significant loss of mitochondrial membrane potential in RAW264.7 macrophages[1].
β-Zearalenol (10-50 μM; 24 h) induces mitochondrial stress and alters the Bcl-2/Bax signaling pathway in RAW264.7 macrophages, leading to the release of cytochrome c into the cytoplasm[1].
β-Zearalenol (300 μM; 24 h) increases mitochondrial superoxide anion production in HCT116 cells[8].
β-Zearalenol (10-50 μM; 24 h) induces nuclear translocation of AIF in RAW264.7 macrophages[1].
β-Zearalenol (10-50 μM; 3 h) activates JNK but not p38 MAPK in RAW264.7 macrophages[1].
β-Zearalenol (20-100 μM; 24 h) is cytotoxic to H9c2 cells, with an LD50 of 80 μM after 24 h of treatment[2].
β-Zearalenol (5-200 μM) inhibits the proliferation of primary bovine ovarian granulosa cells in a dose-dependent manner, with an IC50 of 25 μM[3].
β-Zearalenol (β-Zol) (0-130 μM; 24 h) reduces Vero cell viability in a dose-dependent manner, with an IC50 of approximately 50 μM[4].
β-Zearalenol (37-150 μM; 24 h) inhibits DNA synthesis in Vero cells with an IC50 of 90 μM, exhibiting a non-linear dose-response between 37 and 75 μM[4].
β-Zearalenol (10% loss of cell viability-50% loss of cell viability; 24 h) induces Hsp 27 and Hsp 70 expression in Vero cells in a concentration-dependent manner[4].
β-Zearalenol (β-ZEL) (0-10 μmol/L) forms stable complexes with HSA, BSA, PSA, and RSA, with the highest affinity for RSA (logK = 5.43) and the lowest affinity for PSA (logK = 4.05), exhibiting significant species-dependent binding[5].
β-Zearalenol (0-10 μmol/L) reduces the total fluorescence intensity of Warfarin (HY-B0687) in a concentration-dependent manner, supporting the hypothesis that its binding site or location on HSA differs from that of ZEN and α-ZEL[5].
β-Zearalenol (7.5-30 μM; 48 h) reduces the viability of primary cultured porcine endometrial cells in a dose-dependent manner, with significant cytotoxicity observed at 30 μM[6].
β-Zearalenol (30 μM; 48 h) induces necrotic ultrastructural changes in primary cultured porcine endometrial cells[6].
β-Zearalenol (7.5-30 μM; 24-48 h) significantly decreases the expression of the proliferation marker PCNA in primary cultured porcine endometrial cells in a time- and dose-dependent manner[6].
β-Zearalenol (1 nM-1 μM; 1 h) binds to porcine uterine cytosolic estrogen receptors[6].
β-Zearalenol (1-100 μM; 24 h) inhibits E2 secretion in human BeWo cells at concentrations of 1 μM and above[7].
β-Zearalenol (300 μM; 24 h) promotes a significant decrease in Δψm in HCT116 cells and does not induce necrosis in HCT116 cells[8].
β-Zearalenol (0-100 μM; 48 h) reduces the viability of human Caco-2 cells with an IC50 of approximately 60 μM[9].
β-Zearalenol (30-120 μM; 24 h) induces DNA damage and fragmentation in human Caco-2 cells[9].
β-Zearalenol (60 μM; 24 h) induces PARP cleavage in human Caco-2 cells[9].
β-Zearalenol (50 μM) induces intracellular ROS generation in RAW264.7 macrophages[1].
β-Zearalenol (50 μM) increases cellular ROS levels, whereas catalase and superoxide dismutase both decrease ROS levels in RAW264.7 macrophages[1].
β-Zearalenol (80 μM; 6-24 h) induces oxidative stress in H9c2 cardiomyocytes by generating intracellular and mitochondrial ROS[2].
β-Zearalenol (IC50/4-IC50; 24 h) induces lipid peroxidation in Vero cells in a concentration-dependent manner, increasing MDA levels to 18 times those of the control group[4].
β-Zearalenol (300 μM; 24 h) induces oxidative stress by increasing ROS generation in HCT116 cells[8].
β-Zearalenol (80 μM; 24 h) does not induce significant necrosis after 24 h treatment in H9c2 cells, induces loss of mitochondrial membrane potential, induces caspase-3 activation, and increases BAX protein expression in H9c2 cells[2].
β-Zearalenol (80 μM; 6-24 h) induces autophagy in H9c2 cardiomyocytes, with increased LC3-II and Beclin-1 levels observed at 6 h but not at 24 h[2].
β-Zearalenol (37-150 μM; 24 h) inhibits protein synthesis in Vero cells with an IC50 of approximately 60 μM and an inhibition rate of nearly 80% at 150 μM[4].
β-Zearalenol (60 μM; 24 h) decreases Bcl-2 protein levels in human Caco-2 cells[9].
β-Zearalenol (7.5-30 μM; 24-48 h) inhibits the proliferation of primary cultured porcine endometrial cells by reducing the S phase cell population and arresting cells in the G0/G1 phase of the cell cycle[6].
β-Zearalenol (100-400 μM; 24 h) reduces HCT116 cell viability with an IC50 of approximately 300 μM[8].
β-Zearalenol (6.25-25 µM; 144 h) exhibits estrogenic activity in MCF-7 cells, with a maximum relative proliferative effect of 87.70% at 12.5 µM, classifying it as a partial agonist at low concentrations and a full agonist at 12.5 µM[10].
β-Zearalenol (30-120 μM; 24 h) induces lipid peroxidation in human Caco-2 cells in a concentration-dependent manner[9].
MedChemExpress (MCE) has not independently confirmed the accuracy of these methods. They are for reference only.
-
Cell Line:RAW264.7 macrophages
-
Concentration:10, 25, 50 μM
-
Incubation Time:24 h
-
Result:Decreased the viability of RAW264.7 cells in a dose-dependent manner.
-
Cell Line:RAW264.7 macrophages
-
Concentration:10, 25, 50 μM
-
Incubation Time:24 h
-
Result:Increased the percentage of cells in the sub-G1 phase to 32.7%, 60.8%, and 70.2% after treatment with 10, 25, and 50 μM, respectively, compared to the untreated control (11.6%).
-
Cell Line:YD-38 human oral epithelial cancer cells and Detroit 551 human skin fibroblasts
-
Concentration:10, 25, 50 μM
-
Incubation Time:24 h
-
Result:Inhibited the viability of YD-38 and Detroit 551 cells.
-
Cell Line:RAW264.7 macrophages
-
Concentration:50 μM
-
Incubation Time:24 h
-
Result:Increased early apoptotic cells up to 58.9% and late apoptotic cells to 5.82% compared to untreated control cells (2.47%).
Did not increase necrotic cells.
-
Cell Line:RAW264.7 macrophages
-
Concentration:10, 25, 50 μM
-
Incubation Time:24 h
-
Result:Decreased the protein level of anti-apoptotic Bcl-2 and increased the level of pro-apoptotic Bax in the mitochondria.
Decreased the cytoplasmic Bax level in a dose-dependent manner.
Released cytochrome c from the mitochondria into the cytosol.\nTranslocated AIF to the cytoplasm from the mitochondria and then to the nucleus in a dose-dependent manner.
-
Cell Line:RAW264.7 macrophages
-
Concentration:50 μM
-
Incubation Time:24 h
-
Result:Neither pretreatment with z-VAD-fmk nor z-IETD-fmk inhibited the β-ZOL-induced reduction of cell viability.\nSignificantly suppressed β-ZOL-induced reduction of cell viability in AIF-specific siRNA transfected cells.\nThe JNK inhibitor (10 μM) or p53 inhibitor (10 μM), but not p38 MAPK or ERK inhibitor at the same dose, significantly attenuated the β-ZOL-mediated decrease in cell viability.
-
Cell Line:RAW264.7 macrophages
-
Concentration:10, 25, 50 μM
-
Incubation Time:3 h
-
Result:Increased only p-JNK levels in a dose-dependent manner.
-
Cell Line:RAW264.7 macrophages
-
Concentration:50 μM
-
Incubation Time:3 h
-
Result:Significantly elevated the level of p-JNK.
Also increased p-ERK levels in the cells.
-
Cell Line:H9c2 rat embryonic cardiomyoblasts
-
Concentration:20, 100 μM
-
Incubation Time:24 h
-
Result:Induced a marked increase in cell death in a dose-dependent manner with an LD50 value of 80 μM after 24 h.
-
Cell Line:H9c2 cells
-
Concentration:80 μM
-
Incubation Time:24 h
-
Result:Resulted in a very low percentage of PI-positive cells (less than 10%).
-
Cell Line:H9c2 cells
-
Concentration:80 μM
-
Incubation Time:24 h
-
Result:The percentage of cells with active caspase-3 (NucView 488 positive cells) was augmented in response to β-ZOL, indicating that caspases are activated.
-
Cell Line:H9c2 cells
-
Concentration:80 μM
-
Incubation Time:24 h
-
Result:An increase in the expression of the pro-apoptotic protein BAX was noticed following treatment with β-ZOL.
-
Cell Line:H9c2 cells
-
Concentration:80 μM
-
Incubation Time:6, 24 h
-
Result:Increased the level of LC3-II and Beclin-1 after 6 h of exposure but not after 24 h.
-
Cell Line:Primary bovine ovarian granulosa cells (BGCs)
-
Concentration:25 μM
-
Incubation Time:24 h
-
Result:The reduction in cell proliferation of BGCs induced by 25 μM β-zol was measured with different concentrations of melatonin pretreatment.
The proliferation of BGCs pretreated with 100 μM melatonin was significantly higher than those treated with β-zol alone.
-
Cell Line:Primary bovine ovarian granulosa cells (BGCs)
-
Concentration:25 μM
-
Incubation Time:30-60 min (DCFH-DA); 15 min (Hoechst 33342)
-
Result:Treatment of BGCs with β-zol resulted in a significant increase in ROS-positive cells compared to controls.
Toxin-treated BGCs pretreated with melatonin had a significantly lower incidence of ROS.
-
Cell Line:Vero cells
-
Concentration:10, 40, 60, 80, 100, 120 μM
-
Incubation Time:24 h
-
Result:Decreased cell viability in a dose-dependent manner with an IC50 of approximately 50 μM.
-
Cell Line:Primary cultured porcine endometrial cells
-
Concentration:7.5, 15, 30 μM
-
Incubation Time:48 h
-
Result:Decreased the number of viable endometrial cells in a dose-dependent manner.
Decreased viable cells to 62.7% at 30 μM after 48-h treatment compared to the unexposed control.
-
Cell Line:Primary cultured porcine endometrial cells
-
Concentration:7.5, 15, 30 μM
-
Incubation Time:24 h; 48 h
-
Result:Increased the frequency of cells in the G0/G1 phase at 15 μM (68.7%) and 30 μM (69.9%) compared to the control (46.1%) after 24 h treatment.
Decreased the S- and G2/M phases after 24 h treatment.
Induced significant G1 arrest at 7.5 μM after 48 h exposure.
Decreased S-phase cells by 37.1% at 7.5 μM, 72.1% at 15 μM, and 68.8% at 30 μM compared to the control after 48 h exposure.
-
Cell Line:HCT116
-
Concentration:100, 200, 300, 400 μM
-
Incubation Time:24 h
-
Result:Decreased cell viability in a concentration-dependent manner with an IC50 of approximately 300 μM.
-
Cell Line:HCT116
-
Concentration:300 μM
-
Incubation Time:24 h
-
Result:Increased percentage of DiOC6(3) low cells, demonstrating a significant decrease in Δψm.\nKept the percentage of PI-positive cells very low (less than 20%).\nIncreased ROS > 5-fold of control values.\nIncreased mitochondrial superoxide anion levels from 3.2% in control to 54.3%.
-
Cell Line:HCT116
-
Concentration:300 μM
-
Incubation Time:24 h
-
Result:Increased the percentage of NucView 488 positive cells.
-
Cell Line:HCT116
-
Concentration:300 μM
-
Incubation Time:24 h
-
Result:Decreased ROS level with an inhibition percentage of about 65%.\nReduced cell death induced by β-ZOL.\nReduced Δψm loss induced by β-ZOL.
-
Cell Line:HCT116
-
Concentration:300 μM
-
Incubation Time:24 h
-
Result:Reduced caspase-3 activation induced by β-ZOL.
-
Cell Line:Caco-2
-
Concentration:10, 20, 30, 40, 60, 80, 100 μM
-
Incubation Time:48 h
-
Result:Induced a dose-dependent decrease in cell viability with an IC50 of about 60 μM.
-
Cell Line:Caco-2
-
Concentration:30, 60, 120 μM
-
Incubation Time:24 h
-
Result:Increased MDA production in a concentration-dependent manner from 1.42 μM in control cells to 3.14 μM, 13.14 μM, and 20.00 μM at concentrations corresponding to IC50/2, IC50, and 2×IC50, respectively.
-
Cell Line:Caco-2
-
Concentration:30, 60, 120 μM
-
Incubation Time:24 h
-
Result:Induced a dose-dependent increase in caspase-3 activity from 4.10 pmol pNA/(h μg of protein) in control cells to 6.68, 10.00, and 16.00 at concentrations corresponding to IC50/2, IC50, and 2×IC50, respectively.
-
Cell Line:Caco-2
-
Concentration:60 μM
-
Incubation Time:24 h
-
Result:Caused the cleavage of 116-kDa PARP into 85-kDa fragments, represented as an increase in the level of 85-kDa fragments.\nDecreased Bcl-2 protein levels from 100% in control cells to 76%.
-
Cell Line:MCF-7
-
Concentration:6.25, 9.37, 12.5, 18.75, 25 µM
-
Incubation Time:144 h
-
Result:Induced a proliferative effect (PE) with values ranging from 1.11 to 1.32.
Achieved a relative proliferative effect (RPE) of 46.08% at 6.25 µM, 68.96% at 9.37 µM, 87.70% at 12.5 µM, 77.22% at 18.75 µM, and 31.52% at 25 µM.
Exhibited maximum PE and RPE at 12.5 µM.
Classified as a partial agonist at 6.25 and 9.37 µM and a total agonist at 12.5 µM based on RPE.
- Reproductive and Developmental Toxicity Study
- Detection of Apoptosis
- TUNEL staining for apoptotic DNA fragmentation
- Annexin V plus membrane-impermeant dye apoptosis staining
- Research Protocol for Endocrine Diseases
- Autophagy
- Apoptosis Solutions
- Lysosome and acidic-vesicle live-cell staining
- Macroautophagy Solutions
- Breast Cancer Modeling


Chemical Information
-
CAS No. 71030-11-0
-
Appearance Solid
-
Molecular Weight 320.38
-
Formula C18H24O5
-
Color White to off-white
-
SMILES
OC1=C2C(O[C@H](CCC[C@H](CCC/C=C/C2=CC(O)=C1)O)C)=O
-
Structure Classification
-
Initial Source
Fusarium
-
Shipping
Room temperature in continental US; may vary elsewhere.
-
Storage
Powder -20°C 3 years 4°C 2 years In solvent -80°C 6 months -20°C 1 month


Solvent & Solubility
In Vitro:
DMSO : ≥ 100 mg/mL (312.13 mM; Hygroscopic DMSO has a significant impact on the solubility of product, please use newly opened DMSO)
* "≥" means soluble, but saturation unknown.
Please refer to the solubility information to select the appropriate solvent. Once prepared, please aliquot and store the solution to prevent product inactivation from repeated freeze-thaw cycles.
Storage method and period of stock solution: -80°C, 6 months; -20°C, 1 month. When stored at -80°C, please use it within 6 months. When stored at -20°C, please use it within 1 month.
Please refer to the solubility information to select the appropriate solvent. Once prepared, please aliquot and store the solution to prevent product inactivation from repeated freeze-thaw cycles.
Storage method and period of stock solution: -80°C, 6 months; -20°C, 1 month. When stored at -80°C, please use it within 6 months. When stored at -20°C, please use it within 1 month.
Concentration (start) × Volume (start) = Concentration (final) × Volume (final)
In Vivo:
Select the appropriate dissolution method based on your experimental animal and administration route.
- For the following dissolution methods, please ensure to first prepare a clear stock solution using an In Vitro approach and then sequentially add co-solvents:
- To ensure reliable experimental results, the clarified stock solution can be appropriately stored based on storage conditions. As for the working solution for In Vivo experiments, it is recommended to prepare freshly and use it on the same day.
- The percentages shown for the solvents indicate their volumetric ratio in the final prepared solution. If precipitation or phase separation occurs during preparation, heat and/or sonication can be used to aid dissolution.
Add each solvent one by one: 10% DMSO 40% PEG300 5% Tween-80 45% Saline
Solubility: ≥ 2.5 mg/mL (7.80 mM); Clear solution
This protocol yields a clear solution of ≥ 2.5 mg/mL (saturation unknown).
Taking 1 mL working solution as an example, add 100 μL DMSO stock solution (25.0 mg/mL) to 400 μL PEG300, and mix evenly; then add 50 μL Tween-80 and mix evenly; then add 450 μL Saline to adjust the volume to 1 mL.
Preparation of Saline: Dissolve 0.9 g sodium chloride in ddH₂O and dilute to 100 mL to obtain a clear Saline solution.
Add each solvent one by one: 10% DMSO 90% (20% SBE-β-CD in Saline)
Solubility: ≥ 2.5 mg/mL (7.80 mM); Clear solution
This protocol yields a clear solution of ≥ 2.5 mg/mL (saturation unknown).
Taking 1 mL working solution as an example, add 100 μL DMSO stock solution (25.0 mg/mL) to 900 μL 20% SBE-β-CD in Saline, and mix evenly.
Preparation of 20% SBE-β-CD in Saline (4°C, storage for one week): 2 g SBE-β-CD powder is dissolved in 10 mL Saline, completely dissolve until clear.
In Vivo Dissolution Calculator
Please enter the basic information of animal experiments:
-
-
-
-
Recommended: Prepare an additional quantity of animals to account for potential losses during experiments.
Please enter your animal formula composition:
-
%DMSO +
Recommended: Keep the proportion of DMSO in working solution below 2% if your animal is weak.
-
%+
-
+%Tween-80 + +
-
%Saline +
The co-solvents required include: DMSO, . All of co-solvents are available by MedChemExpress (MCE). , Tween 80. All of co-solvents are available by MedChemExpress (MCE).
Working solution concentration: 0.22 mg/mL
Method for preparing stock solution: mg drug dissolved in μL DMSO. Stock solution concentration: mg/mL.
1. Take μL DMSO stock solution;
2. Add μL .
μL , mix evenly;
3. Then add μL Tween 80, mix evenly;
4. Then add μL
Please ensure that the stock solution in the first step is dissolved to a clear state, and add co-solvents in sequence. You can use ultrasonic heating (ultrasonic cleaner, recommended frequency 20-40 kHz), vortexing, etc. to assist dissolution.


Purity & Documentation
-
Data Sheet (318 KB)
-
SDS (641 KB)
- English - EN (641 KB)
- Français - FR (641 KB)
- Deutsch - DE (641 KB)
- Norwegian - NO (641 KB)
- Español - ES (641 KB)
- Swedish - SV (641 KB)
- Italian - IT (641 KB)
- Korean - KR (641 KB)
- Portuguese - PT (641 KB)
-
Handling Instructions (2659 KB)
References
[3]. Yang F, et al. Melatonin alleviates β-zearalenol and HT-2 toxin-induced apoptosis and oxidative stress in bovine ovarian granulosa cells. Environmental toxicology and pharmacology. 2019 May;68:52-60. [Content Brief]
[10]. Tatay E, et al. Estrogenic activity of zearalenone, α-zearalenol and β-zearalenol assessed using the E-screen assay in MCF-7 cells. Toxicology mechanisms and methods. 2018 May;28(4):239-242. [Content Brief]


Complete Stock Solution Preparation Table
Please refer to the solubility information to select the appropriate solvent. Once prepared, please aliquot and store the solution to prevent product inactivation from repeated freeze-thaw cycles.
Storage method and period of stock solution: -80°C, 6 months; -20°C, 1 month. When stored at -80°C, please use it within 6 months. When stored at -20°C, please use it within 1 month.
| Optional Solvent | Concentration Solvent Mass | 1 mg | 5 mg | 10 mg | 25 mg |
|---|---|---|---|---|---|
| DMSO | 1 mM | 3.1213 mL | 15.6065 mL | 31.2129 mL | 78.0323 mL |
| 5 mM | 0.6243 mL | 3.1213 mL | 6.2426 mL | 15.6065 mL | |
| 10 mM | 0.3121 mL | 1.5606 mL | 3.1213 mL | 7.8032 mL | |
| 15 mM | 0.2081 mL | 1.0404 mL | 2.0809 mL | 5.2022 mL | |
| 20 mM | 0.1561 mL | 0.7803 mL | 1.5606 mL | 3.9016 mL | |
| 25 mM | 0.1249 mL | 0.6243 mL | 1.2485 mL | 3.1213 mL | |
| 30 mM | 0.1040 mL | 0.5202 mL | 1.0404 mL | 2.6011 mL | |
| 40 mM | 0.0780 mL | 0.3902 mL | 0.7803 mL | 1.9508 mL | |
| 50 mM | 0.0624 mL | 0.3121 mL | 0.6243 mL | 1.5606 mL | |
| 60 mM | 0.0520 mL | 0.2601 mL | 0.5202 mL | 1.3005 mL | |
| 80 mM | 0.0390 mL | 0.1951 mL | 0.3902 mL | 0.9754 mL | |
| 100 mM | 0.0312 mL | 0.1561 mL | 0.3121 mL | 0.7803 mL |


β-Zearalenol Related Classifications
HY-N6741 Related Classifications
 Powered by Bioz
Keywords
- β-Zearalenol
- 71030-11-0
- Drug Metabolite
- Estrogen Receptor/ERR
- MDM-2/p53
- JNK
- p38 MAPK
- Apoptosis
- Cytochrome P450
- Sirtuin
- Autophagy
- RAW264.7 macrophages
- human BeWo cells
- primary bovine ovarian granulosa cells
- Vero cells
- porcine endometrial cells
- human Caco-2 cells
- MCF-7 cells
- H9c2 cells
- HCT116 cells
- human CYP19A1
- Inhibitor
- inhibitor
- inhibit