



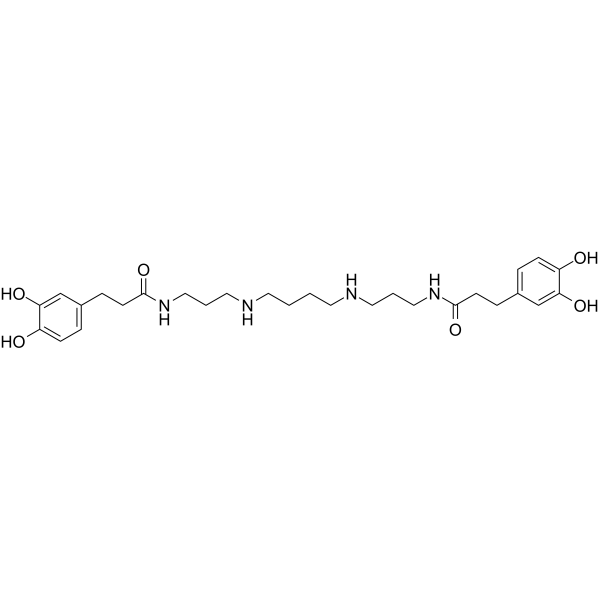
Kukoamine A
Based on 1 publication(s) in Google Scholar
Kukoamine A, a spermine alkaloid, is an orally active and brain-penetrant component found in the root barks of Lycium chinense (L. chinense) Miller. Kukoamine A inhibits purified Crithidia fasciculata trypanothione reductase and soybean lipoxygenase, activates μ-opioid receptor. Kukoamine A can inhibt cancer cell proliferation, migration and invasion, cause G0/G1 phase cell cycle arrest and induce apoptosis. Kukoamine A exerts neuroprotective effect and can induce autophagy . Kukoamine A inhibits LPS (HY-D1056)-induced NO, ROS, PGE2, TNF-α, IL-1β, IL-6 production and COX-2 activity. Kukoamine A reverses palmitic acid-induced insulin resistance, lipid accumulation, and oxidative stress via downregulation of Srebp-1c. Kukoamine A can be used for the research of cancer, infection, inflammation, metabolic and neurological disease, such as glioblastoma and Parkinson's disease.
For research use only. We do not sell to patients.
- Purity : 99.84%
- CAS No.: 75288-96-9
- Formula: C28H42N4O6
- Molecular Weight:530.66
-
Storage:Powder -20°C, 3 years ; In solvent -80°C, 6 months , -20°C, 1 month

To place orders, for customer services and technical support, please contact: MedChemExpress USA
Tel: 609-228-6898 E-mail: [email protected] [email protected]


-
 Biological Activity
-
Chemical Information
-
Solvent & Solubility
- Protocols
- Purity & Documentation
- References
-
 Help & FAQs




Publications Citing Use of MedChemExpress (MCE) Kukoamine A
MoreAll Parasite Isoforms
MoreAll Opioid Receptor Isoforms
More

Biological Activity
Description
IC50 & Target
[1]|
μ Opioid Receptor/MOR |
IL-1β |
IL-6 |
COX-2 |
In Vitro
Kukoamine A (1-10 μM; ~0.5-2.0 times its estimated Ki) potently inhibits purified Crithidia fasciculata trypanothione reductase as a mixed inhibitor with a Ki of 1.8 μM and Kii of 13 μM for enzyme-substrate complex, while displaying no significant inhibition of human glutathione reductase[1].
Kukoamine A (0.1 mM; 20-60 min) shows high DPPH free radical scavenging activity, with 96% reducing activity at 0.1 mM after 20 min and 60 min incubation in a cell-free system[2].
Kukoamine A potently inhibits cell-free soybean lipoxygenase, with an IC50 of 9.5 μM[2].
Kukoamine A (0.1 mM) inhibits AAPH-induced linoleic acid lipid peroxidation by 72% at 0.1 mM[2].
Kukoamine A reverses palmitic acid-induced insulin resistance, lipid accumulation, and oxidative stress in AML-12 cells via downregulation of Srebp-1c, as these protective effects are abrogated by Srebp-1c overexpression[3].
Kukoamine A (10-80 μg/mL; 1-5 days) selectively inhibits the viability of human glioblastoma U251 and WJ1 cells in a time- and dose-dependent manner, with IC50 values of 73.4 μg/mL and 22.1 μg/mL respectively at day 5, and has minimal effect on human normal liver LO2 cells and rat glioma C6 cells[4].
Kukoamine A (5-20 μg/mL; 12 days) inhibits the clonogenicity of human glioblastoma U251 and WJ1 cells in a dose-dependent manner[4].
Kukoamine A (10-80 μg/mL; 48 h) induces apoptosis in human glioblastoma U251 and WJ1 cells in a dose-dependent manner, downregulating 5-LOX and antiapoptotic Bcl-2 protein expression, and upregulating proapoptotic Bax and active caspase-3 protein expression[4].
Kukoamine A (5-20 μg/ml; 48 h) induces G0/G1 phase cell cycle arrest in human glioblastoma U251 and WJ1 cells in a dose-dependent manner[4].
Kukoamine A (10-80 μg/mL;24 h) inhibits the migration and invasion of human glioblastoma U251 and WJ1 cells in a dose-dependent manner[4].
Kukoamine A (10-40 μM; 4 h pre-incubation, followed by 24 h co-incubation with MPP+) dose-dependently protects SH-SY5Y cells from MPP+-induced injury, inhibits apoptosis and preserves mitochondrial membrane potential[5].
Kukoamine A (10-40 μM; 4 h pre-incubation, followed by 24 h co-incubation with MPP+) dose-dependently reduces Bax/Bcl-2 ratio, p-JNK and p-p38 levles and increases p-AKT, p-ERK levels in SH-SY5Y cells[5].
Kukoamine A (10-40 μM; 4 h) dose-dependently induces autophagy in SH-SY5Y cells, inducing visible autophagosomes at the highest concentration, increasing the LC3-II/LC3-I ratio, Beclin-1 and decreasing p62 [5].
Kukoamine A binds to human μ-opioid receptors expressed in HEK293T cell membranes with high affinity, with a Ki value of 1.3 ± 0.18 μM and an EC50 value of 5.6 ± 0.65 μM[6].
Kukoamine A (5-40 μM; 24 h) does not reduce the viability of RAW 264.7 macrophage cells[7].
Kukoamine A (5-40 μM; 24 h) significantly inhibits LPS (HY-D1056)-induced NO, ROS, PGE2, TNF-α, IL-1β, and IL-6 production in RAW 264.7 macrophage cells in a concentration-dependent manner[7].
Kukoamine A (5-40 μM) significantly inhibits LPS-induced COX-2 activity in RAW 264.7 macrophage cells[7].
MedChemExpress (MCE) has not independently confirmed the accuracy of these methods. They are for reference only. Further protocols information, click here.
-
Cell Line:human glioblastoma U251 cells, human glioblastoma WJ1 cells
-
Concentration:40, 60, 80 μg/ml (U251 cells); 10, 20, 30 μg/ml (WJ1 cells)
-
Incubation Time:48 h
-
Result:
Induced a significant, dose-dependent increase in both early and late apoptotic cells, as well as total apoptotic cells, in both U251 and WJ1 cells compared to untreated controls.
-
Cell Line:human glioblastoma U251 cells, human glioblastoma WJ1 cells
-
Concentration:5, 10, 20 μg/ml
-
Incubation Time:48 h
-
Result:Caused a significant, dose-dependent increase in the cell population in the G0/G1 phase in both U251 and WJ1 cells compared to untreated controls.
Caused a corresponding significant, dose-dependent decrease in the cell population in the S phase in both U251 and WJ1 cells compared to untreated controls.
-
Cell Line:human glioblastoma U251 cells, human glioblastoma WJ1 cells
-
Concentration:40, 60, 80 μg/ml (U251 cells); 10, 20, 30 μg/ml (WJ1 cells)
-
Incubation Time:48 h
-
Result:Caused a dose-dependent decrease in 5-LOX and Bcl-2 protein expression in U251 and WJ1 cells.
Caused a dose-dependent increase in Bax and active caspase-3 protein expression in U251 and WJ1 cells.
Caused a dose-dependent decrease in C/EBPβ, N-cadherin, vimentin, twist, and snail+slug protein expression in U251 and WJ1 cells.
Caused a dose-dependent increase in E-cadherin protein expression in U251 and WJ1 cells.
-
Cell Line:MPP⁺-treated SH-SY5Y human neuroblastoma cells
-
Concentration:10 μM, 20 μM, 40 μM
-
Incubation Time:4 h pre-incubation, followed by 24 h co-incubation with MPP⁺
-
Result:Decreased the Bax/Bcl-2 ratio to 3.77 ± 0.36, 2.22 ± 0.17, and 0.68 ± 0.31 at 10, 20, and 40 μM, respectively.
Increased p-AKT levels to 2.05 ± 0.07.
Increased p-ERK levels to 3.31 ± 0.14.
Decreased p-JNK levels to 0.57 ± 0.02.
Decreased p-p38 levels to 0.21 ± 0.06 compared to MPP⁺-treated cells.
-
Cell Line:LPS-stimulated RAW 264.7 macrophage cells
-
Concentration:5, 10, 20, 40 μM
-
Incubation Time:12 h (pretreatment); 12 h (LPS stimulation)
-
Result:Significantly attenuated LPS-induced increases in TNF-α, IL-1β, and IL-6 levels in a concentration-dependent manner, with all tested concentrations showing statistically significant inhibition relative to LPS-only treated cells.
Significantly reduced LPS-induced PGE2 levels, with all tested concentrations showing statistically significant inhibition relative to LPS-only treated cells.
Markedly inhibited LPS-induced COX-2 activity.
In Vivo
Kukoamine A (5-20 mg/kg; i.p.; daily; 4 weeks) dose-dependently attenuates high fat diet-induced insulin resistance, fatty liver, inflammation, and oxidative stress in mice by inhibiting Srebp-1c and its downstream target gene expression[3].
Kukoamine A (10-40 mg/kg; i.p.; 5 times weekly; 4 weeks) inhibits in vivo glioblastoma growth in a dose-dependent manner, achieving up to 55.3% tumor inhibition at 40 mg/kg, while maintaining mouse body weight, via apoptosis induction and epithelial-mesenchymal transition attenuation mediated by downregulating 5-LOX and C/EBPβ expression[4].
Kukoamine A (5-20 mg/kg; i.g.; daily; 12 days) exerts dose-dependent neuroprotective effects in MPTP (HY-W114750)-induced Parkinson's disease mice by improving motor function, reducing neuronal apoptosis, lowering α-synuclein levels, preserving dopaminergic neurons, and enhancing autophagy, without affecting MAO-B activity[5].
Kukoamine A (5-20 mg/kg; i.g.; daily; 12 days) enhances autophagy in the SN and Str of healthy mice by regulating autophagy-related proteins, without inducing apoptosis or altering MAO-B activity[5].
Kukoamine A (25-50 mg/kg; p.o.; daily; 5 days) exerts Concentration-dependent anti-inflammatory and antioxidant effects in rats with carrageenan-induced acute inflammation, reducing paw edema, proinflammatory cytokine levels, and oxidative stress markers while enhancing liver antioxidant enzyme activity[7].
MedChemExpress (MCE) has not independently confirmed the accuracy of these methods. They are for reference only.
-
Animal Model:Carrageenan-induced edema Fischer-344 rats (male and female, 150-200 g, non-pregnant females; 6-15 animals per group)[2]
-
Dosage:0.01 mmol/kg
-
Administration:I.p.; single dose
-
Result:Inhibited carrageenan-induced rat paw edema by 43%.
-
Animal Model:C57 (6-8 weeks old; high fat diet-induced model)[3]
-
Dosage:5 mg/kg; 10 mg/kg; 20 mg/kg
-
Administration:I.p.; daily; 4 weeks
-
Result:Dose-dependently inhibited HFD-induced increases in fasting blood glucose and insulin levels, and dose-dependently reduced glucose levels in response to glucose and insulin loads during IPGTT and IPITT.
Dose-dependently decreased HFD-induced liver histological injury, hepatic triglyceride levels, and serum AST and ALT activities.
Dose-dependently inhibited HFD-induced increases in serum TNFα, IL-1β, IL-6, and C reactive protein levels.
Dose-dependently reversed HFD-induced reductions in hepatic MnSOD and CuZnSOD activities, and dose-dependently inhibited HFD-induced increases in hepatic MDA and H2O2 levels.
Dose-dependently inhibited HFD-induced upregulation of hepatic Srebp-1c protein and mRNA expression, as well as hepatic mRNA expression of the Srebp-1c target genes FAS and ACC1.
-
Animal Model:BALB/C-nu/nu nude mice (5-week-old, male, intraperitoneal inoculation of human GBM WJ1 cells)[4]
-
Dosage:10 mg/kg; 20 mg/kg; 40 mg/kg
-
Administration:I.p.; 5 times weekly; 4 weeks
-
Result:Reduced mean tumor weight.
Achieved tumor inhibitory rates of 35.2%, 48.8%, and 55.3% at 10, 20, and 40 mg/kg doses, respectively.
Showed no difference in body weight increase compared to control mice.
Significantly decreased 5-LOX, Bcl-2, C/EBPβ, N-cadherin, vimentin, twist, and snail+slug protein expression in tumor tissues in a dose-dependent manner.
Significantly increased Bax, active caspase-3, and E-cadherin protein expression in tumor tissues in a dose-dependent manner.
-
Animal Model:C57BL/6 (male, 7~8 weeks old, 20~22 g, MPTP-induced modeling)[5]
-
Dosage:5 mg/kg; 20 mg/kg
-
Administration:I.g.; daily; 12 days
-
Result:Increased the time mice stayed on the rota-rod, reduced the time to climb down the pole, and increased traction test scores at all tested time points compared to MPTP-only mice.
Increased the level of Nissl substance in the substantia nigra (SN), reversed the MPTP-induced increase in Bax and cytochrome c expression, reversed the decrease in Bcl-2 expression, and reduced caspase-3 activity in both SN and striatum (Str) in a dose-dependent manner.
Decreased MPTP-induced α-synuclein elevation in SN and Str, attenuated MPTP-induced loss of tyrosine hydroxylase (TH)-positive cells in SN and Str, and attenuated MPTP-induced reduction in TH protein levels in SN and Str.
Upregulated the LC3-II/LC3-I ratio and Beclin-1 expression, and downregulated p62 expression in both SN and Str.\nDid not alter MAO-B activity in the brain.
-
Animal Model:Carrageenan-induced Wistar rats (male, 180-220 g)[7]
-
Dosage:25 mg/kg; 50 mg/kg
-
Administration:P.o.; daily; 5 days
-
Result:Significantly reduced carrageenan-induced paw edema volume in a concentration-dependent manner over the 4-hour observation period.
Significantly reduced serum levels of proinflammatory cytokines TNF-α, IL-1β, and IL-6.
Significantly increased liver activities of antioxidant enzymes superoxide dismutase (SOD), catalase (CAT), and glutathione peroxidase (GSH-Px).
Significantly reduced liver malondialdehyde (MDA) levels.\nAll results were statistically significant.


Chemical Information
-
CAS No. 75288-96-9
-
Appearance Solid
-
Molecular Weight 530.66
-
Formula C28H42N4O6
-
Color White to off-white
-
SMILES
O=C(NCCCNCCCCNCCCNC(CCC1=CC=C(O)C(O)=C1)=O)CCC2=CC=C(O)C(O)=C2
-
Structure Classification
-
Initial Source
-
Shipping
Room temperature in continental US; may vary elsewhere.
-
Storage
Powder -20°C 3 years In solvent -80°C 6 months -20°C 1 month


Publications (1)
-
Journal Impact Factor
-
Most Recent
-
Biomed Res Int
Kukoamine A Improves Mycoplasma pneumoniae Pneumonia by Regulating miR-222-3p/Superoxide Dismutase 2. [Abstract]2022 Jun 21:2022:2064013. PMID: 35774277


Solvent & Solubility
In Vitro:
H2O : 125 mg/mL (235.56 mM; Need ultrasonic)
DMSO : 100 mg/mL (188.44 mM; Need ultrasonic; Hygroscopic DMSO has a significant impact on the solubility of product, please use newly opened DMSO)
Please refer to the solubility information to select the appropriate solvent. Once prepared, please aliquot and store the solution to prevent product inactivation from repeated freeze-thaw cycles.
Storage method and period of stock solution: -80°C, 6 months; -20°C, 1 month. When stored at -80°C, please use it within 6 months. When stored at -20°C, please use it within 1 month.
* Note: If you choose water as the stock solution, please dilute it to the working solution, then filter and sterilize it with a 0.22 μm filter before use.
Please refer to the solubility information to select the appropriate solvent. Once prepared, please aliquot and store the solution to prevent product inactivation from repeated freeze-thaw cycles.
Storage method and period of stock solution: -80°C, 6 months; -20°C, 1 month. When stored at -80°C, please use it within 6 months. When stored at -20°C, please use it within 1 month.
* Note: If you choose water as the stock solution, please dilute it to the working solution, then filter and sterilize it with a 0.22 μm filter before use.
Concentration (start) × Volume (start) = Concentration (final) × Volume (final)
In Vivo:
Select the appropriate dissolution method based on your experimental animal and administration route.
- For the following dissolution methods, please ensure to first prepare a clear stock solution using an In Vitro approach and then sequentially add co-solvents:
- To ensure reliable experimental results, the clarified stock solution can be appropriately stored based on storage conditions. As for the working solution for In Vivo experiments, it is recommended to prepare freshly and use it on the same day.
- The percentages shown for the solvents indicate their volumetric ratio in the final prepared solution. If precipitation or phase separation occurs during preparation, heat and/or sonication can be used to aid dissolution.
Add each solvent one by one: 10% DMSO 40% PEG300 5% Tween-80 45% Saline
Solubility: ≥ 2.5 mg/mL (4.71 mM); Clear solution
This protocol yields a clear solution of ≥ 2.5 mg/mL (saturation unknown).
Taking 1 mL working solution as an example, add 100 μL DMSO stock solution (25.0 mg/mL) to 400 μL PEG300, and mix evenly; then add 50 μL Tween-80 and mix evenly; then add 450 μL Saline to adjust the volume to 1 mL.
Preparation of Saline: Dissolve 0.9 g sodium chloride in ddH₂O and dilute to 100 mL to obtain a clear Saline solution.
Add each solvent one by one: 10% DMSO 90% (20% SBE-β-CD in Saline)
Solubility: ≥ 2.5 mg/mL (4.71 mM); Clear solution
This protocol yields a clear solution of ≥ 2.5 mg/mL (saturation unknown).
Taking 1 mL working solution as an example, add 100 μL DMSO stock solution (25.0 mg/mL) to 900 μL 20% SBE-β-CD in Saline, and mix evenly.
Preparation of 20% SBE-β-CD in Saline (4°C, storage for one week): 2 g SBE-β-CD powder is dissolved in 10 mL Saline, completely dissolve until clear.
For the following dissolution methods, please prepare the working solution directly:
It is recommended to prepare fresh solutions and use them promptly within a short period of time.
The percentages shown for the solvents indicate their volumetric ratio in the final prepared solution. If precipitation or phase separation occurs during preparation, heat and/or sonication can be used to aid dissolution.
Add each solvent one by one: PBS
Solubility: 100 mg/mL (188.44 mM); Clear solution; Need ultrasonic
In Vivo Dissolution Calculator
Please enter the basic information of animal experiments:
-
-
-
-
Recommended: Prepare an additional quantity of animals to account for potential losses during experiments.
Working solution concentration: 0.22 mg/mL
This product has good water solubility, please refer to the measured solubility data in water/PBS/Saline for details.

Protocols
-
Cell migration
Cell migration is a method that plays an important role in wound healing, cell differentiation, embryonic development, etc.
-
Somatic Cell Culture
A method of simulating the in vivo environment in vitro to maintain the cell growth, differentation and main functions.
-
Apoptosis
Apoptosis, also called programmed cell death, is generally characterized by distinct morphological characteristics.
-
TUNEL staining for apoptotic DNA fragmentation
TUNEL staining detects DNA strand breaks by using terminal deoxynucleotidyl transferase to add labeled nucleotides to exposed 3′-OH DNA termini, generating either microscopic staining in fixed cells or tissue sections, or fluorescence/cytometric signal in cell suspensions. TUNEL positivity reflects DNA fragmentation but should not be interpreted alone as definitive apoptosis, because TUNEL can also label necrotic, autolytic, mechanically damaged, or DNA-repair-associated DNA breaks.
-
Flow cytometric DNA-content cell-cycle staining
Flow cytometric DNA-content cell-cycle staining measures the fluorescence intensity of DNA-bound fluorochromes in single cells or nuclei to estimate DNA content distributions, allowing assignment of populations to G0/G1, S, and G2/M phases by DNA histogram deconvolution. Propidium iodide (PI) intercalates into DNA, and PI fluorescence is proportional to cellular DNA content when staining is performed under conditions that make DNA accessible and minimize non-DNA signal. Cells with G2/M DNA content are expected to show approximately twice the fluorescence intensity of G0/G1 cells, while S-phase cells occupy intermediate fluorescence values. PI-based DNA-content analysis can also detect cells with fractional DNA content, often reported as sub-G1, when DNA fragmentation and extraction during staining reduce retained DNA signal in apoptotic cells. DAPI is an alternative DNA fluorochrome for univariate DNA-content analysis, while bivariate approaches combining DNA content with proliferation
-
Research Protocol for Endocrine Diseases
Endocrine diseases often arise from disrupted hormone production, hormone signaling, or target-tissue responsiveness; for diabetes-focused endocrine disease models, insulin signaling regulates glucose uptake, hepatic glucose output, lipid metabolism, and β-cell compensation. Type 2 diabetes develops through interacting defects in insulin resistance, β-cell dysfunction, adipose inflammation, hepatic glucose overproduction, altered incretin signaling, and ectopic lipid metabolism. A major unresolved question is whether endocrine dysfunction is driven primarily by target-tissue insulin resistance, intrinsic β-cell failure, immune/inflammatory stress, or combined multi-organ failure that differs by disease stage.
-
Autophagy
Autophagy is a process in which eukaryotic cells use lysosomes to degrade their own cytoplasmic proteins and damaged organelles under the regulation of autophagy related gene (Atg). Microtubule-associated proteins light chain 3 (LC3) is recognized as autophagy marker, which transfers from cytoplasmic LC3 (LC3-I) to membrane type (LC3-II). LC3-II/I ratio could be detected by Western Blot and fluorescence microscopy.
-
Apoptosis Solutions
Apoptosis is a regulated, generally non-lytic cell-death pathway that removes unwanted, damaged, infected, or abnormal cells through coordinated morphological changes, caspase activation, DNA fragmentation, and membrane remodeling. The intrinsic apoptosis pathway is controlled mainly by mitochondrial outer membrane permeabilization, BCL-2 family proteins, cytochrome c release, apoptosome formation, caspase-9 activation, and downstream executioner caspase-3/7 activation. The extrinsic apoptosis pathway is initiated by death receptors such as Fas, TNFR, and TRAIL receptors, which recruit adaptor proteins and activate caspase-8 before engaging executioner caspases or mitochondrial amplification through BID cleavage. Apoptosis is linked to many phenotypes, including cancer cell killing, tissue homeostasis, immune regulation, neurodegeneration, infection response, and treatment-induced cytotoxicity; unresolved questions include how apoptosis interacts with necroptosis, pyroptosis, ferroptos
-
Cell invasion
Cell invasion is the ability of cells to migrate from one area to another via the extracellular matrix. Cell invasion is the response of normal and cancer cells to chemical and mechanical stimuli. Before migrating to a new region, the extracellular matrix is degraded by proteases within the cell. Cell invasion often occurs during wound repair, vascularization and inflammation, abnormal tissue invasion, and tumor cell metastasis.
-
Lysosome and acidic-vesicle live-cell staining
Lysosome and acidic-vesicle live-cell staining detects acidic intracellular compartments by using membrane-permeant acidotropic probes that accumulate in low-pH vesicles, including lysosomes, late endosomes, autolysosomes, and acidic phagosomes. LysoTracker staining is commonly used as an intensity-based readout of acidic lysosomal compartment abundance or enlargement, while acridine orange produces green fluorescence in less concentrated compartments and red fluorescence after concentration-dependent accumulation in acidic vesicular organelles. Loss or reduction of acridine-orange red signal can be used as a readout of lysosomal membrane permeabilization or reduced acidic-vesicle integrity. This protocol is designed for live cultured cells and can be adapted for fluorescence microscopy, high-content imaging, plate-reader readout, or flow cytometry when the selected literature supports the readout. Because these dyes report acidotropic accumulation rather than lysosome identity alone,
-
MTT Cell Proliferation Assay
The MTT assay is a colorimetric endpoint assay for estimating viable cell number, cell growth, cytotoxicity, or cell activation in cultured mammalian cells. Living cells reduce the yellow tetrazolium salt MTT into purple/blue formazan, while dead cells do not generate the same signal; the resulting color can be quantified with a multiwell spectrophotometer. MTT reduction is commonly interpreted as a readout of metabolic activity that often correlates with viable cell number, but it should not be treated as a direct cell-counting method unless the assay is optimized for the cell type and experimental condition. Studies show that MTT reduction can involve mitochondrial and non-mitochondrial reducing systems, and formazan may accumulate in intracellular lipid droplets rather than simply marking mitochondria.
-
Macroautophagy Solutions
Macroautophagy is a conserved lysosome-dependent degradation pathway in which cytoplasmic material is sequestered into double-membrane autophagosomes and delivered to lysosomes for degradation and recycling. The pathway supports cellular homeostasis during nutrient limitation, organelle stress, protein-aggregate accumulation, infection, differentiation, and tissue remodeling by coupling cargo sequestration, autophagosome maturation, lysosomal fusion, and degradation of cargo-derived macromolecules. The core molecular sequence includes initiation by nutrient- and stress-regulated autophagy machinery, autophagosome nucleation, LC3/ATG8-family conjugation to autophagosomal membranes, cargo selection through receptors such as SQSTM1/p62, autophagosome-lysosome fusion, and lysosomal degradation. LC3 was identified as a mammalian homolog of yeast Atg8 that localizes to autophagosomal membranes after processing, and p62/SQSTM1 was shown to connect ubiquitinated cargo with autophagic degradati
-
Pyroptosis Solutions
Pyroptosis is a lytic inflammatory cell-death pathway executed by gasdermin pores, most classically through inflammasome-mediated activation of caspase-1, cleavage of gasdermin D, membrane pore formation, LDH release, and secretion of IL-1β and IL-18. The canonical pathway is commonly modeled by priming cells with an inflammatory signal such as LPS to induce pro-IL-1β and inflammasome components, followed by an activation signal such as ATP or nigericin to activate NLRP3, ASC speck formation, caspase-1 cleavage, GSDMD cleavage, cytokine release, and pyroptotic membrane rupture. The non-canonical pathway is triggered when cytosolic LPS activates mouse caspase-11 or human caspase-4/5, leading to GSDMD cleavage and pyroptosis, and this can secondarily activate NLRP3-dependent IL-1β release. Pyroptosis is linked to inflammatory injury, infection, cancer, liver disease, ocular disease, placental inflammation, and other disease phenotypes, but unresolved questions include which gasdermin fam
-
Research Protocol for Infectious Diseases
Infectious-disease experiments test how pathogens interact with host barriers, innate immune receptors, inflammatory signaling, pathogen replication, and tissue injury; pattern-recognition receptors such as TLRs, RIG-I-like receptors, NOD-like receptors, and inflammasomes detect microbial molecules and activate NF-κB, interferon, and cytokine responses. The central hypothesis is that infection severity reflects the balance between pathogen burden and host response: protective inflammation restricts pathogen growth, whereas excessive or mislocalized inflammation contributes to tissue damage and disease phenotype. Unresolved questions include which host pathways are protective versus pathogenic, why some infection models fail to translate to human disease, and which combined readouts best predict clinically relevant infection outcomes.
-
Annexin V plus membrane-impermeant dye apoptosis staining
Annexin V-based apoptosis assays rely on the detection of phosphatidylserine (PS) externalization from the inner leaflet of the plasma membrane to the outer leaflet, an early biochemical hallmark of apoptosis. Fluorescently labeled Annexin V binds PS in a calcium-dependent manner, enabling identification of early apoptotic cells by flow cytometry or fluorescence microscopy. When combined with a membrane-impermeant DNA-binding dye (e. g. , propidium iodide), this approach allows discrimination between viable (Annexin V−/dye−), early apoptotic (Annexin V+/dye−), and late apoptotic or necrotic (Annexin V+/dye+) cell populations by assessing membrane integrity and PS exposure.
-
BrdU Incorporation Assay
Bromodeoxyuridine (BrdU) incorporation assay is based on the principle that BrdU, a thymidine analog, is incorporated into newly synthesized DNA during the S phase of the cell cycle, thereby serving as a marker of DNA replication and cellular proliferation. Incorporated BrdU can be detected using anti-BrdU antibodies following DNA denaturation, enabling visualization or quantification of proliferating cells through immunochemical detection methods such as immunofluorescence or immunohistochemistry.
-
ROS/oxidative-stress fluorescent staining
ROS/oxidative-stress fluorescent staining uses cell-permeant fluorogenic probes that become fluorescent after oxidation inside cells or tissues; commonly used examples include DCFH-DA/DCFDA for broad cellular oxidant detection, DHE for superoxide-related signal detection, MitoSOX for mitochondrial superoxide-related signal detection, and CellROX probes for oxidative-stress-associated fluorescence readouts. The assay detects probe oxidation rather than a single ROS species unless the probe and analysis method have been chemically validated for that species. DCFH-DA enters cells, is deacetylated by intracellular esterases to DCFH, and produces fluorescent DCF after oxidation, so the readout is used as an operational measure of total cellular oxidative stress rather than a species-specific ROS measurement. DHE and MitoSOX can report superoxide-related oxidation, but red fluorescence alone can include non-specific ethidium-like oxidation products; HPLC or optimized spectral approaches are
-
CFSE Dye Dilution Proliferation Assay
The CFSE (carboxyfluorescein diacetate succinimidyl ester) dye dilution proliferation assay is based on the covalent labeling of intracellular proteins by a cell-permeant fluorescent dye that becomes fluorescent upon intracellular ester cleavage and then is stably retained within cells. As labeled cells divide, the dye is partitioned equally between daughter cells, resulting in a stepwise halving of fluorescence intensity that can be quantified by flow cytometry to determine the number of cell divisions undergone by each cell population. This fluorescence dilution approach enables quantitative tracking of lymphocyte proliferation at the single-cell level over multiple rounds of division. CFSE-based proliferation analysis has been widely applied to measure antigen-driven lymphocyte expansion in vitro, where discrete fluorescence peaks correspond to successive cell divisions and allow reconstruction of proliferative history within heterogeneous populations.
-
Dye-dilution cell tracking and proliferation staining
Dye-dilution cell tracking assays quantify cell proliferation by covalently labeling intracellular proteins with a stable fluorescent dye that is equally partitioned between daughter cells during mitosis, resulting in stepwise halving of fluorescence intensity with each cell division as measured by flow cytometry histograms. Carboxyfluorescein diacetate succinimidyl ester (CFSE) is a prototypical dye that diffuses into cells, is enzymatically converted into a fluorescent compound, and then covalently binds intracellular amine groups, producing long-lived fluorescence suitable for tracking multiple rounds of division in vitro and in vivo. Successive generations of dividing cells form discrete peaks of decreasing fluorescence intensity, enabling estimation of proliferation history, precursor frequency, and division index within heterogeneous populations. Alternative dyes such as CellTrace Violet (CTV) and far-red membrane dyes (e. g. , PKH26) follow the same dilution principle but differ
-
CCK-8/WST-8 Cell Proliferation Assay
The CCK-8/WST-8 assay is based on the reduction of the water-soluble tetrazolium salt WST-8 to a water-soluble formazan product by cellular dehydrogenases in metabolically active cells, where the generated formazan amount is proportional to the number of living cells and is quantified by measuring absorbance in the visible range, providing a colorimetric readout for cell viability and proliferation assessment. This class of tetrazolium-based assays improves upon earlier MTT-based systems by producing a water-soluble formazan, eliminating the need for organic solubilization steps and enabling direct spectrophotometric measurement in culture medium.
-
Protocol for Cell Cycle
Cell-cycle analysis by flow cytometry measures DNA content in single cells to estimate the fraction of cells in G0/G1, S, and G2/M phases. Propidium iodide intercalates into DNA, and after RNA removal with RNase, fluorescence intensity reflects cellular DNA content: 2N cells are assigned to G0/G1, cells between 2N and 4N to S phase, and 4N cells to G2/M. DNA-content analysis alone cannot reliably separate G0 from G1 or G2 from M. Ki-67 can distinguish quiescent G0 cells from cycling cells, EdU or BrdU incorporation marks active DNA synthesis in S phase, and phospho-histone H3 staining identifies mitotic cells within the 4N population.
-
Cell Counting-Based Growth Curve Assay
Cell counting-based growth curve assays quantify cell proliferation by directly measuring changes in viable cell number over time using manual or automated counting methods such as hemocytometer-based counting or instrument-assisted cell enumeration, enabling construction of growth curves that reflect population expansion dynamics in response to culture conditions. A widely used approach is trypan blue exclusion with hemocytometer counting, where membrane-compromised (non-viable) cells take up the dye, allowing discrimination between viable and non-viable cells while simultaneously enabling total cell number quantification. Repeated sampling across time points allows estimation of proliferation rate, growth phases, and comparative growth kinetics between experimental conditions.
-
Research Protocol for Inflammation-related Diseases
The NLRP3 inflammasome is a cytosolic innate immune signaling platform that integrates priming signals and danger-signal activation to promote caspase-1 activation, maturation of IL-1β and IL-18, and gasdermin D-mediated pyroptotic cell death. The core experimental logic is to determine whether inflammatory disease phenotypes are driven by increased NLRP3 expression, ASC-containing inflammasome assembly, caspase-1 cleavage, GSDMD cleavage, and extracellular release of IL-1β/IL-18 rather than by nonspecific cell injury alone. The pathway is strongly linked to inflammation-related disease phenotypes because monosodium urate crystals activate NALP3/NLRP3 inflammasome signaling in gout-like crystal inflammation, cholesterol crystals activate NLRP3 inflammasomes in atherogenesis models, and DSS-induced intestinal inflammation has been reported to involve NLRP3 inflammasome activity. However, experimental colitis studies also show context-dependent protective effects of NLRP3 inflammasome co
-
Colony Formation (Clonogenic) Assay
The clonogenic (colony formation) assay measures the ability of a single cell to retain reproductive viability and form a macroscopic colony, typically defined as a cluster derived from one progenitor cell after a defined growth period. This assay is widely used to evaluate cell survival after exposure to ionizing radiation or cytotoxic treatments and is considered a standard method in radiation biology for generating dose-response relationships of reproductive cell death. Colony formation reflects long-term proliferative capacity rather than short-term metabolic activity, and survival is quantified by comparing treated versus untreated conditions based on colony number and derived survival fractions.
-
Research Protocol for Neurological Diseases
PINK1/Parkin-mediated mitophagy pathway is a mitochondrial quality-control signaling axis in which mitochondrial depolarization stabilizes PINK1 on damaged mitochondria, activates Parkin recruitment and E3 ubiquitin ligase activity, promotes ubiquitination of outer mitochondrial membrane proteins, recruits selective autophagy adaptors, and drives lysosomal degradation of damaged mitochondria. In neurological disease research, this pathway is experimentally important because neurons, especially dopaminergic neurons, are highly dependent on mitochondrial integrity, and defective mitochondrial turnover can lead to mitochondrial dysfunction, oxidative stress, impaired neuronal survival, α-synuclein accumulation, and neuroinflammatory damage-associated signals. The genetic disease link is strongest in Parkinson’s disease because mutations in PRKN/parkin cause autosomal recessive juvenile parkinsonism, mutations in PINK1 cause hereditary early-onset Parkinson’s disease, and Drosophila studie
-
Research Protocol for Metabolic Diseases
AMP-activated protein kinase, AMPK, is a conserved cellular energy sensor that responds to reduced cellular energy status and coordinates metabolism by increasing ATP-generating catabolic pathways while suppressing ATP-consuming anabolic processes. In metabolic disease research, the AMPK pathway is experimentally relevant because it regulates hepatic lipid synthesis, fatty acid oxidation, glucose production, skeletal-muscle glucose disposal, mTORC1-linked biosynthesis, autophagy, mitochondrial homeostasis, and whole-body energy balance. The central pathway logic is that energy stress, metformin, exercise-like stimulation, or direct AMPK activators increase AMPKα Thr172 phosphorylation and downstream substrate phosphorylation, including ACC and RAPTOR. Phosphorylation of ACC suppresses lipogenesis and supports fatty acid oxidation, whereas phosphorylation of RAPTOR suppresses mTORC1 signaling and links cellular energy status to growth and protein synthesis control. The pathway is linked
-
Cell Viability Determination by MTT Colorimetric Assay
The following protocol uses the MTT colorimetric assay as a classic literature-established method for assessing cell viability/metabolic activity in cultured mammalian cells. MTT[3-(4,5-dimethylthiazol-2-yl)-2,5-diphenyltetrazolium bromide] is reduced by metabolically active cells to a colored formazan product; the amount of formazan is quantified spectrophotometrically and provides an indirect measure of metabolically active viable cells. Importantly, MTT reduction reflects cellular oxidoreductase/metabolic activity rather than an absolute direct count of living cells, so changes in cellular metabolism can alter the signal independently of cell number.
-
EdU Incorporation Assay (Click Chemistry-Based DNA Synthesis Measurement)
The EdU incorporation assay measures DNA synthesis by adding the thymidine analog 5-ethynyl-2′-deoxyuridine to cells or tissues, where it is incorporated into newly synthesized DNA during S phase. Incorporated EdU is detected by copper-catalyzed azide-alkyne cycloaddition, in which a fluorescent azide covalently reacts with the ethynyl group on EdU, allowing S-phase cells to be detected by fluorescence microscopy, flow cytometry, or high-content imaging. EdU detection does not require DNA denaturation or anti-BrdU antibody access, which preserves sample structure and improves compatibility with immunostaining and multiparameter cytometry compared with BrdU-based detection. EdU can be cytotoxic in a cell-type- and exposure-dependent manner, so pulse duration, concentration, and continuous-labeling designs should be validated for each cell type.
-
3T3-L1 preadipocyte-to-adipocyte differentiation
3T3-L1 preadipocytes are induced to differentiate after growth arrest using adipogenic media containing insulin, dexamethasone, and IBMX; differentiation is assessed by lipid-droplet accumulation, triglyceride increase, Oil Red O staining, and adipocyte-marker induction such as PPARγ and C/EBPα.
-
Ki-67 Immunostaining Proliferation Assay
Ki-67 immunostaining measures the growth fraction of a cell population by detecting Ki-67, a nuclear antigen present in proliferating cells and absent in quiescent G0 cells. The readout is the percentage of Ki-67-positive nuclei among total counted cells, commonly called the Ki-67 labeling index or proliferation index.
-
PCNA Immunodetection Proliferation Assay
PCNA immunodetection measures proliferative activity by detecting proliferating cell nuclear antigen, a nuclear protein associated with DNA polymerase δ function and DNA replication. The assay readout is the proportion of PCNA-positive nuclei among total counted cells, but PCNA labeling is not identical to BrdU labeling because PCNA can mark late G1/early S-associated replication competence and may persist beyond active DNA synthesis depending on fixation and extraction conditions.
-
Protocol for Cell Counting and Cell Density Analysis
Cell counting and cell-density analysis estimate the number of cells in a known volume or field area. Manual hemocytometer counting uses a chamber of defined geometry to convert counted cells into cells/mL, while automated counters and image-analysis workflows detect cell objects from optical, brightfield, fluorescence, impedance, or digital-image features. Trypan blue viability counting is based on dye exclusion: viable cells with intact membranes exclude dye, while non-viable cells with compromised membranes stain blue. The readout is total cell density, viable-cell density, dead-cell density, and percent viability. Cell density can also be estimated from microscopy images by counting objects per image area, from flow cytometry using calibrated volume or reference particles, or from in situ microscopy in bioreactors after calibration against reference methods such as hemocytometer or flow cytometry.
-
Human pluripotent stem cell midbrain dopaminergic neuron differentiation
Human pluripotent stem cells are directed toward midbrain dopaminergic neurons by first inducing a neural floor-plate-like progenitor state, then patterning cells with ventralizing SHH signaling and midbrain/WNT-FGF cues, and finally maturing progenitors into neurons expressing dopaminergic markers such as TH, NURR1/NR4A2, PITX3, DAT/SLC6A3, VMAT2/SLC18A2, GIRK2/KCNJ6, FOXA2, LMX1A, and EN1. The main readouts are loss of pluripotency, acquisition of FOXA2+/LMX1A+ midbrain floor-plate progenitors, emergence of βIII-tubulin+/MAP2+ neurons, and production of TH+ dopaminergic neurons with molecular, dopamine-release, and electrophysiological features of midbrain dopaminergic identity.
-
Lipid Droplets: Oil Red O/Sudan Dye Lipid Staining
Lipid droplets are intracellular organelles with a neutral-lipid core that stores triacylglycerols and sterol esters, and Oil Red O or Sudan dyes detect these hydrophobic lipid deposits by partitioning into retained lipids in fresh or frozen specimens. Oil Red O stains neutral triglycerides and lipids in frozen tissue sections or air-dried cytologic preparations, while Sudan Black B has also been used as a histochemical fat stain for lipid-rich tissue structures.


Purity & Documentation
-
Data Sheet (291 KB)
-
SDS (252 KB)
- English - EN (252 KB)
- Français - FR (252 KB)
- Deutsch - DE (252 KB)
- Norwegian - NO (252 KB)
- Español - ES (252 KB)
- Swedish - SV (252 KB)
- Italian - IT (252 KB)
- Korean - KR (252 KB)
- Portuguese - PT (252 KB)
-
Handling Instructions (2659 KB)
References
[1]. Ponasik JA, et al. Kukoamine A and other hydrophobic acylpolyamines: potent and selective inhibitors of Crithidia fasciculata trypanothione reductase. Biochem J. 1995 Oct 15;311 ( Pt 2)(Pt 2):371-5. [Content Brief]
[2]. Hadjipavlou-Litina D, et al. Kukoamine A analogs with lipoxygenase inhibitory activity. J Enzyme Inhib Med Chem. 2009;24(5):1188-1193. [Content Brief]
[3]. Li G, et al. Kukoamine A attenuates insulin resistance and fatty liver through downregulation of Srebp-1c. Biomed Pharmacother. 2017;89:536-543. [Content Brief]
[4]. Wang Q, et al. Kukoamine A inhibits human glioblastoma cell growth and migration through apoptosis induction and epithelial-mesenchymal transition attenuation. Sci Rep. 2016;6:36543. Published 2016 Nov 8. [Content Brief]
[5]. Hu X, et al. Neuroprotective effects of Kukoamine A on neurotoxin-induced Parkinson's model through apoptosis inhibition and autophagy enhancement. Neuropharmacology. 2017;117:352-363. [Content Brief]
[6]. Saller J, et al. Identification and quantification of kukoamine A and kukoamine B as novel μ-opioid receptor agonists in potato and other solanaceous plants. Food Chem. 2023;427:136637. [Content Brief]


Complete Stock Solution Preparation Table
Please refer to the solubility information to select the appropriate solvent. Once prepared, please aliquot and store the solution to prevent product inactivation from repeated freeze-thaw cycles.
Storage method and period of stock solution: -80°C, 6 months; -20°C, 1 month. When stored at -80°C, please use it within 6 months. When stored at -20°C, please use it within 1 month.
| Optional Solvent | Concentration Solvent Mass | 1 mg | 5 mg | 10 mg | 25 mg |
|---|---|---|---|---|---|
| DMSO / H2O | 1 mM | 1.8844 mL | 9.4222 mL | 18.8445 mL | 47.1111 mL |
| 5 mM | 0.3769 mL | 1.8844 mL | 3.7689 mL | 9.4222 mL | |
| 10 mM | 0.1884 mL | 0.9422 mL | 1.8844 mL | 4.7111 mL | |
| 15 mM | 0.1256 mL | 0.6281 mL | 1.2563 mL | 3.1407 mL | |
| 20 mM | 0.0942 mL | 0.4711 mL | 0.9422 mL | 2.3556 mL | |
| 25 mM | 0.0754 mL | 0.3769 mL | 0.7538 mL | 1.8844 mL | |
| 30 mM | 0.0628 mL | 0.3141 mL | 0.6281 mL | 1.5704 mL | |
| 40 mM | 0.0471 mL | 0.2356 mL | 0.4711 mL | 1.1778 mL | |
| 50 mM | 0.0377 mL | 0.1884 mL | 0.3769 mL | 0.9422 mL | |
| 60 mM | 0.0314 mL | 0.1570 mL | 0.3141 mL | 0.7852 mL | |
| 80 mM | 0.0236 mL | 0.1178 mL | 0.2356 mL | 0.5889 mL | |
| 100 mM | 0.0188 mL | 0.0942 mL | 0.1884 mL | 0.4711 mL |
* Note: If you choose water as the stock solution, please dilute it to the working solution, then filter and sterilize it with a 0.22 μm filter before use.


Kukoamine A Related Classifications
HY-N2392 Related Classifications
 Powered by Bioz
Keywords
- Kukoamine A
- 75288-96-9
- Free Radical Scavengers
- Parasite
- Lipoxygenase
- Opioid Receptor
- Apoptosis
- Autophagy
- Reactive Oxygen Species (ROS)
- Interleukin Related
- TNF Receptor
- PGE synthase
- COX
- human glioblastoma U251 cells
- soybean lipoxygenase
- AML-12 cells
- Crithidia fasciculata trypanothione reductase
- C/EBPβ
- COX-2
- human μ-opioid receptor
- 5-lipoxygenase
- Srebp-1c
- SH-SY5Y cells
- Inhibitor
- inhibitor
- inhibit