



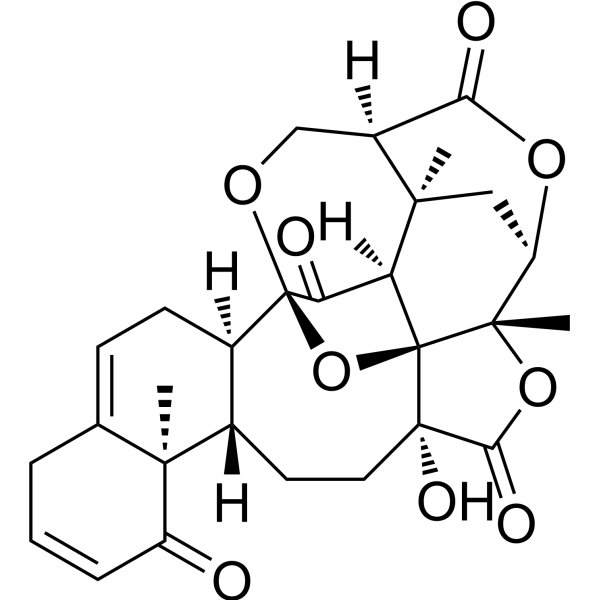
Physalin B

Based on 1 Customer Validation
Physalin B is an orally active anti-inflammatory and anticancer agent. Physalin B can be isolated from Physalis alkekengi L. var. Franchetii. Physalin B inhibits the activation of the NF-κB, NLRP3 inflammasome, STAT3, PI3K/Akt and Hedgehog signaling pathways, regulates the phosphorylation levels of GSK-3β, p38 MAPK, ERK1/2 and JNK, and promotes the nuclear translocation of NRF2. Physalin B reduces the levels of pro-inflammatory cytokines and factors, induces mitochondrial reactive oxygen species (mito-ROS) production, Apoptosis, G2/M cell cycle arrest and incomplete Autophagy, alters cytoskeleton structure and alleviates oxidative stress. Physalin B reduces cancer cell viability, ameliorates liver and lung tissue damage and alleviates liver fibrosis. Physalin B can be used in research related to ulcerative colitis, breast cancer, acute lung injury, colon cancer, non-alcoholic steatohepatitis, liver fibrosis, lung cancer, pancreatic cancer, lymphoma, ovarian cancer, sarcoma and leukemia.
For research use only. We do not sell to patients.
- Purity : 97.20%
- CAS No.: 23133-56-4
- Formula: C28H30O9
- Molecular Weight:510.53
-
Storage:
4°C, protect from light
* In solvent : -80°C, 6 months; -20°C, 1 month (protect from light)

To place orders, for customer services and technical support, please contact: MedChemExpress USA
Tel: 609-228-6898 E-mail: [email protected] [email protected]


-
 Biological Activity
-
Chemical Information
- Protocols
- Purity & Documentation
- References
-
 Help & FAQs




Biological Activity
Description
IC50 & Target
[1]|
NLRP3 inflammasome |
GSK-3β |
STAT3 |
ERK1 |
ERK2 |
Cellular Effect
|
Cell Line

|
Type | Value | Description | References |
|---|---|---|---|---|
| A-431 | EC50 |
1.8 μg/mL
Compound: 9
|
Antitumor activity against human A431 cells
Antitumor activity against human A431 cells
|
[PMID: 17580910] |
| A549 | EC50 |
5.9 μg/mL
Compound: 9
|
Antitumor activity against human A549 cells
Antitumor activity against human A549 cells
|
[PMID: 17580910] |
| A549 | IC50 |
11.9 μM
Compound: 18
|
Antiproliferative activity against human A549 cells assessed as reduction in cell viability incubated for 48 hrs by CCK8 assay
Antiproliferative activity against human A549 cells assessed as reduction in cell viability incubated for 48 hrs by CCK8 assay
|
[PMID: 35608269] |
| HCT-8 | EC50 |
1.5 μg/mL
Compound: 9
|
Antitumor activity against human HCT8 cells
Antitumor activity against human HCT8 cells
|
[PMID: 17580910] |
| HeLa | IC50 |
2 μM
Compound: 1
|
Cytotoxicity against human HeLa cells after 72 hrs by MTT assay
Cytotoxicity against human HeLa cells after 72 hrs by MTT assay
|
[PMID: 16562828] |
| HeLa | IC50 |
37.5 μM
Compound: PB-1
|
Inhibition of TNFalpha-induced IkappaBalpha (unknown origin) phosphorylation expressed in human HeLa cells pretreated 30 mins before TNFalpha addition measured up to 120 mins by ELISA in presence of proteasome inhibitor MG-132
Inhibition of TNFalpha-induced IkappaBalpha (unknown origin) phosphorylation expressed in human HeLa cells pretreated 30 mins before TNFalpha addition measured up to 120 mins by ELISA in presence of proteasome inhibitor MG-132
|
[PMID: 24900739] |
| HeLa | IC50 |
6.07 μM
Compound: PB-1
|
Inhibition of TNFalpha-induced NF-kappaB activation (unknown origin) expressed in human HeLa cells pretreated 30 mins before TNFalpha addition after 7 hrs by luciferase reporter gene assay
Inhibition of TNFalpha-induced NF-kappaB activation (unknown origin) expressed in human HeLa cells pretreated 30 mins before TNFalpha addition after 7 hrs by luciferase reporter gene assay
|
[PMID: 24900739] |
| HepG2 | IC50 |
11.7 μM
Compound: 18
|
Antiproliferative activity against human HepG2 cells assessed as reduction in cell viability incubated for 48 hrs by CCK8 assay
Antiproliferative activity against human HepG2 cells assessed as reduction in cell viability incubated for 48 hrs by CCK8 assay
|
[PMID: 35608269] |
| KB | EC50 |
3 μg/mL
Compound: 9
|
Antitumor activity against human KB cells
Antitumor activity against human KB cells
|
[PMID: 17580910] |
| LNCaP | EC50 |
5.3 μg/mL
Compound: 9
|
Antitumor activity against human LNCAP cells
Antitumor activity against human LNCAP cells
|
[PMID: 17580910] |
| MCF7 | IC50 |
1 μM
Compound: 6
|
Cytotoxicity against human MCF7 cells assessed as cell growth inhibition measured after 24 to 72 hrs by MTT assay
Cytotoxicity against human MCF7 cells assessed as cell growth inhibition measured after 24 to 72 hrs by MTT assay
|
[PMID: 33586438] |
| MCF7 | IC50 |
11.2 μM
Compound: 18
|
Antiproliferative activity against human MCF7 cells assessed as reduction in cell viability incubated for 48 hrs by CCK8 assay
Antiproliferative activity against human MCF7 cells assessed as reduction in cell viability incubated for 48 hrs by CCK8 assay
|
[PMID: 35608269] |
| NCI-H460 | IC50 |
0.9 μM
Compound: 6
|
Cytotoxicity against human NCI-H460 cells assessed as cell growth inhibition measured after 24 to 72 hrs by MTT assay
Cytotoxicity against human NCI-H460 cells assessed as cell growth inhibition measured after 24 to 72 hrs by MTT assay
|
[PMID: 33586438] |
| PANC-1 | IC50 |
0.62 μM
Compound: 136
|
Inhibition of Gli1-mediated transcription expressed in human PANC1 cells
Inhibition of Gli1-mediated transcription expressed in human PANC1 cells
|
[PMID: 19309080] |
| PC-3 | EC50 |
0.9 μg/mL
Compound: 9
|
Antitumor activity against human PC3 cells
Antitumor activity against human PC3 cells
|
[PMID: 17580910] |
| PC-3 | IC50 |
1 μM
Compound: 6
|
Cytotoxicity against human PC-3 cells assessed as cell growth inhibition measured after 24 to 72 hrs by MTT assay
Cytotoxicity against human PC-3 cells assessed as cell growth inhibition measured after 24 to 72 hrs by MTT assay
|
[PMID: 33586438] |
| RAW264.7 | IC50 |
0.84 μM
Compound: 9
|
Inhibition of LPS-induced nitric oxide production in mouse RAW264.7 cells assessed as nitrite formation
Inhibition of LPS-induced nitric oxide production in mouse RAW264.7 cells assessed as nitrite formation
|
[PMID: 18348534] |
| SF-268 | IC50 |
0.6 μM
Compound: 6
|
Cytotoxicity against human SF-268 cells assessed as cell growth inhibition measured after 24 to 72 hrs by MTT assay
Cytotoxicity against human SF-268 cells assessed as cell growth inhibition measured after 24 to 72 hrs by MTT assay
|
[PMID: 33586438] |
| SGC-7901 | IC50 |
12.1 μM
Compound: 18
|
Antiproliferative activity against human SGC-7901 cells assessed as reduction in cell viability incubated for 48 hrs by CCK8 assay
Antiproliferative activity against human SGC-7901 cells assessed as reduction in cell viability incubated for 48 hrs by CCK8 assay
|
[PMID: 35608269] |
| WI-38 | IC50 |
3.3 μM
Compound: 6
|
Cytotoxicity against human WI-38 cells assessed as cell growth inhibition measured after 24 to 72 hrs by MTT assay
Cytotoxicity against human WI-38 cells assessed as cell growth inhibition measured after 24 to 72 hrs by MTT assay
|
[PMID: 33586438] |
| ZR-75-1 | EC50 |
2.6 μg/mL
Compound: 9
|
Antitumor activity against human ZR751 cells
Antitumor activity against human ZR751 cells
|
[PMID: 17580910] |
In Vitro
Physalin B (0.25-16.0 µM; 24 h) is non-cytotoxic to RAW 264.7 cells at concentrations up to 1.0 µM after 24 h, but induces significant concentration-dependent cytotoxicity at concentrations ≥2.0 µM[1].
Physalin B (0.25-1.0 µM; 2 h pre-incubation, followed by 24 h co-incubation with 1 µg/mL LPS) significantly inhibits LPS-induced production of TNF-α, IL-6, and IL-1β in RAW 264.7 cells[1].
Physalin B (0.63-40 μM; 12-72 h) reduces the viability of MCF-7, MDA-MB-231, and T-47D human breast cancer cells in a concentration- and time-dependent manner, with near-complete cell death at 40 μM after 24 h[2].
Physalin B (2.5-10 μM; 48 h) increases the apoptotic rate of MCF-7 human breast cancer cells to 16.4%, 21.6%, and 35.4% at concentrations of 2.5 μM, 5 μM, and 10 μM for 48 h, respectively[2].
Physalin B (0.31-10 μmol/L; 72 h) potently inhibits the viability of human HCT116 colon cancer cells with an IC50 of 1.35 μmol/L[4].
Physalin B (2.5-10 μmol/L; 12-36 h) induces apoptosis in human HCT116 colon cancer cells by promoting pyknosis, apoptotic body formation, and cleavage of PARP and caspase-3 at concentrations of 2.5, 5, and 10 μmol/L over 12-36 h[4].
Physalin B (0.25-40 μM; 48 h) does not affect the viability of L02 human hepatocytes[5].
Physalin B (0.25-1 μM; 48 h) dose-dependently reduces lipid accumulation in FFA-induced L02 human hepatocytes[5].
Physalin B (0.25-1 μM; 48 h) dose-dependently reduces intracellular ROS levels in FFA-induced L02 human hepatocytes[5].
Physalin B (2.5-5 μM; 30 min preincubation, followed by 6 h TNFα stimulation) inhibits TNFα-induced NF-κB activation in 293T-NF-κB human cells, with maximal 85% inhibition observed at 5 μM[6].
Physalin B (24 h) reduces LX-2 cell viability with an IC50 of approximately 5 μM[7].
MedChemExpress (MCE) has not independently confirmed the accuracy of these methods. They are for reference only.
-
Cell Line:mouse monocyte-macrophage RAW 264.7 cells
-
Concentration:0.25-16.0 µM
-
Incubation Time:24 h
-
Result:Showed no cytotoxicity (cell viability unchanged relative to control) at concentrations of 0.25, 0.5, and 1.0 µM after 24 h.
Reduced cell viability to 88.50% at 2.0 µM.
Increased cytotoxicity significantly with higher concentrations (4.0, 8.0, 16.0 µM), leading to progressively lower cell survival rates.
-
Cell Line:LPS-stimulated mouse monocyte-macrophage RAW 264.7 cells
-
Concentration:0.25-1.0 µM
-
Incubation Time:2 h pre-incubation, followed by 24 h co-incubation with 1 µg/mL LPS
-
Result:Significantly inhibited the LPS-induced release of TNF-α, IL-6, and IL-1β at all tested concentrations, with statistically significant reductions (P < 0.01 to P < 0.001) relative to the LPS-only model group.
-
Cell Line:MCF-7, MDA-MB-231, T-47D
-
Concentration:0.63-40 μM
-
Incubation Time:12 h, 24 h, 48 h, 72 h
-
Result:Caused less than 20% cell death across all three cell lines at concentrations below 2.5 μM even after 72 h.
Reduced cell viability in a concentration- and time-dependent manner at 2.5-40 μM.
Reduced MCF-7 cell viabilities to 71.8% (12 h), 52.0% (24 h), 43.0% (48 h), 31.8% (72 h) at 20 μM.
Reduced MDA-MB-231 cell viabilities to 78.7% (12 h), 36.2% (24 h), 28.0% (48 h), 33.2% (72 h) at 20 μM.
Reduced T-47D cell viabilities to 85.3% (12 h), 29.9% (24 h), 16.5% (48 h), 10.3% (72 h) at 20 μM.
Nearly completely killed all three cell lines at 40 μM after 24 h or longer incubation.
-
Cell Line:MCF-7
-
Concentration:2.5-10 μM
-
Incubation Time:48 h
-
Result:Increased the apoptotic rate of MCF-7 cells in a concentration-dependent manner: from baseline to 16.4% (2.5 μM), 21.6% (5 μM), and 35.4% (10 μM).
-
Cell Line:human HCT116 colon cancer cells
-
Concentration:2.5-10 μmol/L (nuclear staining: 5-10 μmol/L; Western blot: 2.5-10 μmol/L)
-
Incubation Time:12-36 h (nuclear staining: 24 h; Western blot: 12-36 h)
-
Result:Induced pyknosis and apoptotic body formation at 5 and 10 μmol/L after 24 h.
Dose- and time-dependently induced cleavage of PARP and caspase-3, with detectable cleavage starting at 12 h for 10 μmol/L, and increasing at 24 and 36 h across all tested concentrations.
In Vivo
Physalin B (15 mg/kg; i.g.; daily; 7 days) protects against LPS-induced acute lung injury in mice by activating the PI3K/Akt pathway to inhibit NF-κB and NLRP3 signaling, reduce inflammatory cytokine production, and suppress lung tissue apoptosis[3].
Physalin B (3.25-600 mg/kg; p.o.; daily; 2-4 weeks) dose-dependently ameliorates MCD-induced NASH in male C57BL/6J mice by activating autophagy and the P62-KEAP1-NRF2 antioxidative pathway, with the 30 mg/kg dose yielding the strongest reductions in liver injury, lipid accumulation, inflammation, and oxidative stress, and no observed toxicity at doses up to 600 mg/kg[5].
Physalin B (1-5 mg·kg−1; i.p.; every other day; 4 weeks) attenuates CCl4 (HY-Y0298)-induced liver fibrosis in male C57BL/6J mice, reducing collagen deposition, liver injury markers, and fibrogenic gene expression[7].
Physalin B (1-5 mg·kg−1; i.p.; every other day; 14 days) ameliorates BDL-induced liver injury and fibrosis in male C57BL/6J mice, reducing pathological damage, collagen deposition, and fibrogenic marker expression[7].
MedChemExpress (MCE) has not independently confirmed the accuracy of these methods. They are for reference only.
-
Animal Model:BALB/c (male, 20 g)[1]
-
Dosage:10 mg/kg; 20 mg/kg
-
Administration:i.p.
-
Result:Significantly reversed DSS-induced colon shortening, with the 20 mg/kg dose showing greater efficacy than positive control SASP.
Significantly prevented body weight loss in DSS-treated mice by day 7.
Significantly reduced the DAI scores of DSS-treated mice, indicating improved disease symptoms.
Significantly alleviated DSS-induced colonic pathological damage (including epithelial erosion, crypt loss, and immune cell infiltration) and reduced histological scores, with the 20 mg/kg dose showing stronger efficacy than SASP.
Significantly inhibited elevated colonic MPO activity in DSS-treated mice, reducing inflammatory cell infiltration.
Significantly reversed DSS-induced splenomegaly (reduced spleen coefficient) and thymus atrophy (increased thymus coefficient), restoring immune organ function.
Significantly reduced elevated colonic levels of pro-inflammatory cytokines TNF-α, IL-6, and IL-1β in DSS-treated mice, with the 20 mg/kg dose showing stronger efficacy than SASP.
Significantly suppressed DSS-induced activation of the NF-κB pathway, as measured by reduced phosphorylation of NF-κB p65 and IκBα.
Significantly suppressed DSS-induced activation of the STAT3 pathway, as measured by reduced phosphorylation of STAT3.
Significantly reduced DSS-induced upregulation of β-arrestin1 protein levels in colon tissue.
Significantly suppressed DSS-induced activation of the NLRP3 inflammasome, as measured by reduced protein levels of NLRP3, ASC, and IL-1β.
-
Animal Model:BALB/c (male, 10-12 weeks old, 20-22 g, LPS-induced septic ALI)[3]
-
Dosage:15 mg/kg
-
Administration:i.g.; daily; 7 days
-
Result:Significantly reduced LPS-induced inflammatory cell infiltration in lung tissue.
Decreased lung wet/dry weight ratios and myeloperoxidase activity in lung tissue, blood, and bronchoalveolar lavage fluid.
Mitigated LPS-induced alterations in arterial blood gas parameters (pH, HCO3-, Hgb, PCO2, PO2, BE).
Reversed LPS-induced downregulation of anti-apoptotic protein Bcl-2 and upregulation of pro-apoptotic protein Bax.
Reduced LPS-increased caspase-3 and caspase-9 activity in lung tissue.
Significantly attenuated LPS-induced increases in total inflammatory cells, neutrophils, macrophages, and lymphocytes in blood and bronchoalveolar lavage fluid.
Decreased LPS-elevated protein levels of TNF-α, IL-1β, and IL-6 in blood, bronchoalveolar lavage fluid, and lung tissue, as well as their mRNA levels in lung tissue.
Blocked LPS-induced phosphorylation of NF-κB (p65) and IκBα in lung tissue.
Inhibited LPS-upregulated NLRP3, ASC, and IL-1β protein levels and caspase-1 activity, while increasing pro-IL-1β protein levels in lung tissue.
Reversed LPS-induced downregulation of phosphorylated PI3K/Akt in lung tissue.
Had protective effects abolished by co-administration of PI3K inhibitor LY294002, including restored NF-κB and NLRP3 activation and increased inflammatory cell influx in lung tissue.
-
Animal Model:C57BL/6J (male, 5 weeks old, 20-22 g, NASH induced by MCD diet for 4 weeks)[5]
-
Dosage:3.25 mg/kg; 7.5 mg/kg; 15 mg/kg; 30 mg/kg; 300 mg/kg; 600 mg/kg
-
Administration:p.o.; daily; 4 weeks (for 3.25-30 mg/kg); p.o.; daily; 2 weeks (for 300-600 mg/kg)
-
Result:Reversed MCD-induced decreases in body weight and significantly reduced the liver-to-body weight ratio at 30 mg/kg dose compared to the MCD model group.
Reduced serum alanine aminotransferase (ALT) and aspartate aminotransferase (AST) levels in a dose-dependent manner, with the 30 mg/kg dose showing the strongest reduction.
Decreased hepatic total triglyceride (TG) and total cholesterol (TC) levels in a dose-dependent manner.
Improved liver injury, hepatocyte ballooning, and inflammatory cell infiltration in a dose-dependent manner; significantly reduced the NAFLD Activity Score (NAS) across all doses.
Significantly decreased hepatic mRNA expression of inflammatory cytokines Il-6, Il-1β, and Tnf-α in a dose-dependent manner, and reduced F4/80 mRNA levels.
Reduced hepatic lipid accumulation in a dose-dependent manner, with the 30 mg/kg dose nearly eliminating large lipid droplets.
Increased hepatic LC3-II protein levels and the LC3-II/LC3-I ratio in a dose-dependent manner.
Increased hepatic NRF2 and P62 protein expression in a dose-dependent manner, and upregulated hepatic mRNA expression of NRF2 target genes Nqo-1 and Ho-1 in a dose-dependent manner.
Showed no abnormal clinical signs or pathological changes in heart, liver, spleen, or kidney tissues at 300 mg/kg and 600 mg/kg oral doses for 2 weeks.
-
Animal Model:C57BL/6J (male, 5 weeks old, 18-20 g, specific-pathogen-free, liver fibrosis induced by CCl4 injection)[7]
-
Dosage:1 mg·kg-1; 2.5 mg·kg-1; 5 mg·kg-1
-
Administration:i.p.; every other day; 4 weeks
-
Result:Ameliorated CCl4-induced hepatic inflammatory cell infiltration, central venous wall thickening, and fibrous hyperplasia.
Reduced Sirius Red and Masson's trichrome-stained collagen deposition, fibroplasia, and bridging fibrosis.
Decreased elevated serum alanine aminotransferase (ALT) and aspartate aminotransferase (AST) levels.
Lowered hepatic hydroxyproline content.
Significantly reduced mRNA expression of fibrogenic genes (α-sma, Col1a1, Tgfβ1, Timp1) as well as protein levels of α-SMA and COL1A1 in liver tissues.
-
Animal Model:C57BL/6J (male, 5 weeks old, 18-20 g, specific-pathogen-free, liver fibrosis induced by bile duct ligation surgery)[7]
-
Dosage:1 mg·kg-1; 2.5 mg·kg-1; 5 mg·kg-1
-
Administration:i.p.; every other day; 14 days
-
Result:Ameliorated BDL-induced liver parenchyma necrosis.
Reduced newly formed bile ducts (assessed by CK19 staining).
Decreased Sirius Red and Masson's trichrome-stained collagen deposition.
Lowered liver-to-body weight ratio and elevated serum biochemical markers (including alkaline phosphatase (AKP), γ-glutamyl transpeptidase (γ-GT), total bile acid (TBA), total bilirubin (TBiL)).
Reduced hepatic hydroxyproline content.
Significantly decreased mRNA and protein levels of fibrogenic markers in liver tissues.
- Collagen: Sirius Red Staining
- Connective Tissue: Masson's Trichrome/Collagen Trichrome Staining
- Breast Cancer Modeling
- Phalloidin F-actin cytoskeleton staining
- Cytoplasmic-Nuclear Fractionated Protein Extraction
- Detection of Apoptosis
- TUNEL staining for apoptotic DNA fragmentation
- Flow cytometric DNA-content cell-cycle staining
- Cell Cytotoxicity Assay
- Autophagy
- Apoptosis Solutions
- Lysosome and acidic-vesicle live-cell staining
- MTT Cell Proliferation Assay
- Inhalation Toxicity Study
- Macroautophagy Solutions
- Pyroptosis Solutions
- Western Blot
- Mammalian live/dead viability and cytotoxicity staining
- Annexin V plus membrane-impermeant dye apoptosis staining
- ROS/oxidative-stress fluorescent staining
- BrdU Incorporation Assay
- Protocol for Cell Cycle
- CCK-8/WST-8 Cell Proliferation Assay
- Research Protocol for Inflammation-related Diseases
- Cell Viability Determination by MTT Colorimetric Assay
- Liver Histomorphometry
- Kinase activity and phosphorylation assays
- Fibrosis/Collagen Morphometry
- LPS-Induced Endotoxemia/Systemic Inflammation
- DSS-Induced Colitis
- TNBS-Induced Colitis
- Protocol for Kinase activity and phosphorylation assays


Chemical Information
-
CAS No. 23133-56-4
-
Appearance Solid
-
Molecular Weight 510.53
-
Formula C28H30O9
-
Color Off-white to light yellow
-
SMILES
C[C@@]([C@H](OC1=O)C2)(OC3=O)[C@](O[C@@]45C6=O)([C@@]3(CC[C@@]7([H])[C@@]4([H])CC=C(CC=C8)[C@@]7(C8=O)C)O)[C@]6([H])[C@]2([C@@]1([H])CO5)C
-
Structure Classification
-
Initial Source
-
Shipping
Room temperature in continental US; may vary elsewhere.
-
Storage
4°C, protect from light
* In solvent : -80°C, 6 months; -20°C, 1 month (protect from light)


Purity & Documentation
-
Data Sheet (310 KB)
-
SDS (252 KB)
- English - EN (252 KB)
- Français - FR (252 KB)
- Deutsch - DE (252 KB)
- Norwegian - NO (252 KB)
- Español - ES (252 KB)
- Swedish - SV (252 KB)
- Italian - IT (252 KB)
- Korean - KR (252 KB)
- Portuguese - PT (252 KB)
-
Handling Instructions (2659 KB)
References
[1]. Zhang Q, et al. Anti-colitic effects of Physalin B on dextran sodium sulfate-induced BALB/c mice by suppressing multiple inflammatory signaling pathways. Journal of ethnopharmacology. 2020 Sep 15;259:112956. [Content Brief]
[2]. Wang A, et al. Physalin B induces cell cycle arrest and triggers apoptosis in breast cancer cells through modulating p53-dependent apoptotic pathway. Biomedicine & pharmacotherapy = Biomedecine & pharmacotherapie. 2018 May;101:334-341. [Content Brief]
[3]. Zhong R, et al. Physalin B ameliorates inflammatory responses in lipopolysaccharide-induced acute lung injury mice by inhibiting NF-κB and NLRP3 via the activation of the PI3K/Akt pathway. Journal of ethnopharmacology. 2022 Feb 10;284:114777. [Content Brief]
[4]. Ma YM, et al. Physalin B not only inhibits the ubiquitin-proteasome pathway but also induces incomplete autophagic response in human colon cancer cells in vitro. Acta pharmacologica Sinica. 2015 Apr;36(4):517-27. [Content Brief]
[5]. Zhang MH, et al. Physalin B ameliorates nonalcoholic steatohepatitis by stimulating autophagy and NRF2 activation mediated improvement in oxidative stress. Free radical biology & medicine. 2021 Feb 20;164:1-12. [Content Brief]
[6]. Vandenberghe I, et al. Physalin B, a novel inhibitor of the ubiquitin-proteasome pathway, triggers NOXA-associated apoptosis. Biochemical pharmacology. 2008 Aug 15;76(4):453-62. [Content Brief]
[7]. Zhu X, et al. Physalin B attenuates liver fibrosis via suppressing LAP2α-HDAC1-mediated deacetylation of the transcription factor GLI1 and hepatic stellate cell activation. Br J Pharmacol. 2021 Sep;178(17):3428-3447. [Content Brief]

Calculators
Concentration (start) × Volume (start) = Concentration (final) × Volume (final)


Physalin B Related Classifications
HY-N7695 Related Classifications
 Powered by Bioz
Keywords
- Physalin B
- 23133-56-4
- Apoptosis
- NF-κB
- NOD-like Receptor (NLR)
- STAT
- PI3K
- Akt
- Hedgehog
- GSK-3
- p38 MAPK
- ERK
- JNK
- Keap1-Nrf2
- Reactive Oxygen Species (ROS)
- Autophagy
- PI3K/Akt
- MCF-7 human breast cancer cells
- HCT116 colon cancer cells
- NRF2
- STAT3
- Hedgehog signaling pathways
- NLRP3 inflammasome
- LX-2 cells
- RAW 264.7 cells
- Inhibitor
- inhibitor
- inhibit