



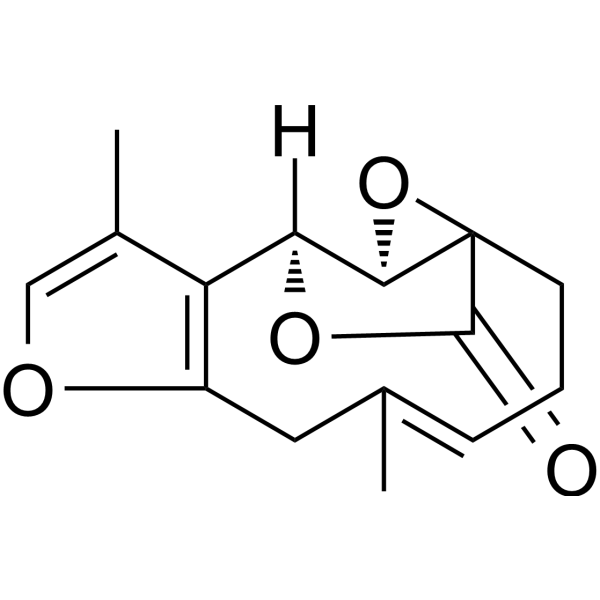
Linderane

Based on 1 Customer Validation
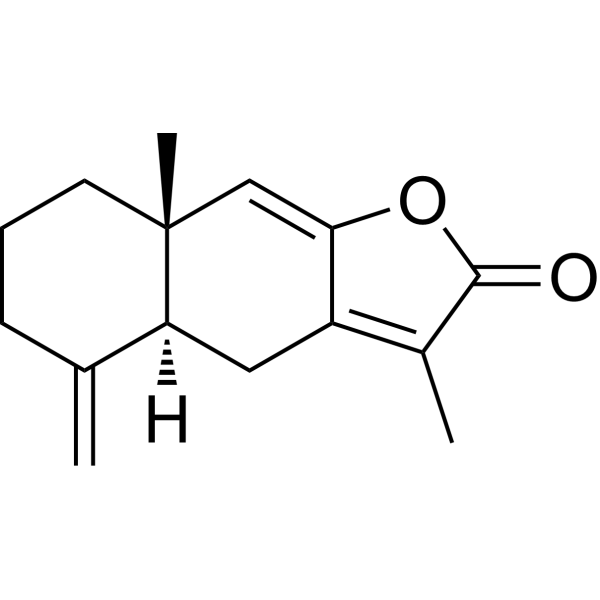
Linderane is an orally active natural sesquiterpene lactone with blood-brain barrier permeability. Linderane indirectly activates PDE3 by activating ERK/STAT3, thereby inhibiting the cAMP/PKA/CREB signaling pathway and hepatic gluconeogenesis. Linderane protects pancreatic β cells against oxidative damage by inhibiting the activation of the p38 MAPK pathway and activating the Nrf2 pathway. Linderane inhibits cell apoptosis and ameliorates intestinal mucosal inflammation by suppressing the IL-6/JAK/STAT3 signaling pathway. Linderane reduces pain sensitivity and alleviates anxiety-like behaviors by activating cannabinoid receptor 2 (CB2R). Linderane can be used in studies related to type 2 diabetes, ulcerative colitis, and chronic inflammatory pain with anxiety.
For research use only. We do not sell to patients.
- Purity : 98.61%
- CAS No.: 13476-25-0
- Formula: C15H16O4
- Molecular Weight:260.29
-
Storage:
4°C, protect from light
* In solvent : -80°C, 6 months; -20°C, 1 month (protect from light)

To place orders, for customer services and technical support, please contact: MedChemExpress USA
Tel: 609-228-6898 E-mail: [email protected] [email protected]


-
 Biological Activity
-
Chemical Information
-
Solvent & Solubility
- Protocols
- Purity & Documentation
- References
-
 Help & FAQs


-
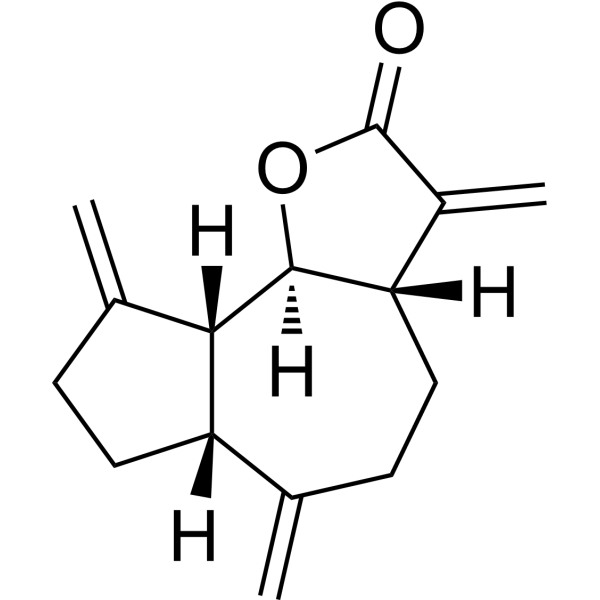
HY-N0591
Dehydrocostus LactoneSesquiterpene -
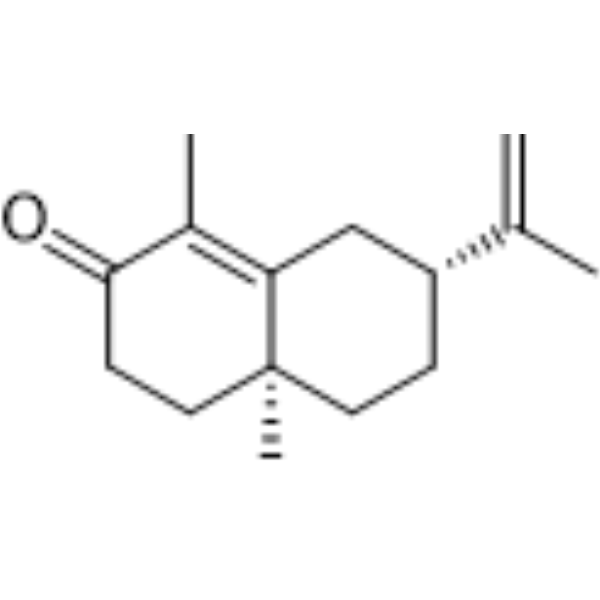
HY-N0710
alpha-CyperoneCOX Inhibitor -
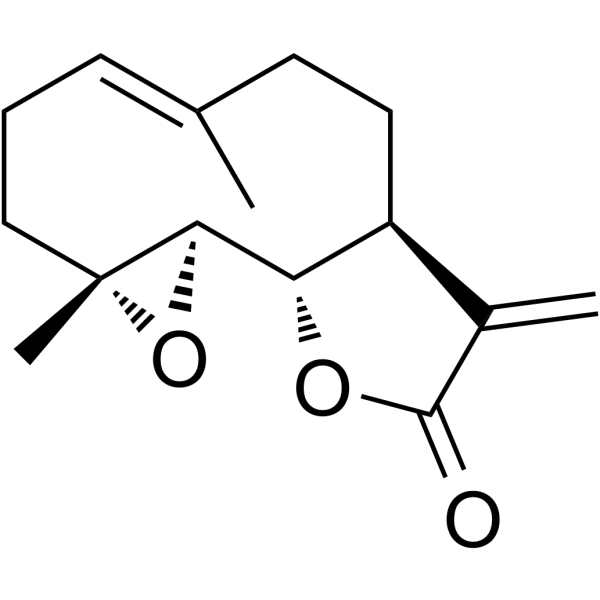
HY-N0141
ParthenolideNF-κB Inhibitor -
HY-N0201
Atractylenolide ITLR4 Antagonist -

HY-N0141R
Parthenolide (Standard)NF-κB Inhibitor -

HY-N0688R
Linderane (Standard)Reference Standard -

HY-N0591R
Dehydrocostus Lactone (Standard)Standard of Dehydrocostus Lactone -

HY-N0201R
Atractylenolide I (Standard)TLR4 Antagonist


Biological Activity
Description
IC50 & Target
|
CYP2 |
In Vitro
Linderane (2.5-20 µM; 5.5 h) inhibits gluconeogenesis in primary rat hepatocytes in a dose-dependent manner under both basal and Forskolin (HY-15371)-stimulated conditions, reduces the expression of Pck1 and G6pc, and this effect depends on the activation of PDE3[1].
Linderane (2.5-20 µM; 2 h) reduces cAMP levels and inhibits CREB phosphorylation in rat primary hepatocytes in a dose- and time-dependent manner under both basal and Forskolin (HY-15371)-stimulated conditions, and this effect depends on the activation of PDE3[1].
Linderane (10-20 µM) indirectly enhances the activities of total PDE and PDE3 (but does not affect PDE4 activity) in primary rat hepatocytes, while exerting no direct effect on purified PDE enzymes[1].
Linderane (2.5-20 µM; 2 h) indirectly activates PDE3 via the ERK/STAT3 pathway in rat primary hepatocytes, and this pathway mediates its inhibitory effects on cAMP accumulation and gluconeogenesis[1].
Linderane (5-20 μM; 24 h) does not impair the viability of untreated INS-1 pancreatic β-cells, but reduces their viability at 40 μM[2].
Linderane (5-20 μM; 14 h) significantly improves the survival rate of INS-1 pancreatic β-cells induced by streptozotocin (STZ) (HY-13753)[2].
Linderane (5-20 μM; 14 h) significantly restores insulin secretion in streptozotocin (STZ)-induced INS-1 pancreatic β cells[2].
Linderane (5-20 μM; 14 h) significantly reduces the apoptosis level of streptozotocin (STZ)-induced INS-1 pancreatic β cells[2].
Linderane (5-20 μM; 14 h) reverses STZ-induced changes in bax and bcl-2 expression, thereby reducing apoptosis of INS-1 pancreatic β-cells[2].
Linderane (5-20 μM; 14 h) significantly inhibits the activation of the p38 MAPK pathway in STZ-induced INS-1 pancreatic β-cells[2].
Linderane (5-20 μM; 14 h) significantly enhances the activation of the Nrf2 signaling pathway in streptozotocin (STZ)-induced INS-1 pancreatic β-cells[2].
Linderane (5-20 μM; 14 h) significantly inhibits reactive oxygen species (ROS) production in streptozotocin (STZ)-induced INS-1 pancreatic β cells[2].
Linderane (5-20 μM; 14 h) significantly restores the activities of antioxidant enzymes SOD, CAT and GPx in streptozotocin (STZ)-induced INS-1 pancreatic β cells[2].
Linderane (12.5-50 μM; 48 h) dose-dependently inhibits IL-6 production and inflammatory responses in LPS (HY-D1056)-stimulated RAW264.7 macrophages[3].
Linderane (3-25 μM) dose-dependently inhibits the IL-6/STAT3 signaling pathway and attenuates IL-6-mediated apoptosis resistance in mouse lymphocytes[3].
Linderane (2.5-10 μM; 3-5 days) effectively inhibits the differentiation of naive CD4+ T cells isolated from splenocytes of C57BL/6 mice into Th17 cells[3].
Linderane (2.5-10 μM; 3-4 days) exerts no significant effect on the differentiation of naive CD4+ T cells isolated from splenocytes of C57BL/6 mice into Treg cells[3].
Linderane (0.1-10 μM; 24 h) dose-dependently inhibits LPS-induced release of IL-6, TNF-α and IL-1β from mouse BV2 microglial cells, with significant effects observed at concentrations of 0.1, 1 and 10 μM after 24 h[4].
Linderane (10 μM; 24 h) promotes the polarization of LPS-stimulated mouse BV2 microglia from the pro-inflammatory M1 phenotype to the anti-inflammatory M2 phenotype after 24 h[4].
MedChemExpress (MCE) has not independently confirmed the accuracy of these methods. They are for reference only.
-
Cell Line:untreated INS-1 pancreatic β cells
-
Concentration:5, 10, 20 and 40 μM
-
Incubation Time:24 h
-
Result:Did not significantly alter cell viability at 5, 10, and 20 μM relative to control cells.
Caused a significant reduction in cell viability at 40 μM relative to control cells.
-
Cell Line:STZ-induced INS-1 pancreatic β cells
-
Concentration:5, 10 and 20 μM
-
Incubation Time:2 h pre-incubation, followed by 12 h co-exposure with 3 mM STZ
-
Result:Significantly improved cell viability compared to STZ-only treated cells, with a dose-dependent trend.
-
Cell Line:STZ-induced INS-1 pancreatic β cells
-
Concentration:5, 10 and 20 μM
-
Incubation Time:2 h pre-incubation, followed by 12 h co-exposure with 3 mM STZ; 30 min incubation with glucose-containing solution post-treatment
-
Result:Significantly increased insulin secretion compared to STZ-only treated cells, with a dose-dependent trend.
-
Cell Line:STZ-induced INS-1 pancreatic β cells
-
Concentration:5, 10 and 20 μM
-
Incubation Time:2 h pre-incubation, followed by 12 h co-exposure with 3 mM STZ; 20 min staining at room temperature
-
Result:Significantly decreased the apoptotic rate compared to STZ-only treated cells, with a dose-dependent reduction.
-
Cell Line:STZ-induced INS-1 pancreatic β cells
-
Concentration:5-20 μM
-
Incubation Time:2 h pre-incubation, followed by 12 h co-exposure with 3 mM STZ
-
Result:Significantly reduced bax expression and increased bcl-2 expression compared to STZ-only treated cells, with a dose-dependent trend.\nSignificantly reduced p-p38 expression compared to STZ-only treated cells, with a dose-dependent reduction in the p-p38/p38 ratio.\nSignificantly increased nuclear Nrf2 and HO-1 expression compared to STZ-only treated cells, with a dose-dependent trend.
-
Cell Line:LPS-stimulated mouse BV2 microglial cells
-
Concentration:0.1, 1 and 10 μM
-
Incubation Time:24 h
-
Result:Dose-dependently reduced LPS-induced increases in IL-6, TNF-α, and IL-1β levels in cell supernatants.
Significantly lowered all three cytokine levels at 10 μM compared to the LPS-only group.
-
Cell Line:LPS-stimulated mouse BV2 microglial cells
-
Concentration:10 μM
-
Incubation Time:24 h
-
Result:Induced reduction in iNOS levels and increase in Arg-1 levels in LPS-stimulated BV2 cells, which were reversed by cotreatment with CB2R antagonist SR144528 (HY-13439).
In Vivo
Linderane (50 mg/kg; p.o.; twice daily; 20 days) improves glucose and lipid metabolism, suppresses hepatic gluconeogenic gene expression, and modulates hepatic PDE, cAMP[1].
Linderane (chronic) improves glucose and lipid metabolism in ob/ob mice with type 2 diabetes mellitus[2].
Linderane (50-100 mg/kg; p.o.; daily; 8 days) alleviates clinical symptoms and histopathological damage in DSS-induced ulcerative colitis in male C57BL/6J mice[3].
Linderane (50 mg/kg; i.g.; once daily; 14 days) alleviates CFA (HY-153808)-induced chronic inflammatory pain and associated anxiety-like behavior in male C57BL/6 mice, reduces pro-inflammatory cytokine levels, and attenuates ACC microglial activation[4].
MedChemExpress (MCE) has not independently confirmed the accuracy of these methods. They are for reference only.
-
Animal Model:C57BL/6J (male, 8-9 weeks old)[1]
-
Dosage:50 mg/kg
-
Administration:p.o.; single dose
-
Result:Elevated hepatic total PDE activity by 33.7%.
Reduced hepatic cAMP concentration.
Increased hepatic phosphorylation of ERK1/2 and STAT3.
Reduced hepatic phosphorylation of CREB.
-
Animal Model:B6.V-Lep^ob/Lep^ob (ob/ob) (male, 6-7 weeks old, genetically obese/type 2 diabetic)[1]
-
Dosage:50 mg/kg
-
Administration:p.o.; twice daily; 20 days
-
Result:Reduced random-fed blood glucose by 49.4% and fast blood glucose by 30.2% after 20 days.
Showed a trend toward reduced HbA1c levels (p=0.066).
Reduced serum triglyceride levels by 26.9% and hepatic triglyceride levels by 28.5%.
Left body weight unchanged.
Reduced hepatic Pck1 mRNA expression by 42.2% and hepatic G6pc mRNA expression by 42.6%.
Showed a trend toward a 28.3% increase in hepatic total PDE activity (p=0.081).
Reduced hepatic cAMP concentration by 22.6%.
Increased hepatic phosphorylation of ERK1/2 and STAT3.
Reduced hepatic phosphorylation of CREB.
-
Animal Model:C57BL/6J (male, 7 weeks old, ulcerative colitis induced by 2.5% w/v DSS in drinking water for 8 days)[3]
-
Dosage:50 mg/kg; 100 mg/kg
-
Administration:p.o.; daily; 8 days
-
Result:Reduced weight loss, improved stool consistency, reduced hematochezia, and significantly increased colon length compared to model control.
Decreased spleen size and spleen index compared to model control.
Significantly reduced proportions of Th17, Treg, and B lymphocytes, and increased percentage of T lymphocytes in mesenteric lymph nodes at 100 mg/kg dose compared to model control.
Attenuated epithelial damage, reduced ulcer number/size, and decreased immune cell infiltration compared to model control.
Downregulated proinflammatory genes including Il1b, Il6, Tnf, Ccl11, Cxcl1, and S100a8, and significantly suppressed STAT3 phosphorylation in colonic tissue at 100 mg/kg dose compared to model control.
-
Animal Model:C57BL/6 (male, 6−8 weeks old, 18 g)[4]
-
Dosage:50 mg/kg
-
Administration:i.g.; once daily; 14 days
-
Result:Increased mechanical pain threshold to ~2.5 g by day 14, thermal pain threshold to ~15 s by day 14, and reduced hind paw swelling to ~0.25 cm by day 14; these effects were significantly weakened by pre-administration of CB2R antagonist SR144528.
Increased OFT central region time to ~150 s and distance to ~1200 cm, and increased EPM open arm entries to ~12, time spent to ~70 s, and distance to ~200 cm; these anxiolytic effects were significantly weakened by pre-administration of CB2R antagonist SR144528.
- Detection of Apoptosis
- TUNEL staining for apoptotic DNA fragmentation
- Annexin V plus membrane-impermeant dye apoptosis staining
- ROS/oxidative-stress fluorescent staining
- DSS-Induced Colitis
- TNBS-Induced Colitis
- Transepithelial/transendothelial electrical resistance assay
- Apoptosis Solutions
- Formalin-Induced Paw Inflammation/Nociceptive Inflammation
- Research Protocol for Inflammation-related Diseases
- Research Protocol for Metabolic Diseases


Chemical Information
-
CAS No. 13476-25-0
-
Appearance Solid
-
Molecular Weight 260.29
-
Formula C15H16O4
-
Color Off-white to light yellow
-
SMILES
O=C(O[C@@]1([H])C2=C3OC=C2C)C4(CC/C=C(C)\C3)[C@@H]1O4
-
Structure Classification
-
Initial Source
-
Shipping
Room temperature in continental US; may vary elsewhere.
-
Storage
4°C, protect from light
* In solvent : -80°C, 6 months; -20°C, 1 month (protect from light)


Solvent & Solubility
In Vitro:
DMSO : 100 mg/mL (384.19 mM; Need ultrasonic; Hygroscopic DMSO has a significant impact on the solubility of product, please use newly opened DMSO)
Please refer to the solubility information to select the appropriate solvent. Once prepared, please aliquot and store the solution to prevent product inactivation from repeated freeze-thaw cycles.
Storage method and period of stock solution: -80°C, 6 months; -20°C, 1 month (protect from light). When stored at -80°C, please use it within 6 months. When stored at -20°C, please use it within 1 month.
Please refer to the solubility information to select the appropriate solvent. Once prepared, please aliquot and store the solution to prevent product inactivation from repeated freeze-thaw cycles.
Storage method and period of stock solution: -80°C, 6 months; -20°C, 1 month (protect from light). When stored at -80°C, please use it within 6 months. When stored at -20°C, please use it within 1 month.
Concentration (start) × Volume (start) = Concentration (final) × Volume (final)
In Vivo:
Select the appropriate dissolution method based on your experimental animal and administration route.
- For the following dissolution methods, please ensure to first prepare a clear stock solution using an In Vitro approach and then sequentially add co-solvents:
- To ensure reliable experimental results, the clarified stock solution can be appropriately stored based on storage conditions. As for the working solution for In Vivo experiments, it is recommended to prepare freshly and use it on the same day.
- The percentages shown for the solvents indicate their volumetric ratio in the final prepared solution. If precipitation or phase separation occurs during preparation, heat and/or sonication can be used to aid dissolution.
In Vivo Dissolution Calculator
Please enter the basic information of animal experiments:
-
-
-
-
Recommended: Prepare an additional quantity of animals to account for potential losses during experiments.
Please enter your animal formula composition:
-
%DMSO +
Recommended: Keep the proportion of DMSO in working solution below 2% if your animal is weak.
-
%+
-
+%Tween-80 + +
-
%Saline +
The co-solvents required include: DMSO, . All of co-solvents are available by MedChemExpress (MCE). , Tween 80. All of co-solvents are available by MedChemExpress (MCE).
Working solution concentration: 0.22 mg/mL
Method for preparing stock solution: mg drug dissolved in μL DMSO. Stock solution concentration: mg/mL. * In solvent : -80°C, 6 months; -20°C, 1 month (protect from light)
1. Take μL DMSO stock solution;
2. Add μL .
μL , mix evenly;
3. Then add μL Tween 80, mix evenly;
4. Then add μL
Please ensure that the stock solution in the first step is dissolved to a clear state, and add co-solvents in sequence. You can use ultrasonic heating (ultrasonic cleaner, recommended frequency 20-40 kHz), vortexing, etc. to assist dissolution.


Purity & Documentation
-
Data Sheet (309 KB)
-
SDS (252 KB)
- English - EN (252 KB)
- Français - FR (252 KB)
- Deutsch - DE (252 KB)
- Norwegian - NO (252 KB)
- Español - ES (252 KB)
- Swedish - SV (252 KB)
- Italian - IT (252 KB)
- Korean - KR (252 KB)
- Portuguese - PT (252 KB)
-
Handling Instructions (2659 KB)
References
[1]. Xie W, et al. Linderane Suppresses Hepatic Gluconeogenesis by Inhibiting the cAMP/PKA/CREB Pathway Through Indirect Activation of PDE 3 via ERK/STAT3. Frontiers in pharmacology. 2018;9:476. [Content Brief]
[2]. Zhang H, et al. Linderane protects pancreatic β cells from streptozotocin (STZ)-induced oxidative damage. Life sciences. 2019 Sep 15;233:116732. [Content Brief]
[3]. Lai H, et al. Linderane from Lindera aggregata attenuates ulcerative colitis by suppressing IL-6/STAT3-mediated Th17 differentiation and apoptosis resistance. Journal of ethnopharmacology. 2026 Feb 28;357:120965. [Content Brief]
[4]. Chen Y, et al. Linderane Attenuates Complete Freund's Adjuvant-Induced Pain and Anxiety in Mice by Restoring Anterior Cingulate Cortex Microglia M2 Polarization through Activating Cannabinoid 2 Receptor. ACS pharmacology & translational science. 2024 Mar 08;7(3):797-808. [Content Brief]


Complete Stock Solution Preparation Table
Please refer to the solubility information to select the appropriate solvent. Once prepared, please aliquot and store the solution to prevent product inactivation from repeated freeze-thaw cycles.
Storage method and period of stock solution: -80°C, 6 months; -20°C, 1 month (protect from light). When stored at -80°C, please use it within 6 months. When stored at -20°C, please use it within 1 month.
| Optional Solvent | Concentration Solvent Mass | 1 mg | 5 mg | 10 mg | 25 mg |
|---|---|---|---|---|---|
| DMSO | 1 mM | 3.8419 mL | 19.2093 mL | 38.4187 mL | 96.0467 mL |
| 5 mM | 0.7684 mL | 3.8419 mL | 7.6837 mL | 19.2093 mL | |
| 10 mM | 0.3842 mL | 1.9209 mL | 3.8419 mL | 9.6047 mL | |
| 15 mM | 0.2561 mL | 1.2806 mL | 2.5612 mL | 6.4031 mL | |
| 20 mM | 0.1921 mL | 0.9605 mL | 1.9209 mL | 4.8023 mL | |
| 25 mM | 0.1537 mL | 0.7684 mL | 1.5367 mL | 3.8419 mL | |
| 30 mM | 0.1281 mL | 0.6403 mL | 1.2806 mL | 3.2016 mL | |
| 40 mM | 0.0960 mL | 0.4802 mL | 0.9605 mL | 2.4012 mL | |
| 50 mM | 0.0768 mL | 0.3842 mL | 0.7684 mL | 1.9209 mL | |
| 60 mM | 0.0640 mL | 0.3202 mL | 0.6403 mL | 1.6008 mL | |
| 80 mM | 0.0480 mL | 0.2401 mL | 0.4802 mL | 1.2006 mL | |
| 100 mM | 0.0384 mL | 0.1921 mL | 0.3842 mL | 0.9605 mL |


Linderane Related Classifications
HY-N0688 Related Classifications
 Powered by Bioz