



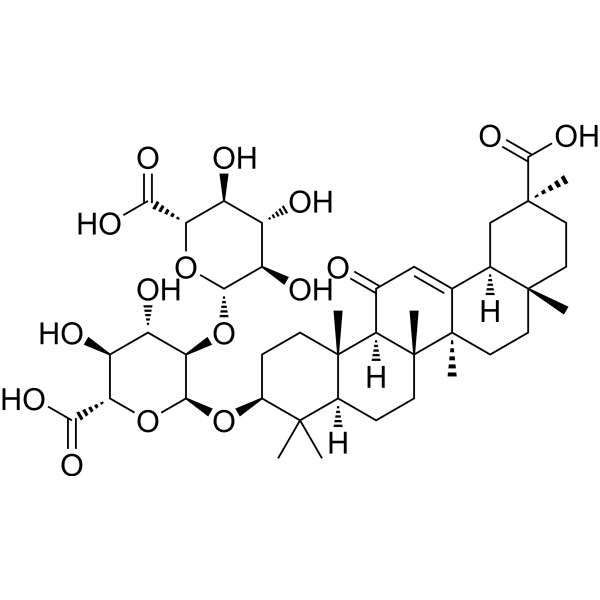
18α-Licorice-saponin H2

Based on 1 Customer Validation
18α-Glycyrrhizic acid (18α-GA; Isoglycyrrhizinic acid; 18α-Glycyrrhizic acid) is a derivative of glycyrrhizic acid with oral activity. 18α-Glycyrrhizic acid exhibits antioxidant, anti-inflammatory, hepatoprotective and cardioprotective activities. 18α-Glycyrrhizic acid protects against ethanol-induced alcoholic liver disease in rats by upregulating the expression levels of SOD, GSH, PPAR-α and CPT-1. 18α-Glycyrrhizic acid shows cytotoxicity against T lymphocytes and inhibits HIV-1 replication in these cells. 18α-Glycyrrhizic acid alleviates oxidative stress by reducing the levels of ROS, Nrf2, HO-1 and p-P65, and alleviates pyroptosis by downregulating the expression levels of NLRP3, GSDMD-N, P20 and c-IL-1β. 18α-Glycyrrhizic acid inhibits autophagy, colonic fibrosis and myocardial fibrosis, and regulates intestinal barrier integrity. 18α-Glycyrrhizic acid can be used in research related to alcoholic liver disease, HIV-1 infection, hepatotoxicity, acute liver failure, inflammatory bowel disease and myocardial fibrosis.
For research use only. We do not sell to patients.
- Purity : 99.90%
- CAS No.: 83896-44-0
- Formula: C42H62O16
- Molecular Weight:822.93
-
Storage:
-20°C, protect from light
* In solvent : -80°C, 6 months; -20°C, 1 month (protect from light)

To place orders, for customer services and technical support, please contact: MedChemExpress USA
Tel: 609-228-6898 E-mail: [email protected] [email protected]


-
 Biological Activity
-
Chemical Information
-
Solvent & Solubility
- Protocols
- Purity & Documentation
- References
-
 Help & FAQs




Biological Activity
Description
In Vitro
18α-Glycyrrhizic acid (0.1-100 μg/mL; 4 days) exhibits cytotoxicity against MT-4 human T lymphocytes with a CD50 of 132 μg/mL; it also inhibits the replication of HIV-1 (strain HIV/EVK) in these cells with an ID50 of 105 μg/mL, resulting in a final selectivity index of 1.26[2].
18α-Glycyrrhizic acid (0.01-1.0 mg/mL; 60 min-30 h) dose-dependently inhibits CCl4- and GalN-induced cytotoxicity in primary cultured rat hepatocytes in vitro[3].
18α-Glycyrrhizic acid (1 mg/mL; 2 h) Magnesium reduces Alectinib (HY-13011)-induced cytotoxicity, increases the survival rate of AML-12 mouse hepatocytes treated with 10 μM Alectinib, alleviates mitochondrial structural damage, restores mitochondrial membrane potential, and enhances the activities of NADH-CoQ reductase and coenzyme Q-cytochrome C reductase[5].
18α-Glycyrrhizic acid (1 mg/mL; 2 h) Magnesium reduces the elevated intracellular ROS level in AML-12 cells treated with 10 μM Alectinib, downregulates the expression of oxidative stress-related proteins (Nrf2, HO-1, p-P65) to alleviate oxidative stress, and decreases the expression levels of pyroptosis-related proteins (NLRP3, GSDMD-N, P20, c-IL-1β) to mitigate pyroptosis[5].
18α-Glycyrrhizic acid (5-320 μg/mL; 1 h pretreatment, 24 h ConA co-treatment) Magnesium reduces ConA (HY-P2149)-induced in vitro death of primary mouse hepatocytes by inhibiting autophagy, without altering hepatocyte apoptosis[6].
MedChemExpress (MCE) has not independently confirmed the accuracy of these methods. They are for reference only. Further protocols information, click here.
-
Cell Line:AML-12 mouse hepatocytes
-
Concentration:1 mg/mL
-
Incubation Time:2 h (pre-incubation); 24 h (alectinib treatment)
-
Result:Exhibited no toxicity to AML-12 cells.
Significantly improved the survival rate of cells treated with 10 μM Alectinib.
-
Cell Line:AML-12 mouse hepatocytes
-
Concentration:1 mg/mL
-
Incubation Time:2 h (pre-incubation prior to Alectinib treatment)
-
Result:Caused a significant reduction in the levels of Nrf2, HO-1, and phosphorylated P65 (p-P65) in AML-12 cells treated with 10 μM Alectinib.\nSignificantly down-regulated the expression levels of NLRP3, GSDMD-N, P20, and cleaved IL-1β (c-IL-1β) in AML-12 cells treated with 10 μM Alectinib.
In Vivo
18α-Glycyrrhizic acid (30 mg/kg; i.p.; single administration) Magnesium significantly ameliorates ConA-induced acute liver failure in male Balb/c mice by inhibiting autophagy, reducing hepatocyte death and inflammatory responses, and improving survival rate[6].
Magnesium isoglycyrrhizinate (1.25-5 mg/kg; i.p.; once daily; for 7 consecutive days) Magnesium dose-dependently ameliorates DSS (HY-116282)-induced acute and chronic colitis in female C57BL/6 mice by reducing inflammation, maintaining intestinal barrier function, inhibiting NF-κB activation, and alleviating colonic fibrosis[7].
18α-Glycyrrhizic acid (25-50 mg/kg/d; i.p.; daily administration; for 14 consecutive days) Magnesium dose-dependently attenuates isoprenaline (HY-B0468)-induced myocardial fibrosis in *Mus musculus* mice[8].
MedChemExpress (MCE) has not independently confirmed the accuracy of these methods. They are for reference only.
-
Animal Model:Sprague-Dawley (SD) (six-week-old male, alcoholic liver disease model via 40% ethanol oral administration once daily for four weeks)[1]
-
Dosage:18α-Glycyrrhizic acid combined with 18β-Glycyrrhizic acid at proportions of 10:0, 8:2, 6:4, 5:5, 4:6, 2:8, 0:10
-
Administration:p.o.; daily; 28 days
-
Result:Significantly reduced ethanol-induced increases in liver index and brown adipose tissue (BAT) index, with the most pronounced reduction in the 4:6 proportion group.
Significantly decreased serum levels of alanine aminotransferase (ALT), aspartate aminotransferase (AST), alkaline phosphatase (ALP), and γ-glutamyl transferase (GGT) compared to the model group, with the strongest reductions observed in the 4:6, 2:8, and 10:0 proportion groups.
Reduced serum, liver, and fecal total cholesterol (TC) and total triglyceride (TG) levels compared to the model group; restored ethanol-altered high-density lipoprotein cholesterol (HDL-C) and low-density lipoprotein cholesterol (LDL-C) levels, with the most profound inhibition of TC and TG seen in the 4:6 and 2:8 proportion groups.
Significantly reversed ethanol-induced decreases in serum and hepatic superoxide dismutase (SOD) and glutathione (GSH) levels, and increases in malonaldehyde (MDA) levels, with the strongest protective effect on oxidative stress observed in the 4:6 and 2:8 proportion groups.
Reduced ethanol-induced hepatocyte enlargement, fatty degeneration, and lipid droplet accumulation compared to the model group, with the 4:6 proportion group showing the greatest reduction in steatosis score.
Significantly reversed ethanol-induced increases in hepatic mRNA and protein levels of sterol regulatory element-binding protein-1c (SREBP-1c) and acetyl-coal carboxylase (ACC), and decreases in peroxisome proliferators activated receptor-α (PPAR-α) and carnitine palmitoyl transferase-1 (CPT-1a) levels, with the most pronounced effects seen in the 4:6 proportion group.
-
Animal Model:Balb/c (male, 8-10 weeks old, Concanavalin A-induced immune liver injury model)[6]
-
Dosage:30 mg/kg
-
Administration:i.p.; single dose
-
Result:Significantly reduced serum alanine aminotransferase (ALT) and aspartate aminotransferase (AST) levels compared to the ConA-only group.
Increased mouse survival rate.
Reduced liver congestion and necrotic area (assessed via H&E staining).
Decreased hepatocyte apoptosis (measured by TUNEL staining).
Reduced autophagosome count, decreased LC3b gene and protein expression, and increased p62 protein expression, indicating inhibition of ConA-induced liver autophagy.
Reduced serum levels of pro-inflammatory cytokines including IL-1β, IL-6, TNF-α, KC, MIP-2, IP-10, GM-CSF, LIF, and IL-12 (p40).
Lowered liver tissue expression of IL-1β, IL-6, TNF-α, KC, MIP-2, and IP-10 mRNA.
Decreased caspase-3 activity in liver tissue and reduced hepatocyte death.
Activation of autophagy with rapamycin reversed all these protective effects.
-
Animal Model:C57BL/6 (female, 6-8 weeks, 20-24 g, acute colitis induced by 2.5% dextran sulfate sodium)[7]
-
Dosage:1.25 mg/kg; 2.5 mg/kg; 5 mg/kg
-
Administration:i.p.; once daily; 7 days
-
Result:Attenuated DSS-induced body weight loss in a dose-dependent manner.
Reduced disease activity index in a dose-dependent manner.
Increased colon length in a dose-dependent manner.
Lowered histological severity scores in a dose-dependent manner.
Decreased abdominal ROS levels in a dose-dependent manner.
Reduced mRNA expression of pro-inflammatory cytokines Il1b, Il6, Il17, Ifng, Tnfa in a dose-dependent manner.
Lowered protein levels of IL-1β, IL-6, TNF-α in a dose-dependent manner.
Suppressed infiltration of CD45+ leukocytes, CD4+ T cells, and F4/80+ macrophages in colon tissue in a dose-dependent manner.
Reversed DSS-induced reductions in mRNA and protein levels of tight junction proteins occludin, ZO-1, claudin-1 and adherens junction protein E-cadherin in a dose-dependent manner.
Decreased serum FITC-dextran levels to reduce intestinal permeability in a dose-dependent manner.
Inhibited NF-κB activation by reducing p-p65 levels in a dose-dependent manner.
Reduced collagen deposition in colon tissue in a dose-dependent manner.
-
Animal Model:C57BL/6 (female, 6-8 weeks, 20-24 g, chronic colitis induced by repeated cycles of 2.5% dextran sulfate sodium)[7]
-
Dosage:5 mg/kg
-
Administration:i.p.; once daily; 7 days during each DSS administration cycle
-
Result:Increased body weight compared to DSS-only mice.
Increased colon length compared to DSS-only mice.
Reduced submucosal edema and mucosal ulceration compared to DSS-only mice.
Lowered histological severity scores compared to DSS-only mice.
Decreased abdominal ROS levels compared to DSS-only mice.
Reduced mRNA expression of pro-inflammatory cytokines Il1b, Il6, Il17, Ifng, Tnfa compared to DSS-only mice.
Suppressed infiltration of CD45+ leukocytes, CD4+ T cells, and F4/80+ macrophages compared to DSS-only mice.
Reversed DSS-induced reductions in tight junction proteins ZO-1, occludin and decrease in claudin-2 levels compared to DSS-only mice.
Inhibited NF-κB activation by reducing p-p65 levels compared to DSS-only mice.
Reduced collagen deposition in colon tissue compared to DSS-only mice.
-
Animal Model:Kunming mice (4-5 weeks old, weight 22 g)[8]
-
Dosage:25 mg/kg/d; 50 mg/kg/d
-
Administration:i.p.; daily; 14 days
-
Result:Reduced ISO-induced myocardial fiber disorder, interstitial hyperplasia, and fibrotic scarring in a dose-dependent manner.
Reduced ANP mRNA expression by 23.32%, c-fos mRNA expression by 23.32%, c-jun mRNA expression by 23.32%, and α-MHC mRNA expression by 17.66% at low dose; reduced ANP mRNA expression by 49.82%, c-fos mRNA expression by 49.82%, c-jun mRNA expression by 49.82%, and α-MHC mRNA expression by 45.35% at high dose.
Reduced NF-κB (p65) protein expression by 40.1% and TLR4 protein expression by 36.9% at low dose; reduced NF-κB (p65) protein expression by 55.3% and TLR4 protein expression by 54.5% at high dose.
Reduced serum CK activity by 22.7% and serum LDH activity by 16.4% at low dose; reduced serum CK activity by 24.5% and serum LDH activity by 22.9% at high dose.


Chemical Information
-
CAS No. 83896-44-0
-
Appearance Solid
-
Molecular Weight 822.93
-
Formula C42H62O16
-
Color White to off-white
-
SMILES
C[C@]12[C@@](C(C=C3[C@]2(CC[C@@]4([C@]3([H])C[C@](C)(CC4)C(O)=O)C)C)=O)([H])[C@@]5([C@@](C(C)([C@H](CC5)O[C@@H]6[C@@H]([C@H]([C@@H]([C@H](O6)C(O)=O)O)O)O[C@@H]7O[C@@H]([C@H]([C@@H]([C@H]7O)O)O)C(O)=O)C)([H])CC1)C
-
Synonyms
18α-GA; Isoglycyrrhizinic acid; 18α-Glycyrrhizic acid
-
Structure Classification
-
Initial Source
-
Shipping
Room temperature in continental US; may vary elsewhere.
-
Storage
-20°C, protect from light
* In solvent : -80°C, 6 months; -20°C, 1 month (protect from light)


Solvent & Solubility
In Vitro:
DMSO : 100 mg/mL (121.52 mM; Need ultrasonic; Hygroscopic DMSO has a significant impact on the solubility of product, please use newly opened DMSO)
Please refer to the solubility information to select the appropriate solvent. Once prepared, please aliquot and store the solution to prevent product inactivation from repeated freeze-thaw cycles.
Storage method and period of stock solution: -80°C, 6 months; -20°C, 1 month (protect from light). When stored at -80°C, please use it within 6 months. When stored at -20°C, please use it within 1 month.
Please refer to the solubility information to select the appropriate solvent. Once prepared, please aliquot and store the solution to prevent product inactivation from repeated freeze-thaw cycles.
Storage method and period of stock solution: -80°C, 6 months; -20°C, 1 month (protect from light). When stored at -80°C, please use it within 6 months. When stored at -20°C, please use it within 1 month.
Concentration (start) × Volume (start) = Concentration (final) × Volume (final)
In Vivo:
Select the appropriate dissolution method based on your experimental animal and administration route.
- For the following dissolution methods, please ensure to first prepare a clear stock solution using an In Vitro approach and then sequentially add co-solvents:
- To ensure reliable experimental results, the clarified stock solution can be appropriately stored based on storage conditions. As for the working solution for In Vivo experiments, it is recommended to prepare freshly and use it on the same day.
- The percentages shown for the solvents indicate their volumetric ratio in the final prepared solution. If precipitation or phase separation occurs during preparation, heat and/or sonication can be used to aid dissolution.
Add each solvent one by one: 10% DMSO 40% PEG300 5% Tween-80 45% Saline
Solubility: ≥ 2.5 mg/mL (3.04 mM); Clear solution
This protocol yields a clear solution of ≥ 2.5 mg/mL (saturation unknown).
Taking 1 mL working solution as an example, add 100 μL DMSO stock solution (25.0 mg/mL) to 400 μL PEG300, and mix evenly; then add 50 μL Tween-80 and mix evenly; then add 450 μL Saline to adjust the volume to 1 mL.
Preparation of Saline: Dissolve 0.9 g sodium chloride in ddH₂O and dilute to 100 mL to obtain a clear Saline solution.
In Vivo Dissolution Calculator
Please enter the basic information of animal experiments:
-
-
-
-
Recommended: Prepare an additional quantity of animals to account for potential losses during experiments.
Please enter your animal formula composition:
-
%DMSO +
Recommended: Keep the proportion of DMSO in working solution below 2% if your animal is weak.
-
%+
-
+%Tween-80 + +
-
%Saline +
The co-solvents required include: DMSO, . All of co-solvents are available by MedChemExpress (MCE). , Tween 80. All of co-solvents are available by MedChemExpress (MCE).
Working solution concentration: 0.22 mg/mL
Method for preparing stock solution: mg drug dissolved in μL DMSO. Stock solution concentration: mg/mL. * In solvent : -80°C, 6 months; -20°C, 1 month (protect from light)
1. Take μL DMSO stock solution;
2. Add μL .
μL , mix evenly;
3. Then add μL Tween 80, mix evenly;
4. Then add μL
Please ensure that the stock solution in the first step is dissolved to a clear state, and add co-solvents in sequence. You can use ultrasonic heating (ultrasonic cleaner, recommended frequency 20-40 kHz), vortexing, etc. to assist dissolution.

Protocols
-
RNA extraction experimental
By lysing cells, releasing RNA, and removing impurities such as proteins and DNA, high-purity RNA products are finally obtained. The commonly used traditional method is the guanidine isothiocyanate/phenol/chloroform method (Trizol), which is suitable for a variety of animal materials including animal tissues, microorganisms, cultured cells, etc., and most plant materials.
-
Collagen: Sirius Red Staining
Sirius Red or picrosirius red staining is a histochemical method for visualizing collagen-rich extracellular matrix in tissue sections, and collagen fibers are detected as red-stained structures under bright-field microscopy with enhanced birefringence under polarized light. Picrosirius red is useful for assessing total collagen organization, distribution, and fibrosis burden, but polarized color should not be interpreted as a definitive collagen type I versus type III readout because color is affected by fiber orientation, thickness, and packing.
-
Research Protocol for Infectious Diseases
Infectious-disease experiments test how pathogens interact with host barriers, innate immune receptors, inflammatory signaling, pathogen replication, and tissue injury; pattern-recognition receptors such as TLRs, RIG-I-like receptors, NOD-like receptors, and inflammasomes detect microbial molecules and activate NF-κB, interferon, and cytokine responses. The central hypothesis is that infection severity reflects the balance between pathogen burden and host response: protective inflammation restricts pathogen growth, whereas excessive or mislocalized inflammation contributes to tissue damage and disease phenotype. Unresolved questions include which host pathways are protective versus pathogenic, why some infection models fail to translate to human disease, and which combined readouts best predict clinically relevant infection outcomes.
-
Mammalian live/dead viability and cytotoxicity staining
Live/dead viability and cytotoxicity staining assays are based on the simultaneous detection of intracellular esterase activity in metabolically active (viable) cells and membrane integrity loss in non-viable cells. In commonly used dual-staining approaches, membrane-permeant fluorogenic substrates are converted by intracellular esterases into fluorescent products in live cells, while impermeant DNA-binding dyes selectively enter cells with compromised plasma membranes and label nucleic acids in dead or dying cells, enabling discrimination between viable and non-viable populations by fluorescence microscopy or flow cytometry.
-
ROS/oxidative-stress fluorescent staining
ROS/oxidative-stress fluorescent staining uses cell-permeant fluorogenic probes that become fluorescent after oxidation inside cells or tissues; commonly used examples include DCFH-DA/DCFDA for broad cellular oxidant detection, DHE for superoxide-related signal detection, MitoSOX for mitochondrial superoxide-related signal detection, and CellROX probes for oxidative-stress-associated fluorescence readouts. The assay detects probe oxidation rather than a single ROS species unless the probe and analysis method have been chemically validated for that species. DCFH-DA enters cells, is deacetylated by intracellular esterases to DCFH, and produces fluorescent DCF after oxidation, so the readout is used as an operational measure of total cellular oxidative stress rather than a species-specific ROS measurement. DHE and MitoSOX can report superoxide-related oxidation, but red fluorescence alone can include non-specific ethidium-like oxidation products; HPLC or optimized spectral approaches are
-
Connective Tissue: Masson's Trichrome/Collagen Trichrome Staining
Masson’s Trichrome (collagen/trichrome staining) is a histological technique that differentially stains tissue compartments using sequential acidic dyes to distinguish collagen from muscle and cytoplasmic components based on dye affinity and tissue permeability differences, enabling visualization of fibrosis and connective tissue architecture in histological sections. The classical formulation typically uses Weigert's iron hematoxylin for nuclear staining, Biebrich scarlet-acid fuchsin for cytoplasm and muscle, and aniline blue (or light green variants) for collagen, producing a characteristic blue/green collagen signal contrasted against red cytoplasm and dark nuclei. The staining principle relies on selective displacement of smaller dye molecules by larger anionic dyes in collagen-rich regions under controlled acidified conditions, which enhances collagen-specific dye retention. This property makes the method widely used for fibrosis assessment in organs such as heart, liver, lung, a
-
Research Protocol for Inflammation-related Diseases
The NLRP3 inflammasome is a cytosolic innate immune signaling platform that integrates priming signals and danger-signal activation to promote caspase-1 activation, maturation of IL-1β and IL-18, and gasdermin D-mediated pyroptotic cell death. The core experimental logic is to determine whether inflammatory disease phenotypes are driven by increased NLRP3 expression, ASC-containing inflammasome assembly, caspase-1 cleavage, GSDMD cleavage, and extracellular release of IL-1β/IL-18 rather than by nonspecific cell injury alone. The pathway is strongly linked to inflammation-related disease phenotypes because monosodium urate crystals activate NALP3/NLRP3 inflammasome signaling in gout-like crystal inflammation, cholesterol crystals activate NLRP3 inflammasomes in atherogenesis models, and DSS-induced intestinal inflammation has been reported to involve NLRP3 inflammasome activity. However, experimental colitis studies also show context-dependent protective effects of NLRP3 inflammasome co
-
Cell Viability Determination by MTT Colorimetric Assay
The following protocol uses the MTT colorimetric assay as a classic literature-established method for assessing cell viability/metabolic activity in cultured mammalian cells. MTT[3-(4,5-dimethylthiazol-2-yl)-2,5-diphenyltetrazolium bromide] is reduced by metabolically active cells to a colored formazan product; the amount of formazan is quantified spectrophotometrically and provides an indirect measure of metabolically active viable cells. Importantly, MTT reduction reflects cellular oxidoreductase/metabolic activity rather than an absolute direct count of living cells, so changes in cellular metabolism can alter the signal independently of cell number.
-
Fibrosis/Collagen Morphometry
Fibrosis and collagen morphometry is based on the quantitative visualization of fibrillar collagen deposition in tissue sections using histochemical stains such as Sirius Red (Picrosirius Red) or Masson's trichrome, followed by image-based or polarization-enhanced analysis to estimate collagen proportional area as a surrogate of extracellular matrix accumulation during fibrotic remodeling. Sirius Red combined with polarized light microscopy enhances detection of collagen fibers due to birefringence properties, enabling more specific visualization of collagen type I and III fibrils compared to conventional bright-field histology, while whole-section or region-restricted digital morphometry reduces field-selection bias in fibrosis assessment. Alternative quantitative approaches include second harmonic generation (SHG) and two-photon excited fluorescence microscopy, which enable label-free detection of fibrillar collagen and have been validated against histological staining and biochemica
-
Cell Cytotoxicity Assay
Cytotoxicity assays are usually based on the assessment of cell membrane damage, which can also be indirectly detected by measuring cell viability. Detection methods include MTT assay, CKK-8 assay, LDH assay and ATP assay, etc.
-
DSS-Induced Colitis
Dextran sulfate sodium (DSS)-induced colitis is generated by administering DSS in mouse drinking water, producing epithelial injury, barrier disruption, weight loss, diarrhea, fecal blood, colon shortening, histologic mucosal damage, and inflammatory mediator changes; the model is mainly used to study acute or chronic intestinal inflammation resembling selected features of ulcerative colitis. DSS injury is interpreted through clinical and tissue readouts rather than a single molecular endpoint: daily body weight, stool consistency, and bleeding are combined into a disease activity index, while colon length, histology, cytokines, myeloperoxidase activity, intestinal permeability, and tight-junction markers provide complementary measures of inflammation and barrier damage.
-
TNBS-Induced Colitis
TNBS-induced colitis is produced by intrarectal delivery of 2,4,6-trinitrobenzene sulfonic acid in ethanol, where ethanol disrupts the mucosal barrier and TNBS haptenates colonic proteins, generating immune-mediated colonic inflammation with weight loss, diarrhea, ulceration, transmural injury, inflammatory-cell infiltration, and cytokine responses. The model is used as an experimental intestinal inflammation model with Crohn’s disease–like features, especially when Th1-type responses, IL-12–dependent inflammation, chronic relapsing inflammation, or fibrosis-related endpoints are studied.
-
Autophagy
Autophagy is a process in which eukaryotic cells use lysosomes to degrade their own cytoplasmic proteins and damaged organelles under the regulation of autophagy related gene (Atg). Microtubule-associated proteins light chain 3 (LC3) is recognized as autophagy marker, which transfers from cytoplasmic LC3 (LC3-I) to membrane type (LC3-II). LC3-II/I ratio could be detected by Western Blot and fluorescence microscopy.
-
Transepithelial/transendothelial electrical resistance assay
TEER measures electrical resistance across epithelial or endothelial monolayers cultured on permeable supports, and the readout reflects ionic conductance through the cell barrier, especially the paracellular pathway regulated by junctional integrity. TEER can be measured without destroying the monolayer and is commonly used before or during transport, permeability, barrier-disruption, and barrier-maturation experiments. TEER values are influenced by biological maturation and technical conditions; reported factors include temperature, medium formulation, passage number, electrode geometry, membrane properties, and junctional length during early monolayer maturation. Therefore, TEER should be interpreted with blank-insert subtraction, area normalization, repeated readings, and, when possible, orthogonal barrier readouts such as FITC-dextran flux or tight-junction staining.
-
Lysosome and acidic-vesicle live-cell staining
Lysosome and acidic-vesicle live-cell staining detects acidic intracellular compartments by using membrane-permeant acidotropic probes that accumulate in low-pH vesicles, including lysosomes, late endosomes, autolysosomes, and acidic phagosomes. LysoTracker staining is commonly used as an intensity-based readout of acidic lysosomal compartment abundance or enlargement, while acridine orange produces green fluorescence in less concentrated compartments and red fluorescence after concentration-dependent accumulation in acidic vesicular organelles. Loss or reduction of acridine-orange red signal can be used as a readout of lysosomal membrane permeabilization or reduced acidic-vesicle integrity. This protocol is designed for live cultured cells and can be adapted for fluorescence microscopy, high-content imaging, plate-reader readout, or flow cytometry when the selected literature supports the readout. Because these dyes report acidotropic accumulation rather than lysosome identity alone,
-
Hepatotoxicity Study
This protocol evaluates hepatotoxicity using complementary in vivo mouse APAP acute liver injury and in vitro hepatocyte-based cytotoxicity readouts. In vivo APAP injury is assessed by serum ALT/AST, liver histology, hepatic glutathione, protein adducts, necrosis, inflammation, and regeneration-related endpoints. In vitro hepatotoxicity is assessed by loss of viability, leakage of ALT/AST/LDH, oxidative-stress markers, mitochondrial function, nuclear morphology, intracellular calcium, and high-content imaging endpoints.
-
Macroautophagy Solutions
Macroautophagy is a conserved lysosome-dependent degradation pathway in which cytoplasmic material is sequestered into double-membrane autophagosomes and delivered to lysosomes for degradation and recycling. The pathway supports cellular homeostasis during nutrient limitation, organelle stress, protein-aggregate accumulation, infection, differentiation, and tissue remodeling by coupling cargo sequestration, autophagosome maturation, lysosomal fusion, and degradation of cargo-derived macromolecules. The core molecular sequence includes initiation by nutrient- and stress-regulated autophagy machinery, autophagosome nucleation, LC3/ATG8-family conjugation to autophagosomal membranes, cargo selection through receptors such as SQSTM1/p62, autophagosome-lysosome fusion, and lysosomal degradation. LC3 was identified as a mammalian homolog of yeast Atg8 that localizes to autophagosomal membranes after processing, and p62/SQSTM1 was shown to connect ubiquitinated cargo with autophagic degradati
-
Pyroptosis Solutions
Pyroptosis is a lytic inflammatory cell-death pathway executed by gasdermin pores, most classically through inflammasome-mediated activation of caspase-1, cleavage of gasdermin D, membrane pore formation, LDH release, and secretion of IL-1β and IL-18. The canonical pathway is commonly modeled by priming cells with an inflammatory signal such as LPS to induce pro-IL-1β and inflammasome components, followed by an activation signal such as ATP or nigericin to activate NLRP3, ASC speck formation, caspase-1 cleavage, GSDMD cleavage, cytokine release, and pyroptotic membrane rupture. The non-canonical pathway is triggered when cytosolic LPS activates mouse caspase-11 or human caspase-4/5, leading to GSDMD cleavage and pyroptosis, and this can secondarily activate NLRP3-dependent IL-1β release. Pyroptosis is linked to inflammatory injury, infection, cancer, liver disease, ocular disease, placental inflammation, and other disease phenotypes, but unresolved questions include which gasdermin fam


Purity & Documentation
-
Data Sheet (299 KB)
-
SDS (252 KB)
- English - EN (252 KB)
- Français - FR (252 KB)
- Deutsch - DE (252 KB)
- Norwegian - NO (252 KB)
- Español - ES (252 KB)
- Swedish - SV (252 KB)
- Italian - IT (252 KB)
- Korean - KR (252 KB)
- Portuguese - PT (252 KB)
-
Handling Instructions (2659 KB)
References
[3]. Kiso Y, et al. Mechanism of antihepatotoxic activity of glycyrrhizin. I: Effect on free radical generation and lipid peroxidation. Planta Med. 1984 Aug;50(4):298-302. [Content Brief]
[5]. Chen Y, et al. Magnesium Isoglycyrrhizinate Alleviates Alectinib-Induced Hepatotoxicity by Inhibiting Mitochondrial Damage-Mediated Pyroptosis. Drug design, development and therapy. 2025;19:6219-6233. [Content Brief]


Complete Stock Solution Preparation Table
Please refer to the solubility information to select the appropriate solvent. Once prepared, please aliquot and store the solution to prevent product inactivation from repeated freeze-thaw cycles.
Storage method and period of stock solution: -80°C, 6 months; -20°C, 1 month (protect from light). When stored at -80°C, please use it within 6 months. When stored at -20°C, please use it within 1 month.
| Optional Solvent | Concentration Solvent Mass | 1 mg | 5 mg | 10 mg | 25 mg |
|---|---|---|---|---|---|
| DMSO | 1 mM | 1.2152 mL | 6.0759 mL | 12.1517 mL | 30.3793 mL |
| 5 mM | 0.2430 mL | 1.2152 mL | 2.4303 mL | 6.0759 mL | |
| 10 mM | 0.1215 mL | 0.6076 mL | 1.2152 mL | 3.0379 mL | |
| 15 mM | 0.0810 mL | 0.4051 mL | 0.8101 mL | 2.0253 mL | |
| 20 mM | 0.0608 mL | 0.3038 mL | 0.6076 mL | 1.5190 mL | |
| 25 mM | 0.0486 mL | 0.2430 mL | 0.4861 mL | 1.2152 mL | |
| 30 mM | 0.0405 mL | 0.2025 mL | 0.4051 mL | 1.0126 mL | |
| 40 mM | 0.0304 mL | 0.1519 mL | 0.3038 mL | 0.7595 mL | |
| 50 mM | 0.0243 mL | 0.1215 mL | 0.2430 mL | 0.6076 mL | |
| 60 mM | 0.0203 mL | 0.1013 mL | 0.2025 mL | 0.5063 mL | |
| 80 mM | 0.0152 mL | 0.0759 mL | 0.1519 mL | 0.3797 mL | |
| 100 mM | 0.0122 mL | 0.0608 mL | 0.1215 mL | 0.3038 mL |


18α-Licorice-saponin H2 Related Classifications
HY-N6911A Related Classifications
 Powered by Bioz
Keywords
- 18α-Licorice-saponin H2
- 83896-44-0
- 18α-GA
- Isoglycyrrhizinic acid
- 18α-Glycyrrhizic acid
- SOD
- PPAR
- Carnitine Palmitoyltransferase (CPT)
- HIV
- Reactive Oxygen Species (ROS)
- Keap1-Nrf2
- Heme Oxygenase (HO)
- NOD-like Receptor (NLR)
- Interleukin Related
- Pyroptosis
- Autophagy
- NF-κB
- TNF Receptor
- ACC
- HIV-1 infection
- SREBP-1c
- TLR4
- alcoholic liver disease
- PPAR-α
- NF-κB p65
- MT-4 human T-lymphocytes
- myocardial fibrosis
- AML-12 mouse hepatocytes
- Inhibitor
- inhibitor
- inhibit