



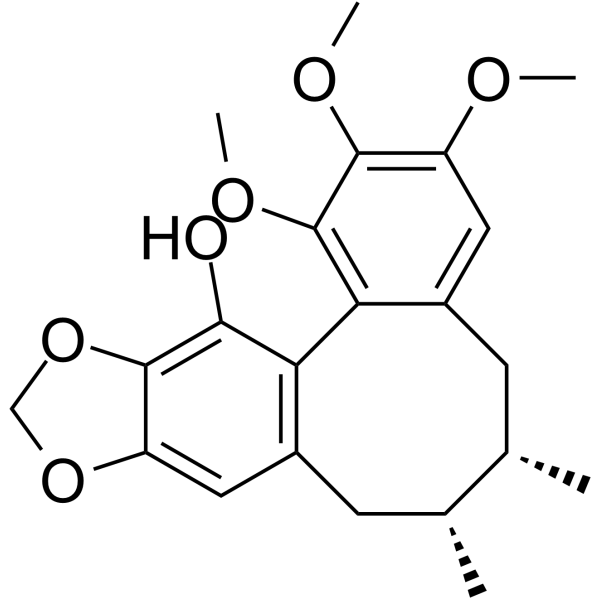
Gomisin M2

Based on 1 Customer Validation
Gomisin M2 ((+)-Gomisin M2) is a lignan isolated from the fruits of Schisandra chinensis with oral availability. Gomisin M2 inhibits STAT1 phosphorylation as well as NF-κB p65 phosphorylation and nuclear translocation. Gomisin M2 reduces inflammatory cell infiltration, cytokine and chemokine expression, and serum IgE and IgG2a levels. Gomisin M2 inhibits MAPK phosphorylation, IκBα degradation, and NF-κB nuclear translocation in keratinocytes. Gomisin M2 induces apoptosis, mitochondrial membrane potential disruption, and cytochrome c release, and inhibits DNA synthesis and mammosphere formation through downregulation of Wnt/β-catenin. Gomisin M2 can be used for research on atopic dermatitis, psoriasis, breast cancer, liver injury, and multidrug-resistant mammary adenocarcinoma.
Nur für Forschungszwecke. Wir verkaufen nicht an Patienten.
- Reinheit : 99.75%
- CAS. Nr.: 82425-45-4
- Formel: C22H26O6
- Molecular Weight:386.44
-
Speicherung:
4°C, protect from light
* In solvent : -80°C, 6 months; -20°C, 1 month (protect from light)

To place orders, for customer services and technical support, please contact: MedChemExpress USA
Tel: 609-228-6898 E-mail: [email protected] [email protected]


-
 Biologische Aktivität
-
Chemical Information
-
Lösungsmittel & Löslichkeit
- Protokoll
- Reinheit & Dokumentation
- Verweise
-
 Help & FAQs


Alle DNA/RNA Synthesis Isoform-spezifische Produkte anzeigen
More

Biologische Aktivität
Beschreibung
|
STAT1 |
NF-κB |
p65 |
IκBα |
p38 MAPK |
Wnt |
β-catenin |
Cellular Effect
|
Cell Line

|
Type | Value | Description | References |
|---|---|---|---|---|
| MDA-MB-231 | IC50 |
60 μM
|
Inhibition of proliferation of human MDA-MB-231 cells assessed by Alamar blue cell viability assay after 48 hrs of treatment.
Inhibition of proliferation of human MDA-MB-231 cells assessed by Alamar blue cell viability assay after 48 hrs of treatment.
|
31612865 |
| HCC1806 | IC50 |
57 μM
|
Inhibition of proliferation of human HCC1806 cells assessed by Alamar blue cell viability assay after 48 hrs of treatment.
Inhibition of proliferation of human HCC1806 cells assessed by Alamar blue cell viability assay after 48 hrs of treatment.
|
31612865 |
| MCF-10A | IC50 |
80 μM
|
Viability of immortalized normal human breast epithelial MCF10A cells assessed by Alamar blue cell viability assay after 48 hrs of treatment, where the IC50 was reported as greater than 80 μM.
Viability of immortalized normal human breast epithelial MCF10A cells assessed by Alamar blue cell viability assay after 48 hrs of treatment, where the IC50 was reported as greater than 80 μM.
|
31612865 |
In Vitro
Gomisin M2 (GM2) (0.1-10 μM; 1 h) inhibits the expression of inflammatory cytokines and chemokines in TNF-α/IFN-γ-stimulated HaCaT cells through the suppression of STAT1 phosphorylation and the nuclear translocation of NF-κB[1].
Gomisin M2 (GM2) (0.1-10 µM; 1 h) reduces the secretion of CCL17 and IL-6 in TNF-α- and IFN-γ-stimulated HaCaT keratinocytes[2].
Gomisin M2 (0.1-10 µM; 1 h) decreases inflammatory gene expression in TNF-α- and IFN-γ-stimulated HaCaT keratinocytes[2].
Gomisin M2 (10 µM; 1 h) inhibits STAT1 phosphorylation and NF-κB translocation in TNF-α- and IFN-γ-activated HaCaT keratinocytes[2].
Gomisin M2 (0.1-10 μM) possesses anti-inflammatory effects on TNF-α and IFN-γ stimulated HaCaT keratinocytes by alleviating PS-associated cytokines and inhibiting mitogen-activated protein kinase phosphorylation[3].
Gomisin M2 (48 h) inhibits MDA-MB-231 and HCC1806 cell viability with IC50 values of 60 and 57 μM respectively, and shows low cytotoxic activity against MCF10A non-cancer cells in vitro[4].
Gomisin M2 (100 μM; 9 days) decreases the size of 3D spheroids formed by MDA-MB-231 and HCC1806 cells over 9 days in culture[4].
Gomisin M2 (5-40 μM; 48 h) dose-dependently increases cytosolic cytochrome c release in MDA-MB-231 and HCC1806 cells after 48 h of treatment[4].
Gomisin M2 (20-80 μM; 48 h) inhibits DNA synthesis and cell proliferation in MDA-MB-231 and HCC1806 cells[4].
Gomisin M2 (5-40 μM; 1-3 days) downregulates the Wnt/β-catenin self-renewal pathway in MDA-MB-231 and HCC1806 cells by decreasing CyclinD1, β-catenin, and p-GSK3β, and increasing p-β-catenin and GSK3-β in a dose- and time-dependent manner[4].
Gomisin M2 (40 μM; 48 h) induces mitochondrial-initiated apoptotic events in MDA-MB-231 and HCC1806 tumor spheres, characterized by increased cell permeability and cytochrome c release, decreased mitochondrial membrane potential, and reduced nuclear intensity[4].
Gomisin M2 (20-80 μM; 48 h) induces apoptosis in MDA-MB-231 and HCC1806 cells in a dose-dependent manner[4].
Gomisin M2 (10-60 μM; 48 h) induces cleavage of caspase-3 and PARP in MDA-MB-231 and HCC1806 cells in a dose-dependent manner[4].
Gomisin M2 (compound 5) (10 µM; 1 h) exhibits moderate hepatoprotective activity against APAP-induced damage in HepG2 cells, resulting in a 43.5% survival rate at 10 µM[5].
MedChemExpress (MCE) has not independently confirmed the accuracy of these methods. They are for reference only. Further protocols information, click here.
-
Cell Line:HaCaT cells
-
Concentration:0.1 μM; 1 μM; 10 μM
-
Incubation Time:1 h (GM2 pretreatment); 6 h (TNF-α/IFN-γ stimulation)
-
Result:Decreased the expression of inflammatory cytokines IL-1β and IL-6 and chemokines CXCL8 and CCL22 compared to TNF-α/IFN-γ-stimulated HaCaT cells.
-
Cell Line:HaCaT
-
Concentration:0.1 μM; 1 μM; 10 μM
-
Incubation Time:1 h (GM2); 15 h (TNF-α and IFN-γ)
-
Result:Significantly reduced the secretion of CCL17 and IL-6 in a dose-dependent manner compared with the TNF-α- and IFN-γ-stimulated group.
-
Cell Line:HaCaT
-
Concentration:0.1 μM; 1 μM; 10 μM
-
Incubation Time:1 h (GM2); 6 h (TNF-α and IFN-γ)
-
Result:Significantly reduced the expression of cytokines and chemokines, including CCL17, IL-8, IL-6 and IL-1β, in a dose-dependent manner compared with the TNF-α- and IFN-γ-stimulated group.
-
Cell Line:HaCaT
-
Concentration:10 µM
-
Incubation Time:1 h (GM2); 15 min (TNF-α and IFN-γ)
-
Result:Significantly inhibited the phosphorylation of STAT1, the translocation of NF-κB and the degradation of IκBα compared with the TNF-α- and IFN-γ-stimulated group.
-
Cell Line:MDA-MB-231, HCC1806
-
Concentration:100 μM
-
Incubation Time:9 days
-
Result:Significantly decreased the cross-sectional spheroid area over 9 days in culture.
-
Cell Line:MDA-MB-231, HCC1806
-
Concentration:40 μM
-
Incubation Time:48 h
-
Result:Increased fluorescence intensity of cell permeability and cytochrome c, and significantly decreased mitochondrial membrane potential (MMP).
Decreased total nuclear intensity of blue fluorescence.
-
Cell Line:MDA-MB-231, HCC1806
-
Concentration:5-40 μM (MDA-MB-231); 7.5-60 μM (HCC1806)
-
Incubation Time:48 h
-
Result:Significantly increased the expression of cytochrome c.
-
Cell Line:MDA-MB-231, HCC1806
-
Concentration:20 μM; 40 μM; 80 μM
-
Incubation Time:48 h
-
Result:Significantly increased the number of apoptotic cells in a dose-dependent manner.
-
Cell Line:MDA-MB-231, HCC1806
-
Concentration:20 μM; 40 μM; 80 μM
-
Incubation Time:48 h
-
Result:Inhibited DNA synthesis and cell proliferation in MDA-MB-231 and HCC1806 cells.
-
Cell Line:MDA-MB-231, HCC1806
-
Concentration:5 μM; 10 μM; 20 μM; 40 μM
-
Incubation Time:1-3 days
-
Result:Significantly downregulated CyclinD1, β-catenin, and p-GSK3β, and upregulated p-β-catenin and GSK3-β in a dose- and time-dependent manner.
-
Cell Line:HepG2
-
Concentration:10 µM
-
Incubation Time:1 h
-
Result:Exhibited moderate hepatoprotective activity against APAP-induced damage, resulting in a survival rate of 43.5%.
-
Cell Line:MCF-7/ADR
-
Concentration:25, 20 μM (Gomisin M2); 1.25, 2.5, 5, 10, 20 μM (Adriamycin)
-
Incubation Time:1 h (Gomisin M2 pre-incubation)
-
Result:Reduced the IC50 of adriamycin to 3.0 μM at 25 μM, corresponding to a reversal fold of 23.6.
Reduced the IC50 of adriamycin to 4.3 μM at 20 μM, corresponding to a reversal fold of 16.5.
In Vivo
Gomisin M2 (0.1-10 mg/kg; p.o.; daily; 7 consecutive days) dose-dependently alleviates IMQ-induced psoriasis-like skin inflammation by reducing skin thickness, PASI scores, TEWL, inflammatory gene expression, serum inflammatory proteins, and Th1/Th17 cell populations[2].
Gomisin M2 (0.1-10 mg/kg; p.o.) possesses anti-inflammatory effects on psoriasis-like skin inflammation, reducing symptoms and Th1/Th17-related cytokine production in a dose-dependent manner[3].
Gomisin M2 (10 μM; water exposure; single treatment) effectively suppresses the growth and proliferation of CSC-enriched breast cancer cells in a zebrafish xenograft model, demonstrating in vivo anti-BCSC activity at a concentration two-fold lower than that required to suppress tumor sphere formation in vitro[4].
MedChemExpress (MCE) has not independently confirmed the accuracy of these methods. They are for reference only.
-
Animal Model:BALB/c mice[1]
-
Dosage:0.1 mg/kg; 1 mg/kg; 10 mg/kg
-
Administration:p.o.; five consecutive days per week; two weeks
-
Result:Decreased ear thickness in a dose-dependent manner.
Decreased epidermal and dermal thickness of the ears.
Reduced infiltration of tissue eosinophils and mast cells.
Suppressed expressions of CD4 and CD44 in AD-like skin at 10 mg/kg.
Decreased expression of IL-1β, IL-4, IL-5, IL-6, IL-12a, and TSLP in ear tissue.
Reduced IFN-γ, IL-4, and IL-17A in draining lymph nodes.
Inhibited phosphorylation of STAT1 and NF-κB p65 in ear tissues.
Reduced serum levels of DFE-specific IgE, total IgE, and IgG2a.
Reduced protein levels of IL-4, IL-6, and TSLP in ear tissue.
-
Animal Model:C57BL/6J (female, 8 weeks old, 18-20 g)[2]
-
Dosage:0.1 mg/kg; 1 mg/kg; 10 mg/kg
-
Administration:p.o.; daily; 7 consecutive days
-
Result:Dose-dependently alleviated psoriasis characteristics including epidermis, dermis and skin thickness, epidermal hyperplasia, dry skin, and immune cell infiltration.
Decreased IMQ-induced TEWL and dose-dependently alleviated PASI score.
Decreased IMQ-induced infiltration of MPO-related cells, mast cells, and CD4+ cells into the skin.
Alleviated gene expression levels of CXCL1, IL-1β, IFN-γ, IL-17A, IL-23, and TNF-α in back skin.
Dose-dependently reduced serum levels of MPO, TNF-α, and IgG2a.
Significantly decreased spleen weights and significantly decreased CD4+ IFN-γ+ IL-17A+ cell populations in the spleen.
Did not induce pathological increases in skin thickness, PASI score, or TEWL in normal mice without IMQ induction.
-
Animal Model:C57BL/6J (female)[3]
-
Dosage:0.1 mg/kg; 1 mg/kg; 10 mg/kg
-
Administration:p.o.
-
Result:Reduced symptoms of psoriasis-like skin inflammation based on Psoriasis Area and Severity Index and histological observation.
Reduced serum levels of TNF-α, IgG2a, and myeloperoxidase.
Decreased MPO-associated cell infiltration in skin tissue in a dose-dependent manner.
Decreased production of Th1 and Th17-related cytokines such as TNF-α, IFN-γ, IL-8, IL-1β and IL-17A in the back skin.
-
Animal Model:wild-type AB strain (embryos at 2 days post-fertilization)[4]
-
Dosage:10 μM
-
Administration:water exposure; single treatment
-
Result:Reduced the growth and proliferation of CSC-enriched MDA-MB-231 or HCC1806 cells.
Decreased fluorescence intensity gradually over 48 h compared with the control group.
Increased the percentages of embryos without proliferation at 48 h compared with the DMSO group.


Chemical Information
-
CAS. Nr. 82425-45-4
-
Appearance Solid
-
Molecular Weight 386.44
-
Formel C22H26O6
-
Color White to yellow
-
SMILES
OC1=C(OCO2)C2=CC3=C1C4=C(OC)C(OC)=C(OC)C=C4C[C@H](C)[C@H](C)C3
-
Synonyms
(+)-Gomisin M2
-
Structure Classification
-
Initial Source
-
Versand
Room temperature in continental US; may vary elsewhere.
-
Speicherung
4°C, protect from light
* In solvent : -80°C, 6 months; -20°C, 1 month (protect from light)


Lösungsmittel & Löslichkeit
In Vitro:
DMSO : 100 mg/mL (258.77 mM; Need ultrasonic; Hygroscopic DMSO has a significant impact on the solubility of product, please use newly opened DMSO)
Please refer to the solubility information to select the appropriate solvent. Once prepared, please aliquot and store the solution to prevent product inactivation from repeated freeze-thaw cycles.
Storage method and period of stock solution: -80°C, 6 months; -20°C, 1 month (protect from light). When stored at -80°C, please use it within 6 months. When stored at -20°C, please use it within 1 month.
Please refer to the solubility information to select the appropriate solvent. Once prepared, please aliquot and store the solution to prevent product inactivation from repeated freeze-thaw cycles.
Storage method and period of stock solution: -80°C, 6 months; -20°C, 1 month (protect from light). When stored at -80°C, please use it within 6 months. When stored at -20°C, please use it within 1 month.
Konzentration (Stammlösung) × Volumen (Stammlösung) = Konzentration (Ziellösung) × Volumen (Ziellösung)
In Vivo:
Select the appropriate dissolution method based on your experimental animal and administration route.
- For the following dissolution methods, please ensure to first prepare a clear stock solution using an In Vitro approach and then sequentially add co-solvents:
- To ensure reliable experimental results, the clarified stock solution can be appropriately stored based on storage conditions. As for the working solution for In Vivo experiments, it is recommended to prepare freshly and use it on the same day.
- The percentages shown for the solvents indicate their volumetric ratio in the final prepared solution. If precipitation or phase separation occurs during preparation, heat and/or sonication can be used to aid dissolution.
Add each solvent one by one: 10% DMSO 40% PEG300 5% Tween-80 45% Saline
Solubility: ≥ 2.5 mg/mL (6.47 mM); Clear solution
This protocol yields a clear solution of ≥ 2.5 mg/mL (saturation unknown).
Taking 1 mL working solution as an example, add 100 μL DMSO stock solution (25.0 mg/mL) to 400 μL PEG300, and mix evenly; then add 50 μL Tween-80 and mix evenly; then add 450 μL Saline to adjust the volume to 1 mL.
Preparation of Saline: Dissolve 0.9 g sodium chloride in ddH₂O and dilute to 100 mL to obtain a clear Saline solution.
In Vivo Dissolution Calculator
Please enter the basic information of animal experiments:
-
-
-
-
Recommended: Prepare an additional quantity of animals to account for potential losses during experiments.
Please enter your animal formula composition:
-
%DMSO +
Recommended: Keep the proportion of DMSO in working solution below 2% if your animal is weak.
-
%+
-
+%Tween-80 + +
-
%Saline +
The co-solvents required include: DMSO, . All of co-solvents are available by MedChemExpress (MCE). , Tween 80. All of co-solvents are available by MedChemExpress (MCE).
Working solution concentration: 0.22 mg/mL
Method for preparing stock solution: mg drug dissolved in μL DMSO. Stock solution concentration: mg/mL. * In solvent : -80°C, 6 months; -20°C, 1 month (protect from light)
1. Take μL DMSO stock solution;
2. Add μL .
μL , mix evenly;
3. Then add μL Tween 80, mix evenly;
4. Then add μL
Please ensure that the stock solution in the first step is dissolved to a clear state, and add co-solvents in sequence. You can use ultrasonic heating (ultrasonic cleaner, recommended frequency 20-40 kHz), vortexing, etc. to assist dissolution.

Protokoll
-
Western Blot
Western blotting (WB) is a commonly used experimental method in molecular biology, biochemistry, and immunogenetics for identifying and quantifying target proteins. It combines gel electrophoresis with immunoassay, enabling researchers to analyze protein expression, post-translational modifications, and molecular weight.
-
RNA extraction experimental
By lysing cells, releasing RNA, and removing impurities such as proteins and DNA, high-purity RNA products are finally obtained. The commonly used traditional method is the guanidine isothiocyanate/phenol/chloroform method (Trizol), which is suitable for a variety of animal materials including animal tissues, microorganisms, cultured cells, etc., and most plant materials.
-
Mitochondrial membrane-potential fluorescent assay
Mitochondrial membrane potential fluorescent assays estimate ΔΨm in living cells using lipophilic cationic dyes such as TMRM, TMRE, rhodamine 123, and JC-1, which accumulate in mitochondria according to membrane polarization; loss of signal after FCCP or CCCP treatment is interpreted as mitochondrial depolarization. TMRM/TMRE and rhodamine 123 are commonly used for semi-quantitative live-cell microscopy or flow cytometry, while JC-1 can report a shift from red aggregate fluorescence to green monomer fluorescence during depolarization; interpretation requires controls because dye concentration, quenching mode, cell type, dye efflux, and mitochondrial mass can affect fluorescence independently of ΔΨm.
-
Annexin V plus membrane-impermeant dye apoptosis staining
Annexin V-based apoptosis assays rely on the detection of phosphatidylserine (PS) externalization from the inner leaflet of the plasma membrane to the outer leaflet, an early biochemical hallmark of apoptosis. Fluorescently labeled Annexin V binds PS in a calcium-dependent manner, enabling identification of early apoptotic cells by flow cytometry or fluorescence microscopy. When combined with a membrane-impermeant DNA-binding dye (e. g. , propidium iodide), this approach allows discrimination between viable (Annexin V−/dye−), early apoptotic (Annexin V+/dye−), and late apoptotic or necrotic (Annexin V+/dye+) cell populations by assessing membrane integrity and PS exposure.
-
BrdU Incorporation Assay
Bromodeoxyuridine (BrdU) incorporation assay is based on the principle that BrdU, a thymidine analog, is incorporated into newly synthesized DNA during the S phase of the cell cycle, thereby serving as a marker of DNA replication and cellular proliferation. Incorporated BrdU can be detected using anti-BrdU antibodies following DNA denaturation, enabling visualization or quantification of proliferating cells through immunochemical detection methods such as immunofluorescence or immunohistochemistry.
-
Research Protocol for Inflammation-related Diseases
The NLRP3 inflammasome is a cytosolic innate immune signaling platform that integrates priming signals and danger-signal activation to promote caspase-1 activation, maturation of IL-1β and IL-18, and gasdermin D-mediated pyroptotic cell death. The core experimental logic is to determine whether inflammatory disease phenotypes are driven by increased NLRP3 expression, ASC-containing inflammasome assembly, caspase-1 cleavage, GSDMD cleavage, and extracellular release of IL-1β/IL-18 rather than by nonspecific cell injury alone. The pathway is strongly linked to inflammation-related disease phenotypes because monosodium urate crystals activate NALP3/NLRP3 inflammasome signaling in gout-like crystal inflammation, cholesterol crystals activate NLRP3 inflammasomes in atherogenesis models, and DSS-induced intestinal inflammation has been reported to involve NLRP3 inflammasome activity. However, experimental colitis studies also show context-dependent protective effects of NLRP3 inflammasome co
-
Breast Cancer Modeling
Breast cancer is a heterogeneous cancer, and it has been distinguished into four subtypes: luminal A, luminal B, HER2-positive and basal-like. Molecular mutations, epigenetic alterations, hormone exposure and immune microenvironment are related to the progression of breast cancer.
-
Kinase activity and phosphorylation assays
Kinase activity assays measure the ability of kinases to transfer phosphate groups from ATP to specific substrates, while phosphorylation assays detect the presence and levels of phosphorylated proteins. Common methods include radiolabeled ATP incorporation (e. g. ,), ADP release detection via bioluminescence (e. g. ,[3]), enzyme-linked immunosorbent assays (ELISA) for phospho-specific epitopes (e. g. ,[6]), and microtiter-based formats for high-throughput screening (e. g. ,[8]). The ADP-Glo assay quantifies kinase activity by measuring ADP produced during phosphorylation using a luciferase-based system. Radiometric assays involve autoradiography or scintillation counting after incorporation of 32P-labeled ATP into substrate proteins. ELISA-based approaches rely on phospho-specific antibodies to detect activated kinases in cell lysates or purified samples.
-
Cytoplasmic-Nuclear Fractionated Protein Extraction
Cytoplasmic-nuclear fractionated protein extraction separates soluble cytoplasmic proteins from nuclear-enriched proteins by mild plasma-membrane permeabilization, differential centrifugation, washing of nuclei, and extraction of nuclear proteins for downstream immunoblotting or related molecular analysis. The readout is the relative abundance of a protein in cytoplasmic and nuclear fractions, commonly assessed by western blotting together with compartment markers such as tubulin or pyruvate kinase for cytoplasm and lamin, nucleoporin, hnRNP, H2AX, or Lamin B for nuclear fractions.
-
EdU Incorporation Assay (Click Chemistry-Based DNA Synthesis Measurement)
The EdU incorporation assay measures DNA synthesis by adding the thymidine analog 5-ethynyl-2′-deoxyuridine to cells or tissues, where it is incorporated into newly synthesized DNA during S phase. Incorporated EdU is detected by copper-catalyzed azide-alkyne cycloaddition, in which a fluorescent azide covalently reacts with the ethynyl group on EdU, allowing S-phase cells to be detected by fluorescence microscopy, flow cytometry, or high-content imaging. EdU detection does not require DNA denaturation or anti-BrdU antibody access, which preserves sample structure and improves compatibility with immunostaining and multiparameter cytometry compared with BrdU-based detection. EdU can be cytotoxic in a cell-type- and exposure-dependent manner, so pulse duration, concentration, and continuous-labeling designs should be validated for each cell type.
-
Detection of Apoptosis
Apoptosis, also called programmed cell death, is generally characterized by distinct morphological characteristics.
-
TUNEL staining for apoptotic DNA fragmentation
TUNEL staining detects DNA strand breaks by using terminal deoxynucleotidyl transferase to add labeled nucleotides to exposed 3′-OH DNA termini, generating either microscopic staining in fixed cells or tissue sections, or fluorescence/cytometric signal in cell suspensions. TUNEL positivity reflects DNA fragmentation but should not be interpreted alone as definitive apoptosis, because TUNEL can also label necrotic, autolytic, mechanically damaged, or DNA-repair-associated DNA breaks.
-
Imiquimod-Induced Psoriasiform Dermatitis
Imiquimod (IMQ)-induced psoriasiform dermatitis is a widely used murine model in which topical application of IMQ, a Toll-like receptor 7 (TLR7) agonist, triggers innate immune activation in the skin and induces a psoriasis-like inflammatory cascade characterized by epidermal hyperplasia, immune cell infiltration, and cytokine production dominated by the IL-23/IL-17 axis. This inflammatory response is mediated through activation of dendritic cells and downstream induction of IL-23, IL-17A, IL-22, and related pro-inflammatory mediators, recapitulating key features of human plaque psoriasis and enabling mechanistic and therapeutic studies. The model is commonly induced using Aldara (5% IMQ cream) applied topically to murine skin, resulting in rapid onset of erythema, scaling, and thickening that can be quantified as disease severity indices and validated histologically.
-
Fluorescent plasma-membrane potential dye assay
Fluorescent plasma-membrane potential dye assays measure changes in cell membrane potential using voltage-sensitive dyes whose fluorescence changes when cells depolarize or hyperpolarize. Anionic bis-oxonol dyes such as DiBAC4(3) enter depolarized cells more readily and show increased fluorescence after intracellular binding, while hyperpolarization reduces dye accumulation and fluorescence. FMP/FLIPR membrane-potential dyes are used for faster, homogeneous microplate assays of ion-channel or receptor-mediated membrane-potential changes.
-
TPA/Croton Oil Ear Edema and Dermatitis
The TPA (12-O-tetradecanoylphorbol-13-acetate) and croton oil-induced mouse ear edema model is a well-established acute cutaneous inflammation system used to evaluate topical anti-inflammatory activity by measuring edema formation, neutrophil infiltration, vascular permeability, and cytokine-mediated skin responses in vivo. The inflammatory response is triggered by topical application of phorbol esters (TPA) or croton oil constituents, leading to rapid activation of protein kinase C signaling, leukocyte recruitment, and increased vascular permeability, which can be quantified by ear thickness, weight, dye extravasation, and biochemical markers such as myeloperoxidase (MPO) activity and pro-inflammatory mediators in ear tissue homogenates. This model is widely used for screening anti-inflammatory agents, where reductions in edema and inflammatory biomarkers reflect suppression of acute dermal inflammation and immune cell infiltration. Histological evaluation typically confirms epidermal
-
Mitochondrial membrane-potential and mitochondrial mass staining
Mitochondrial membrane potential staining measures the electrochemical polarization across the mitochondrial inner membrane in live cells using lipophilic cationic fluorescent probes; early rhodamine-based work showed that selective mitochondrial dye accumulation is lost when the mitochondrial transmembrane potential is dissipated. JC-1 reports mitochondrial polarization by shifting from green monomer fluorescence to red J-aggregate fluorescence as dye concentration increases within energized mitochondria; therefore, the red/green fluorescence ratio is used as a relative readout of mitochondrial membrane potential. TMRE or TMRM staining provides a single-channel relative readout because these cationic rhodamine esters accumulate in polarized mitochondria, and lower fluorescence indicates reduced mitochondrial polarization when acquisition and dye-loading conditions are controlled. Mitochondrial mass staining is commonly performed with MitoTracker Green FM or related MitoTracker dyes as
-
Apoptosis Solutions
Apoptosis is a regulated, generally non-lytic cell-death pathway that removes unwanted, damaged, infected, or abnormal cells through coordinated morphological changes, caspase activation, DNA fragmentation, and membrane remodeling. The intrinsic apoptosis pathway is controlled mainly by mitochondrial outer membrane permeabilization, BCL-2 family proteins, cytochrome c release, apoptosome formation, caspase-9 activation, and downstream executioner caspase-3/7 activation. The extrinsic apoptosis pathway is initiated by death receptors such as Fas, TNFR, and TRAIL receptors, which recruit adaptor proteins and activate caspase-8 before engaging executioner caspases or mitochondrial amplification through BID cleavage. Apoptosis is linked to many phenotypes, including cancer cell killing, tissue homeostasis, immune regulation, neurodegeneration, infection response, and treatment-induced cytotoxicity; unresolved questions include how apoptosis interacts with necroptosis, pyroptosis, ferroptos
-
Protocol for Kinase activity and phosphorylation assays
Kinase activity assays measure transfer of phosphate from ATP to a protein or peptide substrate, generating phosphorylated substrate, ADP, or incorporated radiolabeled phosphate as the readout; phosphorylation assays measure site-specific phosphorylation in cells or tissues as a proxy for kinase-pathway activation, inhibition, or substrate regulation. Phosphorylation can be detected by phospho-specific Western blot, immunoprecipitation kinase assay, phospho-immunofluorescence, phospho-flow cytometry, luminescent ADP detection, radiolabeled ATP incorporation, or reporter-based pathway assays, and these readouts can be applied to cancer cells, primary neurons, mouse tumors, organoids, inflammatory macrophages, ferroptosis studies, and mitophagy studies when the kinase target is biologically relevant.


Reinheit & Dokumentation
-
Data Sheet (320 KB)
-
SDS (252 KB)
- English - EN (252 KB)
- Français - FR (252 KB)
- Deutsch - DE (252 KB)
- Norwegian - NO (252 KB)
- Español - ES (252 KB)
- Swedish - SV (252 KB)
- Italian - IT (252 KB)
- Korean - KR (252 KB)
- Portuguese - PT (252 KB)
-
Handling Instructions (2659 KB)
Verweise


Complete Stock Solution Preparation Table
Please refer to the solubility information to select the appropriate solvent. Once prepared, please aliquot and store the solution to prevent product inactivation from repeated freeze-thaw cycles.
Storage method and period of stock solution: -80°C, 6 months; -20°C, 1 month (protect from light). When stored at -80°C, please use it within 6 months. When stored at -20°C, please use it within 1 month.
| Optional Solvent | Concentration Solvent Mass | 1 mg | 5 mg | 10 mg | 25 mg |
|---|---|---|---|---|---|
| DMSO | 1 mM | 2.5877 mL | 12.9386 mL | 25.8772 mL | 64.6931 mL |
| 5 mM | 0.5175 mL | 2.5877 mL | 5.1754 mL | 12.9386 mL | |
| 10 mM | 0.2588 mL | 1.2939 mL | 2.5877 mL | 6.4693 mL | |
| 15 mM | 0.1725 mL | 0.8626 mL | 1.7251 mL | 4.3129 mL | |
| 20 mM | 0.1294 mL | 0.6469 mL | 1.2939 mL | 3.2347 mL | |
| 25 mM | 0.1035 mL | 0.5175 mL | 1.0351 mL | 2.5877 mL | |
| 30 mM | 0.0863 mL | 0.4313 mL | 0.8626 mL | 2.1564 mL | |
| 40 mM | 0.0647 mL | 0.3235 mL | 0.6469 mL | 1.6173 mL | |
| 50 mM | 0.0518 mL | 0.2588 mL | 0.5175 mL | 1.2939 mL | |
| 60 mM | 0.0431 mL | 0.2156 mL | 0.4313 mL | 1.0782 mL | |
| 80 mM | 0.0323 mL | 0.1617 mL | 0.3235 mL | 0.8087 mL | |
| 100 mM | 0.0259 mL | 0.1294 mL | 0.2588 mL | 0.6469 mL |


Gomisin M2 Related Classifications
HY-N3963 Related Classifications
 Powered by Bioz
Keywords