



Isobavachin
Based on 6 publication(s) in Google Scholar
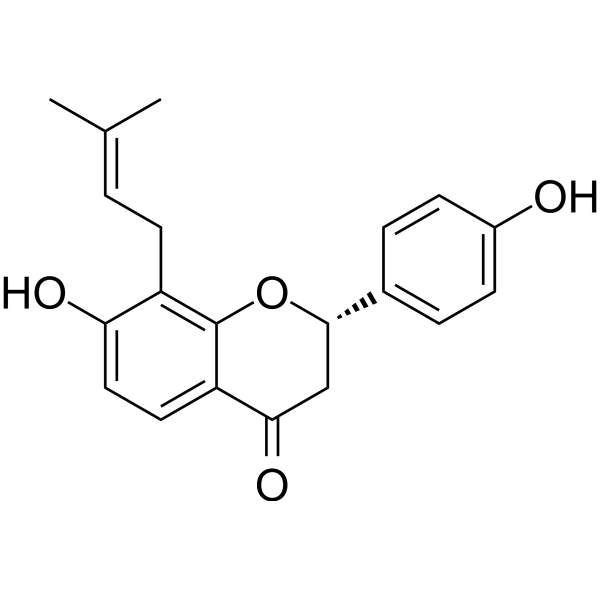
Isobavachin is an orally active, blood-brain barrier-penetrating prenylated flavonoid present in Psoralea corylifolia. Isobavachin inhibits human CYP2B6, CYP2C9, CYP2C19, UGT1A1, UGT1A9, and UGT2B7. Isobavachin suppresses MAPK activation, NF-κB nuclear translocation, overexpression of iNOS/COX-2, FcεRI-mediated signaling pathways, and RANKL-induced osteoclastogenesis. Isobavachin induces autophagy, cytotoxicity, neuronal differentiation, and NRF2 activation; it alleviates oxidative damage, inflammatory responses, apoptosis, iron accumulation, mitochondrial biogenesis, and mast cell degranulation. Isobavachin is applicable to research related to liver injury, inflammatory diseases, osteoporosis, liver cancer, prostate cancer, glioma, periodontitis-induced bone loss, and Alzheimer's disease.
For research use only. We do not sell to patients.
- Purity : 99.88%
- CAS No.: 31524-62-6
- Formula: C20H20O4
- Molecular Weight:324.37
-
Storage:
4°C, protect from light
* In solvent : -80°C, 6 months; -20°C, 1 month (protect from light)

To place orders, for customer services and technical support, please contact: MedChemExpress USA
Tel: 609-228-6898 E-mail: [email protected] [email protected]


-
 Biological Activity
-
Chemical Information
-
Solvent & Solubility
- Protocols
- Purity & Documentation
- References
-
 Help & FAQs


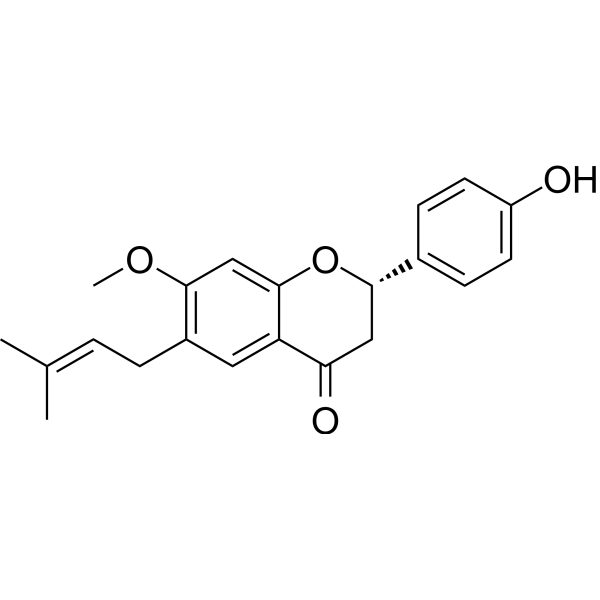
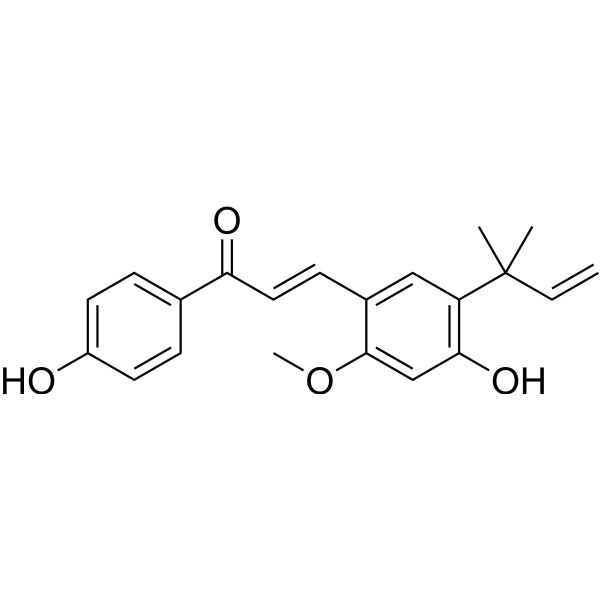
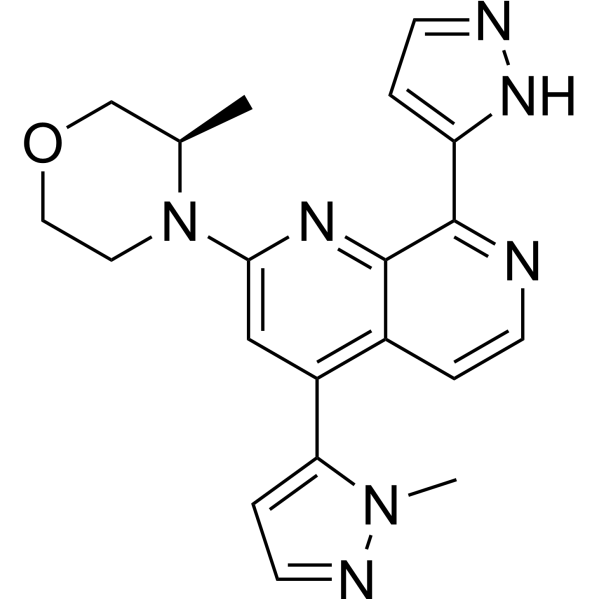
Publications Citing Use of MedChemExpress (MCE) Isobavachin
More Customer Validation & Images

-
Cell Proliferation/Viability Assay

-
IF

-
RT-PCR

-
WB
-
Histological Imaging/Staining


Biological Activity
Description
|
p38 MAPK |
NF-κB |
COX-2 |
iNOS |
CYP2B6 |
CYP2C19 |
CYP2C9 |
Cellular Effect
|
Cell Line

|
Type | Value | Description | References |
|---|---|---|---|---|
| Raji | IC50 |
225 molar ratio
Compound: 10
|
Inhibition of TPA-induced EBV-early antigen activation in human Raji cells
Inhibition of TPA-induced EBV-early antigen activation in human Raji cells
|
[PMID: 16441065] |
| RAW264.7 | IC50 |
47 μM
Compound: 17
|
Antiinflammatory activity in mouse RAW264.7 cells assessed as inhibition of LPS-stimulated nitric oxide production after 24 hrs by Griess method
Antiinflammatory activity in mouse RAW264.7 cells assessed as inhibition of LPS-stimulated nitric oxide production after 24 hrs by Griess method
|
[PMID: 26073007] |
In Vitro
Isobavachin (100 nmol/L; from EB stage day 4 to day 8+10) promotes the differentiation of mouse embryonic stem (D3 line) cells into neurons and astrocytes via a mechanism involving protein prenylation, ERK phosphorylation activation, and down-regulation of p38 and JNK phosphorylation[1].
Isobavachin (5-80 μM; 24 h) exerts dose-dependent cytotoxicity in AML12, HepG2, LO2, rat primary hepatocytes, and mouse primary hepatocytes with IC50 values of 35.20 μM, 19.96 μM, 20.74 μM, 55.84 μM, and 56.84 μM, respectively, and autophagy inhibition attenuates this cytotoxicity[2].
Isobavachin (5-80 μM; 24 h) induces dose-dependent LDH leakage in AML12, HepG2, LO2, rat primary hepatocytes, and mouse primary hepatocytes[2].
Isobavachin (20-44 μM; 24 h) dose-dependently elevated autophagosomes, autolysosomes and autophagic vacuoles, enhanced autophagic flux, caused progressive mitochondrial damage and reduced intracellular ATP levels in AML12 cells. All these pro-autophagic effects verified by MDC fluorescence were attenuated by the AMPK inhibitor BAY-3827 (HY-112083)[2].
Isobavachin (20-44 μM; 24 h) upregulates autophagy in AML12 cells via activating the AMPK-ULK1 pathway and inhibiting the PI3K-Akt-mTOR pathway, as shown by altered autophagy-related and signaling protein expression, and these effects are reversed by autophagy or AMPK inhibition[2].
Isobavachin (ISO) binds with high affinity to purified PI3K and AKT proteins, with binding energies of -8.6 kcal/mol and -6.4 kcal/mol, respectively[3].
Isobavachin (IBC) (3.75-30 μM; 3 h pre-incubation, followed by 21 h LPS treatment) inhibits lipopolysaccharide-induced inflammatory responses in RAW264.7 murine macrophages via suppression of the MAPK and NF-κB signaling pathways[4].
Isobavachin (60 min) was metabolized via mono-oxidation and glucuronidation by human and mouse liver/intestine microsomes as well as recombinant CYP1A2/CYP2C19 and UGT isoforms. Oxidation generated metabolites M1-M3 (CLint: 5.53-93.97 μl/min per mg), while glucuronidation produced G1-G2 (CLint: 10.73-202.62 μl/min per mg), indicating higher efficiency of glucuronidation[5].
Isobavachin (1-100 μM; 60 min) potently inhibits recombinant human CYP2B6 (Ki = 1.93 μM), CYP2C9 (Ki = 0.22 μM), and CYP2C19 (Ki = 1.55 μM) with dose-dependent, isoform-specific inhibition modes[5].
Isobavachin (1-100 μM; 60 min) potently inhibits recombinant human UGT1A1 (Ki = 3.05 μM), UGT1A9 (Ki = 0.44 μM), and UGT2B7 (Ki = 0.05 μM) with dose-dependent, isoform-specific inhibition modes[5].
Isobavachin (10 μM; 60 min)'s mono-oxidation and glucuronidation in individual human liver microsomes are significantly correlated with the activity of CYP1A2, CYP2C19, UGT1A1, and UGT1A9[5].
Isobavachin (Iso) (1-10 μM; 1 h pre-incubation, 5-15 min Ag stimulation) concentration-dependently inhibits IgE/Ag-stimulated degranulation, eicosanoid production, and intracellular Ca2+ elevation in bone marrow-derived mast cells[6].
Isobavachin (1.3-5 μM) concentration-dependently suppresses IgE/Ag-induced inflammatory genes in mast cells, as well as LPS-triggered NO, related transcripts and NF-κB activation in RAW 264.7 and peritoneal macrophages[6].
Isobavachin (10 μM; 1 h pre-incubation, 15 min Ag stimulation) inhibits IgE/Ag-stimulated activation of proximal tyrosine kinases (Fyn, Lyn, Syk, Lck) and their downstream signaling pathways, including NF-κB, in bone marrow-derived mast cells[6].
Isobavachin (10 μM; 5 min-4 h incubation) increases SHP-1 phosphorylation in resting bone marrow-derived mast cells in a Fyn- and Lyn-dependent manner[6].
Isobavachin (10 μM; 1 h pre-incubation, 5 min-4 h Ag stimulation post-48 h SHP-1 siRNA transfection) has inhibitory effects on IgE/Ag-stimulated bone marrow-derived mast cell activation and signaling that are dependent on SHP-1[6].
Isobavachin (7.5-30 μM; days 1-3, days 3-5, days 5-7) inhibits RANKL-induced osteoclastogenesis in bone marrow-derived macrophages in a dose- and time-dependent manner, with an IC50 of 15 μM, and acts primarily during the early to middle stages of differentiation[7].
Isobavachin (15-30 μM; 96 h) downregulates the expression of key osteoclast marker genes and proteins in RANKL-stimulated bone marrow-derived macrophages[7].
Isobavachin (15-30 μM; 5 days) inhibits RANKL-induced F-actin ring formation in bone marrow-derived macrophages in vitro in a dose-dependent manner[7].
Isobavachin (15-30 μM; 7 days) inhibits osteoclast-mediated bone resorption and F-actin ring formation on bone slices in a dose-dependent manner[7].
Isobavachin alters the transcriptome of RANKL-induced osteoclasts, with significant enrichment of genes related to iron ion homeostasis, ROS metabolism, and the MAPK signaling pathway[7].
Isobavachin (15-30 μM; 48-96 h) reduces cellular iron accumulation in RANKL-induced osteoclasts (bone marrow-derived macrophages and RAW264.7 cells) by upregulating Fpn1 expression and downregulating Tfr1, Ftl1, and Fth1 expression to promote iron efflux[7].
Isobavachin (30 μM; 5 days) suppresses RANKL-induced osteoclastogenesis in RAW264.7 cells by upregulating Fpn1 expression, as demonstrated by partial reversal of IBA's effects with Fpn1 knockdown and enhanced effects with Fpn1 overexpression[7].
Isobavachin (30 μM; 0, 15, 30, 60 min) upregulates Fpn1 expression in RANKL-stimulated RAW264.7 cells by inhibiting the MAPK signaling pathway (P38, JNK, and ERK)[7].
Isobavachin (30 μM; 96 h) inhibits mitochondrial biogenesis and function in RANKL-induced bone marrow-derived macrophages, as evidenced by reduced mitochondrial gene expression, mitochondrial mass, mitochondrial DNA copy number, membrane potential, ROS production, and ATP levels[7].
Isobavachin binds potently and selectively to human recombinant ApoE4 (Kd = 0.54 μM) and human recombinant ApoE3 (Kd = 0.62 μM)[8].
Isobavachin (IBA) (7.5–30 μM) dose- and time-dependently suppressed RANKL-induced osteoclastogenesis in BMMs (IC50 = 15 μM), mainly acting at early-to-middle differentiation stages, and also inhibited osteoclast formation in RAW264.7 cells after 5-day treatment[9].
Isobavachin (15-30 μM) suppressed mRNA and protein levels of osteoclast markers, downregulated iron uptake/storage genes and proteins while upregulating iron efflux FPN1 in RANKL-stimulated BMMs after 96 h incubation. It also lessened total and ferrous iron accumulation in BMMs and RAW264.7 cells. Additionally, it dose-dependently inhibited F-actin ring formation (5 days) and osteoclast-mediated bone resorption (7 days) in BMMs[9].
Isobavachin (30 μM) suppressed RANKL-induced activation of p38, JNK and ERK MAPK pathways in RAW264.7 cells, thereby upregulating FPN1. Its inhibition of RANKL-triggered osteoclastogenesis was partially mediated by FPN1 upregulation and further strengthened by FPN1 overexpression[9].
MedChemExpress (MCE) has not independently confirmed the accuracy of these methods. They are for reference only. Further protocols information, click here.
-
Cell Line:mouse embryonic stem (D3 line) cells
-
Concentration:100 nmol/L
-
Incubation Time:from EB stage day 4 to day 8+10
-
Result:Elevated nestin expression in EBs at day 4 and day 8+0. Time-dependently upregulated neuronal β-tubulin III, astrocytic GFAP and axonal NEFM at day 8+5 and day 8+10, and increased neuron-like cell populations by day 8+10 relative to solvent control.
Suppressed p38 and JNK phosphorylation, while enhanced ERK phosphorylation during late neuronal differentiation.
GGTI-298 co-treatment abrogated the promotive effects on neurons and astrocytes.
-
Cell Line:HepG2, LO2, AML12, rat primary hepatocytes, mouse primary hepatocytes
-
Concentration:5, 10, 20, 30, 40, 50, 60, 70, 80 μM (AML12 cells)
0.625, 1.25, 2.5, 5, 10, 20, 40, 80 μM (HepG2 cells, LO2 cells)
30, 40, 50, 60, 70, 80 μM (Rat primary hepatocytes)
8, 16, 24, 32, 4, 48, 56, 64 μM (mouse primary hepatocytes) -
Incubation Time:24 h
-
Result:Exerted dose-dependent cytotoxicity in AML12, HepG2, LO2, rat primary hepatocytes, and mouse primary hepatocytes with IC50 values of 35.20 μM, 19.96 μM, 20.74 μM, 55.84 μM, and 56.84 μM, respectively, and autophagy inhibition attenuates this cytotoxicity.
-
Cell Line:AML12 cells
-
Concentration:20, 32, 44 μM (general); 32 μM (BAY-3827 (HY-112083) co-treatment)
-
Incubation Time:24 h (isobavachin treatment); 30 min (MDC staining incubation)
-
Result:Elevated MDC fluorescence intensity in a dose-dependent manner, rising by 223.12% at 32 μM and 353.82% at 44 μM relative to the control.
BAY-3827 pretreatment decreased the fluorescence intensity by 48.67% compared with the isobavachin-only group.
-
Cell Line:AML12 cells
-
Concentration:20, 32, 44 μM (general); 32 μM (BAY-3827 co-treatment)
-
Incubation Time:24 h (Ad-mCherry-GFP-LC3B transfection); 24 h (isobavachin treatment)
-
Result:Altered GFP and mCherry fluorescence in a dose-dependent manner to reflect elevated autophagic flux.
BAY-3827 pretreatment reversed such fluorescence changes and suppressed autophagic flux.
-
Cell Line:AML12 cells
-
Concentration:20, 32, 44 μM (general); 32 μM (3-MA (HY-19312) or BAY-3827 co-treatment)
-
Incubation Time:24 h (isobavachin treatment); overnight (primary antibody incubation)
-
Result:Caused dose-dependent increases in LC3II/I, Atg5, and Beclin-1 protein levels, and dose-dependent decreases in p62 protein levels.
Increased p-AMPK and p-ULK1 levels, and decreased p-PI3K, p-Akt, and p-mTOR levels.
Reversed isobavachin-induced changes after pretreatment with 3-MA: p62 levels increased, LC3II/I levels decreased, p-PI3K, p-Akt, and p-mTOR levels increased, and p-ULK1 levels decreased.
Reversed isobavachin-induced changes after pretreatment with BAY-3827: p62 levels increased, LC3II/I levels decreased, p-AMPK and p-ULK1 levels decreased, and p-mTOR levels increased.
-
Cell Line:murine macrophage RAW264.7 cells
-
Concentration:3.75, 7.5, 15, 30 μM
-
Incubation Time:3 h pre-incubation, followed by 21 h LPS treatment
-
Result:Downregulated LPS-induced iNOS and COX-2 mRNA and protein expression in a dose-dependent manner.
Suppressed LPS-induced secretion of TNF-α, IL-6, and IL-1β respectively, at 30 μM.
-
Cell Line:murine macrophage RAW264.7 cells
-
Concentration:3.75, 7.5, 15, 30 μM
-
Incubation Time:3 h pre-incubation, followed by 21 h LPS treatment
-
Result:Reduced LPS-induced NO and PGE2 production in a dose-dependent manner.
Inhibited LPS-induced phosphorylation of ERK, JNK, and p38 MAPK; reduced ERK, JNK, and p38 phosphorylation by 66.5%, 50.2%, and 67.8%, respectively, at 30 μM.
Inhibited LPS-induced phosphorylation and degradation of IκBα, and blocks NF-κB p65 translocation from the cytoplasm to the nucleus.
-
Cell Line:bone marrow-derived mast cells (BMMCs)
-
Concentration:1.3, 2.5, 5 μM
-
Incubation Time:1 h pre-incubation; 4 h Ag stimulation post-pre-incubation
-
Result:Reduced IgE/Ag-induced mRNA expression of TNF-α and IL-6 in a concentration-dependent manner.
-
Cell Line:bone marrow-derived mast cells (BMMCs)
-
Concentration:10 μM
-
Incubation Time:1 h pre-incubation; 15 min Ag stimulation post-pre-incubation
-
Result:Suppressed IgE/Ag-stimulated tyrosine phosphorylation of Fyn, Lyn, Syk, Lck, and LAT.
Reduced phosphorylation of active Lck (Y394) and downstream signaling molecules PLCγ1, AKT, p38, ERK1/2, and JNK.
Reduced IgE/Ag-stimulated phosphorylation of IKK and NF-κB p65.
Inhibited nuclear translocation of NF-κB p65.
-
Cell Line:bone marrow-derived mast cells (BMMCs)
-
Concentration:10 μM
-
Incubation Time:5 min, 10 min, 15 min, 30 min, 1 h, 2 h, 4 h incubation; 1 h incubation post-48 h Fyn/Lyn siRNA transfection
-
Result:Increased tyrosine phosphorylation of SHP-1 (including active site Y564) in resting BMMCs, with maximal phosphorylation observed at 30 min to 1 h.
Suppressed isobavachin-induced SHP-1 phosphorylation in BMMCs treated with Fyn or Lyn siRNA.
-
Cell Line:bone marrow-derived macrophages (BMMs)
-
Concentration:7.5, 15, 30 μM (5 days incubation); 30 μM (days 1-3 incubation); 30 μM (days 3-5 incubation); 30 μM (days 5-7 incubation)
-
Incubation Time:5 days, days 1-3, days 3-5, days 5-7
-
Result:Reduced the number and area of TRAP-positive multinucleated osteoclasts in a dose-dependent manner, with an IC50 of 15 μM.
Decreased osteoclast number and area significantly when administered at 30 μM during the early to middle stages (days 1-3 and days 3-5) of osteoclastogenesis.
Showed no significant effect on osteoclast number and area when administered at 30 μM during the late stage (days 5-7) of osteoclastogenesis.
-
Cell Line:RAW264.7 cells
-
Concentration:7.5, 15, 30 μM
-
Incubation Time:5 days
-
Result:Reduced the number and area of TRAP-positive multinucleated osteoclasts formed from RAW264.7 cells in a dose-dependent manner.
-
Cell Line:RAW264.7 cells
-
Concentration:30 μM
-
Incubation Time:0, 15, 30, 60 min
-
Result:Blocked RANKL-induced phosphorylation of P38, JNK, and ERK in RAW264.7 cells.
Alleviated the IBA-induced upregulation of Fpn1 protein expression via activation of the P38, JNK, or ERK pathways.
-
Cell Line:RANKL-stimulated mouse bone marrow-derived macrophages (BMMs)
-
Concentration:15, 30 μM
-
Incubation Time:96 h
-
Result:Markedly downregulated the mRNA expression of osteoclast-specific genes Trap, Ctsk, Mmp9, Atp6v0d2, and Nfatc1 upregulated by RANKL stimulation.\nReversed RANKL-induced upregulation of Tfr1, Ftl1, and Fth1 mRNA expression.
Strongly upregulated Fpn1 mRNA expression.
-
Cell Line:RANKL-stimulated mouse bone marrow-derived macrophages (BMMs)
-
Concentration:15, 30 μM
-
Incubation Time:96 h
-
Result:Conspicuously inhibited the protein expression levels of NFATc1, MMP9, and CTSK upregulated by RANKL stimulation.\nReversed RANKL-induced upregulation of TFR1, FTL1, and FTH1 protein expression.
Strongly upregulated FPN1 protein expression.
-
Cell Line:RANKL-stimulated mouse RAW264.7 cells
-
Concentration:30 μM
-
Incubation Time:pre-treated before RANKL stimulation; RANKL stimulation for 0, 15, 30, 60 min
-
Result:Blocked RANKL-induced activation of P38, JNK, and ERK MAPK pathways at 15, 30, and 60 min post-stimulation.
-
Cell Line:RANKL-stimulated mouse RAW264.7 cells treated with MAPK activators
-
Concentration:30 μM
-
Incubation Time:incubation with RANKL and MAPK activators
-
Result:Upregulated FPN1 expression, and this effect was alleviated by co-treatment with P38 activator DHC, JNK activator AN, or ERK activator PA.
In Vivo
Isobavachin (IBC) (1-10 μM; immersion; pre-treatment for 3 hours prior to LPS stimulation) potently suppresses LPS-induced inflammatory responses (NO, ROS, neutrophil levels) in zebrafish embryos without reducing survival at these doses[4].
Isobavachin (40 mg/kg; p.o.; single dose) undergoes extensive in vivo metabolism in healthy male KM mice, producing two glucuronide and three mono-oxidated metabolites, with glucuronidation as the dominant metabolic pathway[5].
Isobavachin (Iso) (10-20 mg/kg; p.o.; single dose; 1 h before Ag challenge) dose-dependently attenuates mast cell-mediated passive cutaneous anaphylaxis reactions in mice, with the 20 mg/kg dose showing potency comparable to 50 mg/kg fexofenadine (HY-B0801)[6].
Isobavachin (30 mg/kg; i.p.; once daily; 10 days) alleviates ligature-induced periodontitis-associated alveolar bone loss in C57BL/6 mice by reducing osteoclastogenesis[7].
Isobavachin (30 mg/kg; i.p.; daily; 10 days) significantly reduces alveolar bone loss by inhibiting osteoclastogenesis in a mouse model of ligature-induced periodontitis, with measurable improvements in bone morphometric parameters and reduced osteoclast activity markers[9].
MedChemExpress (MCE) has not independently confirmed the accuracy of these methods. They are for reference only.
-
Animal Model:C57BL/6 J (male, 6 weeks old, 20-25 g, acetaminophen-induced liver injury model)[3]
-
Dosage:10 mg/kg
-
Administration:p.o.; single dose; administered 30 min after acetaminophen exposure
-
Result:Significantly lowered serum ALT and AST, and restored liver color and morphology against acetaminophen-induced injury.
Mitigated hepatic necrosis, hydropic degeneration and inflammation, decreased TUNEL-positive hepatocytes, and normalized Ki67 expression as well as liver-to-body weight ratio.
Reduced TNF-α and IL-1β at protein and mRNA levels, relieved oxidative stress by decreasing MDA and recovering T-SOD and CAT activities.
Modulated the NRF2/KEAP1 pathway, downregulated CYP2E1 and APAP-CYS adducts, and activated PI3K/AKT signaling with elevated BCL2 expression.
-
Animal Model:Tg(mpx:eGFP) (7 hpf embryos; inflammation model via LPS challenge)[4]
-
Dosage:1 μM, 5 μM, 10 μM
-
Administration:immersion; pre-treatment for 3 hours prior to LPS stimulation
-
Result:Significantly suppressed LPS-induced NO production, ROS production, and neutrophil counts.
-
Animal Model:KM mice (male, SPF grade, 6-8-week-old)[5]
-
Dosage:40 mg/kg
-
Administration:p.o.; single dose
-
Result:Identified five metabolites of isobavachin in mouse serum, bile, urine, faeces, and liver: two glucuronides (G1: isobavachin-7-O-glucuronide; G2: isobavachin-4'-O-glucuronide) and three mono-oxidated products (M1, oxidized at the isopentenyl group; M2, oxidized at the B ring; M3, oxidized at the A ring).
Detected glucuronide metabolites as more abundant than mono-oxidated products across all collected biosamples.
-
Animal Model:ICR (male, 7 weeks old)[6]
-
Dosage:10 mg/kg; 20 mg/kg
-
Administration:p.o.; single dose; 1 h before Ag challenge
-
Result:Significantly reduced IgE/Ag-induced Evans blue dye extravasation and serum levels of leukotriene C4 (LTC4) and prostaglandin D2 (PGD2) compared to IgE/Ag alone.
Produced a greater, dose-dependent reduction in dye extravasation and serum LTC4 and PGD2 levels, with inhibitory potency comparable to 50 mg/kg fexofenadine (HY-B0801).
-
Animal Model:C57BL/6 (male, 7-8 weeks old, 22-24 g, ligature-induced periodontitis)[7]
-
Dosage:30 mg/kg
-
Administration:i.p.; once daily; 10 days
-
Result:Reduced CEJ-ABC distance from ~0.5 mm to ~0.35 mm.
Elevated BV/TV (5% to 15%) and Tb.N (0.7 /mm to 1.3 /mm), while lowered Tb.Sp (0.35 mm to 0.28 mm).
Decreased N.Oc/BS (11 /mm to 5 /mm) and Oc.S/BS (17% to 12%), and attenuated CTSK fluorescence intensity (100 to 60).
Enhanced fluorescence intensity of iron exporter FPN1 (100 to 130).
-
Animal Model:C57BL/6 (male, 7-8 weeks old, 22-24 g, ligature-induced periodontitis model)[9]
-
Dosage:30 mg/kg
-
Administration:i.p.; daily; 10 days
-
Result:Reduced CEJ-ABC distance from ~0.5 mm to ~0.35 mm.
Raised BV/TV from ~5% to ~15% and Tb.N from ~0.7 /mm to ~1.3 /mm, and decreased Tb.Sp from ~0.35 mm to ~0.28 mm.
Lowered N.Oc/BS (~11 /mm to ~5 /mm) and Oc.S/BS (~17% to ~12%), and reduced CTSK fluorescence intensity from ~100 to ~60.
Elevated FPN1 fluorescence intensity from ~100 to ~130.


Chemical Information
-
CAS No. 31524-62-6
-
Appearance Solid
-
Molecular Weight 324.37
-
Formula C20H20O4
-
Color White to light yellow
-
SMILES
O=C1C[C@@H](C2=CC=C(O)C=C2)OC3=C(C/C=C(C)\C)C(O)=CC=C13
-
Structure Classification
-
Initial Source
-
Shipping
Room temperature in continental US; may vary elsewhere.
-
Storage
4°C, protect from light
* In solvent : -80°C, 6 months; -20°C, 1 month (protect from light)


Publications (6)
-
Journal Impact Factor
-
Most Recent
-
J Ethnopharmacol
2022 Nov 15:298:115593. PMID: 35973629 -
Int J Mol Sci
Dual Targeting of HIF-1α and DLL4 by Isoxanthohumol Potentiates Immune Checkpoint Blockade. [Abstract]2026 Feb 5;27(3):1576. PMID: 41683994 -
Chem Biol Interact
Bavachinin, a main compound of Psoraleae Fructus, facilitates GSDMD-mediated pyroptosis and causes hepatotoxicity in mice. [Abstract]2024 Sep 1:400:111133. PMID: 38969277 -
Arch Biochem Biophys
Exosomes from isobavachin-modified bone marrow mesenchymal stem cells promote osteoblast proliferation and alleviate osteoporosis by targeting the miR-127-3p/KIF3B/Wnt/β-catenin pathway. [Abstract]2026 Mar:777:110713. PMID: 41443290
Isobavachin purchased from MedChemExpress. Usage Cited in: Arch Biochem Biophys. 2026 Mar:777:110713. [Abstract]
The viability of hBMSC after 48 h treatment with Isobavachin (IBA) at different concentrations (0, 5, 10, 20, 40, and 60 μM) was evaluated by CCK-8 assay.
Isobavachin purchased from MedChemExpress. Usage Cited in: Arch Biochem Biophys. 2026 Mar:777:110713. [Abstract]
Representative fluorescence images showing the internalization of PKH26- labeled exosomes into hFOB1.19 cells treated with Isobavachin (IBA) (40 μM).
Isobavachin purchased from MedChemExpress. Usage Cited in: Arch Biochem Biophys. 2026 Mar:777:110713. [Abstract]
The mRNA levels of RUNX2, BMP2, and ATF4 in hFOB1.19 cells were assessed by RT-qPCR treated with Isobavachin (IBA) (40 μM).
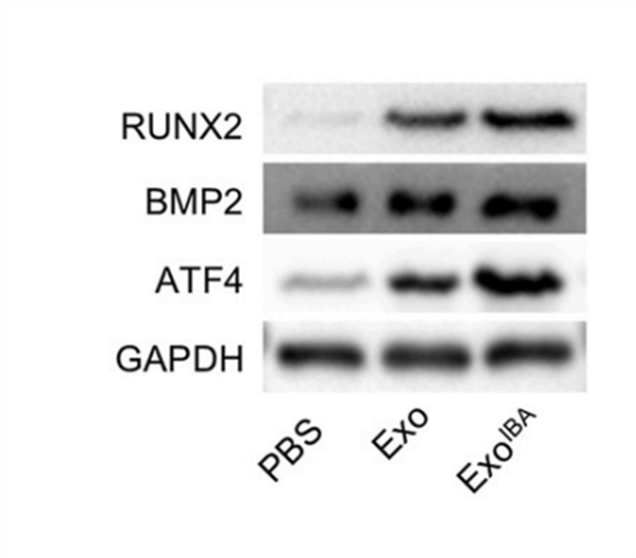
Isobavachin purchased from MedChemExpress. Usage Cited in: Arch Biochem Biophys. 2026 Mar:777:110713. [Abstract]
The protein levels of RUNX2, BMP2, and ATF4 in hFOB1.19 cells were assessed by western blotting treated with Isobavachin (IBA) (40 μM).
Isobavachin purchased from MedChemExpress. Usage Cited in: Arch Biochem Biophys. 2026 Mar:777:110713. [Abstract]
Representative H&E staining images showing the histopathological changes of the femur in rats treated with Isobavachin (IBA) (40 μM).
-
-
Front Med
Bavachin enhances NLRP3 inflammasome activation induced by ATP or nigericin and causes idiosyncratic hepatotoxicity. [Abstract]2021 Aug;15(4):594-607. PMID: 33909257


Solvent & Solubility
In Vitro:
DMSO : 100 mg/mL (308.29 mM; Need ultrasonic; Hygroscopic DMSO has a significant impact on the solubility of product, please use newly opened DMSO)
Please refer to the solubility information to select the appropriate solvent. Once prepared, please aliquot and store the solution to prevent product inactivation from repeated freeze-thaw cycles.
Storage method and period of stock solution: -80°C, 6 months; -20°C, 1 month (protect from light). When stored at -80°C, please use it within 6 months. When stored at -20°C, please use it within 1 month.
Please refer to the solubility information to select the appropriate solvent. Once prepared, please aliquot and store the solution to prevent product inactivation from repeated freeze-thaw cycles.
Storage method and period of stock solution: -80°C, 6 months; -20°C, 1 month (protect from light). When stored at -80°C, please use it within 6 months. When stored at -20°C, please use it within 1 month.
Concentration (start) × Volume (start) = Concentration (final) × Volume (final)
In Vivo:
Select the appropriate dissolution method based on your experimental animal and administration route.
- For the following dissolution methods, please ensure to first prepare a clear stock solution using an In Vitro approach and then sequentially add co-solvents:
- To ensure reliable experimental results, the clarified stock solution can be appropriately stored based on storage conditions. As for the working solution for In Vivo experiments, it is recommended to prepare freshly and use it on the same day.
- The percentages shown for the solvents indicate their volumetric ratio in the final prepared solution. If precipitation or phase separation occurs during preparation, heat and/or sonication can be used to aid dissolution.
Add each solvent one by one: 10% DMSO 40% PEG300 5% Tween-80 45% Saline
Solubility: ≥ 2.5 mg/mL (7.71 mM); Clear solution
This protocol yields a clear solution of ≥ 2.5 mg/mL (saturation unknown).
Taking 1 mL working solution as an example, add 100 μL DMSO stock solution (25.0 mg/mL) to 400 μL PEG300, and mix evenly; then add 50 μL Tween-80 and mix evenly; then add 450 μL Saline to adjust the volume to 1 mL.
Preparation of Saline: Dissolve 0.9 g sodium chloride in ddH₂O and dilute to 100 mL to obtain a clear Saline solution.
Add each solvent one by one: 10% DMSO 90% (20% SBE-β-CD in Saline)
Solubility: ≥ 2.5 mg/mL (7.71 mM); Clear solution
This protocol yields a clear solution of ≥ 2.5 mg/mL (saturation unknown).
Taking 1 mL working solution as an example, add 100 μL DMSO stock solution (25.0 mg/mL) to 900 μL 20% SBE-β-CD in Saline, and mix evenly.
Preparation of 20% SBE-β-CD in Saline (4°C, storage for one week): 2 g SBE-β-CD powder is dissolved in 10 mL Saline, completely dissolve until clear.
In Vivo Dissolution Calculator
Please enter the basic information of animal experiments:
-
-
-
-
Recommended: Prepare an additional quantity of animals to account for potential losses during experiments.
Please enter your animal formula composition:
-
%DMSO +
Recommended: Keep the proportion of DMSO in working solution below 2% if your animal is weak.
-
%+
-
+%Tween-80 + +
-
%Saline +
The co-solvents required include: DMSO, . All of co-solvents are available by MedChemExpress (MCE). , Tween 80. All of co-solvents are available by MedChemExpress (MCE).
Working solution concentration: 0.22 mg/mL
Method for preparing stock solution: mg drug dissolved in μL DMSO. Stock solution concentration: mg/mL. * In solvent : -80°C, 6 months; -20°C, 1 month (protect from light)
1. Take μL DMSO stock solution;
2. Add μL .
μL , mix evenly;
3. Then add μL Tween 80, mix evenly;
4. Then add μL
Please ensure that the stock solution in the first step is dissolved to a clear state, and add co-solvents in sequence. You can use ultrasonic heating (ultrasonic cleaner, recommended frequency 20-40 kHz), vortexing, etc. to assist dissolution.

Protocols
-
Mammalian live/dead viability and cytotoxicity staining
Live/dead viability and cytotoxicity staining assays are based on the simultaneous detection of intracellular esterase activity in metabolically active (viable) cells and membrane integrity loss in non-viable cells. In commonly used dual-staining approaches, membrane-permeant fluorogenic substrates are converted by intracellular esterases into fluorescent products in live cells, while impermeant DNA-binding dyes selectively enter cells with compromised plasma membranes and label nucleic acids in dead or dying cells, enabling discrimination between viable and non-viable populations by fluorescence microscopy or flow cytometry.
-
Annexin V plus membrane-impermeant dye apoptosis staining
Annexin V-based apoptosis assays rely on the detection of phosphatidylserine (PS) externalization from the inner leaflet of the plasma membrane to the outer leaflet, an early biochemical hallmark of apoptosis. Fluorescently labeled Annexin V binds PS in a calcium-dependent manner, enabling identification of early apoptotic cells by flow cytometry or fluorescence microscopy. When combined with a membrane-impermeant DNA-binding dye (e. g. , propidium iodide), this approach allows discrimination between viable (Annexin V−/dye−), early apoptotic (Annexin V+/dye−), and late apoptotic or necrotic (Annexin V+/dye+) cell populations by assessing membrane integrity and PS exposure.
-
ROS/oxidative-stress fluorescent staining
ROS/oxidative-stress fluorescent staining uses cell-permeant fluorogenic probes that become fluorescent after oxidation inside cells or tissues; commonly used examples include DCFH-DA/DCFDA for broad cellular oxidant detection, DHE for superoxide-related signal detection, MitoSOX for mitochondrial superoxide-related signal detection, and CellROX probes for oxidative-stress-associated fluorescence readouts. The assay detects probe oxidation rather than a single ROS species unless the probe and analysis method have been chemically validated for that species. DCFH-DA enters cells, is deacetylated by intracellular esterases to DCFH, and produces fluorescent DCF after oxidation, so the readout is used as an operational measure of total cellular oxidative stress rather than a species-specific ROS measurement. DHE and MitoSOX can report superoxide-related oxidation, but red fluorescence alone can include non-specific ethidium-like oxidation products; HPLC or optimized spectral approaches are
-
Cell differentiation
Cell differentiation refers to the process in which cells of the same origin gradually produce cell groups with different morphological structure and functional characteristics.
-
Research Protocol for Inflammation-related Diseases
The NLRP3 inflammasome is a cytosolic innate immune signaling platform that integrates priming signals and danger-signal activation to promote caspase-1 activation, maturation of IL-1β and IL-18, and gasdermin D-mediated pyroptotic cell death. The core experimental logic is to determine whether inflammatory disease phenotypes are driven by increased NLRP3 expression, ASC-containing inflammasome assembly, caspase-1 cleavage, GSDMD cleavage, and extracellular release of IL-1β/IL-18 rather than by nonspecific cell injury alone. The pathway is strongly linked to inflammation-related disease phenotypes because monosodium urate crystals activate NALP3/NLRP3 inflammasome signaling in gout-like crystal inflammation, cholesterol crystals activate NLRP3 inflammasomes in atherogenesis models, and DSS-induced intestinal inflammation has been reported to involve NLRP3 inflammasome activity. However, experimental colitis studies also show context-dependent protective effects of NLRP3 inflammasome co
-
PC12 NGF-induced neuronal-like differentiation
PC12 cells are a rat adrenal pheochromocytoma-derived clonal cell line that responds to nerve growth factor by stopping proliferation and extending neurites, producing a sympathetic neuron-like phenotype used to study neuronal differentiation and neurite outgrowth. NGF acts through TrkA-dependent signaling, and neurite outgrowth is associated with ERK/Akt signaling, microtubule organization, neuronal-marker expression, and increased electrophysiological neuronal features such as sodium-channel density. The main assay readout is morphological differentiation, usually measured as the percentage of neurite-bearing cells, neurite length, neurite number, or total neurite length per cell. Additional readouts include GAP-43, tyrosine hydroxylase, βIII-tubulin, neurofilament, synapsin I, synaptophysin, ERK phosphorylation, Akt phosphorylation, and sodium-channel current density.
-
Liver Cancer Modeling
Liver cancer can be classified into primary liver cancer and secondary liver cancer. Secondary liver cancer is the metastatic liver cancer. Primary liver cancer includes hepatocellular carcinoma (HCC), intrahepatic cholangiocarcinoma (ICC) and fibrolamellar HCC, of which HCC is the most common form, accounting for approximately 90% of primary liver cancers[1]. HCC mouse models include chemical agent-induced models, transplanted tumor models, and genetic engineered models.
-
Cell Viability Determination by MTT Colorimetric Assay
The following protocol uses the MTT colorimetric assay as a classic literature-established method for assessing cell viability/metabolic activity in cultured mammalian cells. MTT[3-(4,5-dimethylthiazol-2-yl)-2,5-diphenyltetrazolium bromide] is reduced by metabolically active cells to a colored formazan product; the amount of formazan is quantified spectrophotometrically and provides an indirect measure of metabolically active viable cells. Importantly, MTT reduction reflects cellular oxidoreductase/metabolic activity rather than an absolute direct count of living cells, so changes in cellular metabolism can alter the signal independently of cell number.
-
Directly Induced Neuron Culture
Directly induced neuron culture converts somatic cells, most commonly fibroblasts, into induced neurons without passing through a pluripotent or neural progenitor stage; classic evidence shows that mouse fibroblasts can be converted by Ascl1, Brn2/Pou3f2, and Myt1l, human fibroblasts can be converted by defined neuronal transcription factors, and human fibroblasts can also be converted by miR-9/9-124 with neurogenic or subtype-specifying transcription factors. The readout is acquisition of neuronal identity and function, assessed by neuronal morphology, neuronal markers such as Tuj1/βIII-tubulin, MAP2, synapsin, and subtype markers when relevant, together with functional assays such as action-potential firing, synaptic activity, and electrophysiology.
-
Alzheimer’s Disease Modeling
Alzheimer’s Disease (AD) is a neurodegenerative disorder characterized by a progressive decline in cognitive functions and loss of specific types of neurons and synapses. Alzheimer's symptoms can be simulated in mice by injecting drugs (such as Aβ) or genetically modified.
-
PC12 NGF-Induced Neuronal Differentiation Culture
PC12 cells are a rat adrenal pheochromocytoma clonal line that responds to NGF by stopping proliferation and extending branching neurite-like processes; after longer NGF exposure, cells develop long processes and neuronal-like ultrastructural and functional features. NGF-induced differentiation is read out mainly by neurite outgrowth, reduced proliferation, microtubule assembly, and neuronal differentiation-associated proteins such as MAPs, tau, GAP-43, and synapsin-1.
-
Cytoplasmic-Nuclear Fractionated Protein Extraction
Cytoplasmic-nuclear fractionated protein extraction separates soluble cytoplasmic proteins from nuclear-enriched proteins by mild plasma-membrane permeabilization, differential centrifugation, washing of nuclei, and extraction of nuclear proteins for downstream immunoblotting or related molecular analysis. The readout is the relative abundance of a protein in cytoplasmic and nuclear fractions, commonly assessed by western blotting together with compartment markers such as tubulin or pyruvate kinase for cytoplasm and lamin, nucleoporin, hnRNP, H2AX, or Lamin B for nuclear fractions.
-
iPSC/hPSC-Derived Neuron Differentiation Culture
iPSC/hPSC-derived neuron differentiation culture directs pluripotent cells toward neuroectoderm and then neuronal lineages by suppressing developmental signals that maintain non-neural fates; the classic monolayer dual-SMAD approach blocks BMP and Activin/TGF-β signaling with Noggin or dorsomorphin/LDN193189 plus SB431542, producing PAX6-positive neural progenitors that can be further matured into neurons. The readout is generated by morphology, neural progenitor markers, neuronal markers, subtype markers, and functional assays: PAX6/SOX1/NESTIN indicate neural progenitor induction, βIII-tubulin/TUJ1 and MAP2 indicate neuronal differentiation, cortical programs can be assessed by FOXG1, TBR1, CTIP2, SATB2, and synaptic maturation can be assessed by synaptic proteins, calcium activity, multielectrode arrays, or patch-clamp electrophysiology.
-
Apoptosis
Apoptosis, also called programmed cell death, is generally characterized by distinct morphological characteristics.
-
TUNEL staining for apoptotic DNA fragmentation
TUNEL staining detects DNA strand breaks by using terminal deoxynucleotidyl transferase to add labeled nucleotides to exposed 3′-OH DNA termini, generating either microscopic staining in fixed cells or tissue sections, or fluorescence/cytometric signal in cell suspensions. TUNEL positivity reflects DNA fragmentation but should not be interpreted alone as definitive apoptosis, because TUNEL can also label necrotic, autolytic, mechanically damaged, or DNA-repair-associated DNA breaks.
-
Cell Cytotoxicity Assay
Cytotoxicity assays are usually based on the assessment of cell membrane damage, which can also be indirectly detected by measuring cell viability. Detection methods include MTT assay, CKK-8 assay, LDH assay and ATP assay, etc.
-
SH-SY5Y Neuronal Differentiation Culture
SH-SY5Y neuronal differentiation culture uses sequential exposure to retinoic acid and neurotrophic factors to reduce proliferative neuroblastoma-like behavior and induce neuron-like morphology, including neurite extension, neuronal marker expression, and, in RA/BDNF protocols, greater synaptic-marker expression than undifferentiated culture. Retinoic acid is commonly used as the initiating differentiation cue, while BDNF in serum-reduced or serum-free medium supports later maturation and neurotrophic-factor-dependent neuron-like survival.
-
Human pluripotent stem cell neural induction and neuron differentiation
Human pluripotent stem cell neural induction can be achieved by blocking BMP and TGFβ/Activin/Nodal SMAD signaling, which suppresses non-neural differentiation and promotes early neuroectodermal identity; the expected readout is loss of pluripotency markers such as OCT4 and induction of neural markers such as PAX6, followed by neural progenitor and neuron marker acquisition during differentiation. This protocol uses dual-SMAD neural induction as the core induction method, followed by cortical neuron differentiation as a representative neuron differentiation model; published cortical protocols describe generation of cortical progenitors, temporally ordered cortical projection neurons, action-potential firing, synaptogenesis, and neural network formation over an approximately 80-day process.
-
Autophagy
Autophagy is a process in which eukaryotic cells use lysosomes to degrade their own cytoplasmic proteins and damaged organelles under the regulation of autophagy related gene (Atg). Microtubule-associated proteins light chain 3 (LC3) is recognized as autophagy marker, which transfers from cytoplasmic LC3 (LC3-I) to membrane type (LC3-II). LC3-II/I ratio could be detected by Western Blot and fluorescence microscopy.
-
SH-SY5Y neuronal-like differentiation
SH-SY5Y neuronal-like differentiation uses defined culture conditions to shift proliferative human neuroblastoma cells toward a neuron-like state, mainly assessed by reduced proliferation, neurite extension, neuronal-marker expression, and, in some protocols, increased dependence on neurotrophic support. Retinoic acid (RA) is commonly used for the first differentiation phase, and sequential RA followed by brain-derived neurotrophic factor (BDNF) in serum-free medium is a well-characterized approach for generating neuron-like SH-SY5Y cultures with extensive neurite outgrowth. The primary readouts are morphology-based neurite outgrowth and marker-based confirmation using proteins such as βIII-tubulin, MAP2, GAP43, synaptophysin, NeuN, NSE, TH, or related neuronal/synaptic markers, depending on the study endpoint.
-
Apoptosis Solutions
Apoptosis is a regulated, generally non-lytic cell-death pathway that removes unwanted, damaged, infected, or abnormal cells through coordinated morphological changes, caspase activation, DNA fragmentation, and membrane remodeling. The intrinsic apoptosis pathway is controlled mainly by mitochondrial outer membrane permeabilization, BCL-2 family proteins, cytochrome c release, apoptosome formation, caspase-9 activation, and downstream executioner caspase-3/7 activation. The extrinsic apoptosis pathway is initiated by death receptors such as Fas, TNFR, and TRAIL receptors, which recruit adaptor proteins and activate caspase-8 before engaging executioner caspases or mitochondrial amplification through BID cleavage. Apoptosis is linked to many phenotypes, including cancer cell killing, tissue homeostasis, immune regulation, neurodegeneration, infection response, and treatment-induced cytotoxicity; unresolved questions include how apoptosis interacts with necroptosis, pyroptosis, ferroptos
-
Lysosome and acidic-vesicle live-cell staining
Lysosome and acidic-vesicle live-cell staining detects acidic intracellular compartments by using membrane-permeant acidotropic probes that accumulate in low-pH vesicles, including lysosomes, late endosomes, autolysosomes, and acidic phagosomes. LysoTracker staining is commonly used as an intensity-based readout of acidic lysosomal compartment abundance or enlargement, while acridine orange produces green fluorescence in less concentrated compartments and red fluorescence after concentration-dependent accumulation in acidic vesicular organelles. Loss or reduction of acridine-orange red signal can be used as a readout of lysosomal membrane permeabilization or reduced acidic-vesicle integrity. This protocol is designed for live cultured cells and can be adapted for fluorescence microscopy, high-content imaging, plate-reader readout, or flow cytometry when the selected literature supports the readout. Because these dyes report acidotropic accumulation rather than lysosome identity alone,
-
Macroautophagy Solutions
Macroautophagy is a conserved lysosome-dependent degradation pathway in which cytoplasmic material is sequestered into double-membrane autophagosomes and delivered to lysosomes for degradation and recycling. The pathway supports cellular homeostasis during nutrient limitation, organelle stress, protein-aggregate accumulation, infection, differentiation, and tissue remodeling by coupling cargo sequestration, autophagosome maturation, lysosomal fusion, and degradation of cargo-derived macromolecules. The core molecular sequence includes initiation by nutrient- and stress-regulated autophagy machinery, autophagosome nucleation, LC3/ATG8-family conjugation to autophagosomal membranes, cargo selection through receptors such as SQSTM1/p62, autophagosome-lysosome fusion, and lysosomal degradation. LC3 was identified as a mammalian homolog of yeast Atg8 that localizes to autophagosomal membranes after processing, and p62/SQSTM1 was shown to connect ubiquitinated cargo with autophagic degradati
-
Osteoclast differentiation from monocyte/macrophage precursors
Osteoclast differentiation is an in vitro induction assay in which monocyte/macrophage-lineage precursors are exposed to macrophage colony-stimulating factor (M-CSF) and receptor activator of NF-κB ligand (RANKL), generating multinucleated osteoclasts that are commonly identified by tartrate-resistant acid phosphatase (TRAP) staining and functionally confirmed by resorption pits on dentin, bone, or mineralized substrates. M-CSF supports survival and expansion of osteoclast precursors, while RANKL binding to RANK drives osteoclast commitment, fusion, maturation, and resorptive function; osteoprotegerin inhibits this pathway by binding RANKL and preventing RANK activation. The main readouts are the number of TRAP-positive multinucleated cells, formation of F-actin rings, and resorbed surface area; TRAP-positive multinucleated cells indicate osteoclast differentiation, whereas pit formation on dentin, bone, or mineralized coating indicates functional bone-resorbing activity.


Purity & Documentation
-
Data Sheet (322 KB)
-
SDS (393 KB)
- English - EN (393 KB)
- Français - FR (393 KB)
- Deutsch - DE (393 KB)
- Norwegian - NO (393 KB)
- Español - ES (393 KB)
- Swedish - SV (393 KB)
- Italian - IT (393 KB)
- Korean - KR (393 KB)
- Portuguese - PT (393 KB)
-
Handling Instructions (2659 KB)
References
[1]. Wang DY, et al. Promoting effects of isobavachin on neurogenesis of mouse embryonic stem cells were associated with protein prenylation. Acta Pharmacol Sin. 2011;32(4):425-432. [Content Brief]
[2]. Xia N, et al. Isobavachin induces autophagy-mediated cytotoxicity in AML12 cells via AMPK and PI3K/Akt/mTOR pathways. Toxicol In Vitro. 2024;100:105919. [Content Brief]
[3]. Ye W, et al. Isobavachin Ameliorates Acetaminophen-Induced Liver Injury Through Modulation of CYP2E1-Mediated Bioactivation and NRF2/PI3K/AKT Cytoprotective Pathways. J Biochem Mol Toxicol. 2026;40(1):e70682. [Content Brief]
[4]. Chung YC, et al. Isobavachin, a main bioavailable compound in Psoralea corylifolia, alleviates lipopolysaccharide-induced inflammatory responses in macrophages and zebrafish by suppressing the MAPK and NF-κB signaling pathways. J Ethnopharmacol. 2024;321:117501. [Content Brief]
[5]. Xing H, et al. Investigation on the metabolic characteristics of isobavachin in Psoralea corylifolia L. (Bu-gu-zhi) and its potential inhibition against human cytochrome P450s and UDP-glucuronosyltransferases. J Pharm Pharmacol. 2020;72(12):1865-1878. [Content Brief]
[6]. Sim KH, et al. Isobavachin attenuates FcεRI-mediated inflammatory allergic responses by regulating SHP-1-dependent Fyn/Lyn/Syk/Lck signaling. Biochem Pharmacol. 2025;232:116698. [Content Brief]
[7]. Li T, et al. Isobavachin attenuates osteoclastogenesis and periodontitis-induced bone loss by inhibiting cellular iron accumulation and mitochondrial biogenesis. Biochem Pharmacol. 2024;224:116202. [Content Brief]
[8]. Patil SP, et al. Discovery of Isobavachin, a Natural Flavonoid, as an Apolipoprotein E4 (ApoE4) Structure Corrector for Alzheimer's Disease. Molecules. 2025;30(4):940. Published 2025 Feb 18. [Content Brief]


Complete Stock Solution Preparation Table
Please refer to the solubility information to select the appropriate solvent. Once prepared, please aliquot and store the solution to prevent product inactivation from repeated freeze-thaw cycles.
Storage method and period of stock solution: -80°C, 6 months; -20°C, 1 month (protect from light). When stored at -80°C, please use it within 6 months. When stored at -20°C, please use it within 1 month.
| Optional Solvent | Concentration Solvent Mass | 1 mg | 5 mg | 10 mg | 25 mg |
|---|---|---|---|---|---|
| DMSO | 1 mM | 3.0829 mL | 15.4145 mL | 30.8290 mL | 77.0725 mL |
| 5 mM | 0.6166 mL | 3.0829 mL | 6.1658 mL | 15.4145 mL | |
| 10 mM | 0.3083 mL | 1.5414 mL | 3.0829 mL | 7.7072 mL | |
| 15 mM | 0.2055 mL | 1.0276 mL | 2.0553 mL | 5.1382 mL | |
| 20 mM | 0.1541 mL | 0.7707 mL | 1.5414 mL | 3.8536 mL | |
| 25 mM | 0.1233 mL | 0.6166 mL | 1.2332 mL | 3.0829 mL | |
| 30 mM | 0.1028 mL | 0.5138 mL | 1.0276 mL | 2.5691 mL | |
| 40 mM | 0.0771 mL | 0.3854 mL | 0.7707 mL | 1.9268 mL | |
| 50 mM | 0.0617 mL | 0.3083 mL | 0.6166 mL | 1.5414 mL | |
| 60 mM | 0.0514 mL | 0.2569 mL | 0.5138 mL | 1.2845 mL | |
| 80 mM | 0.0385 mL | 0.1927 mL | 0.3854 mL | 0.9634 mL | |
| 100 mM | 0.0308 mL | 0.1541 mL | 0.3083 mL | 0.7707 mL |


Isobavachin Related Classifications
HY-N0762 Related Classifications
 Powered by Bioz