



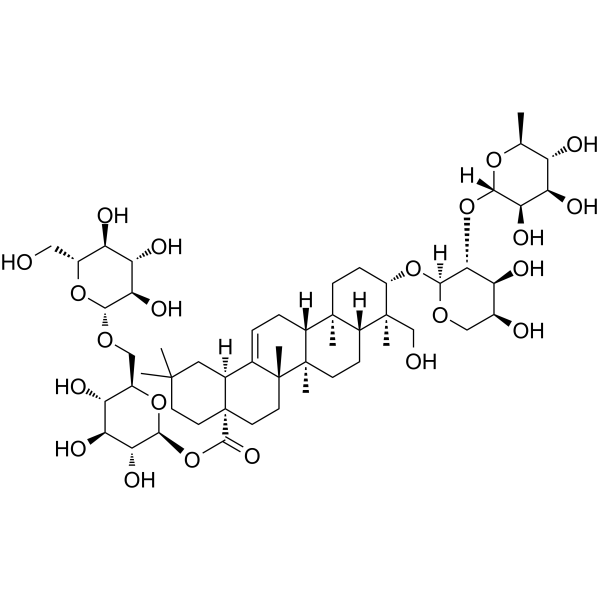
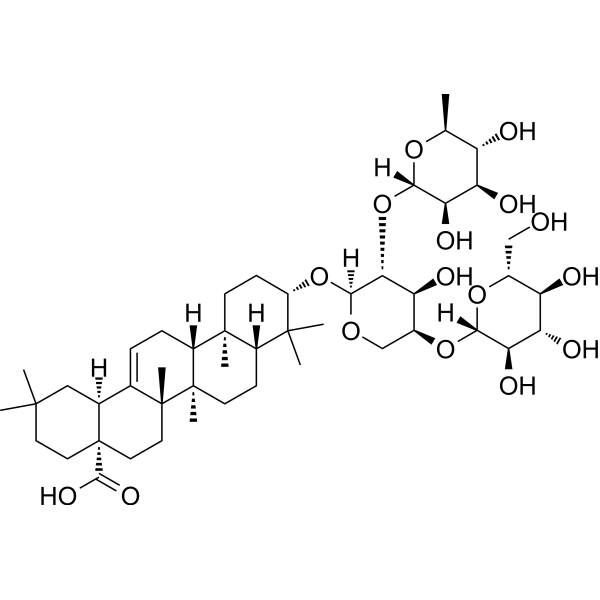
Macranthoside B

Based on 1 Customer Validation
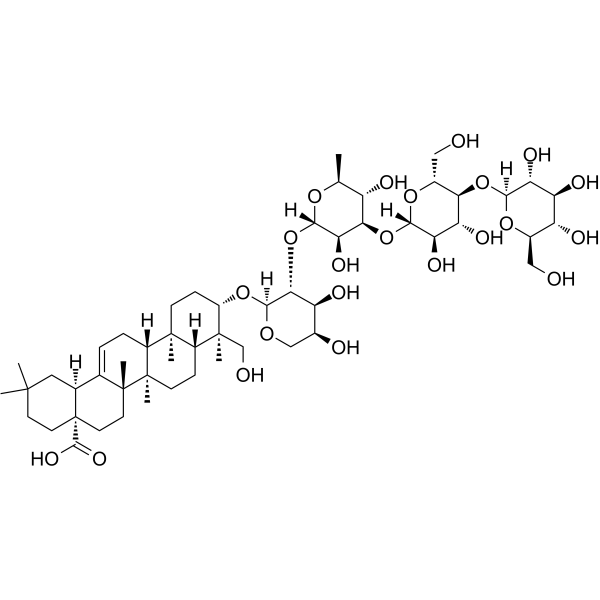
Macranthoside B is an apoptosis inducer with in vitro and in vivo anticancer activity. Macranthoside B induces autophagy and ferroptosis in cancer cells. Macranthoside B induces intracellular ROS accumulation, activates AMPK, inhibits mTOR and P70S6 kinase phosphorylation, and modulates Bcl-2/Bax expression. Macranthoside B activates caspase-3, caspase-9, and the intrinsic caspase cascade, induces PARP cleavage/degradation, and inhibits NRF2 signaling. Macranthoside B disrupts iron homeostasis via NCOA4-dependent ferritinophagy, up-regulates Lip-ROS, reduces mitochondrial membrane potential, and activates the JNK pathway. Macranthoside B can be used for the research of ovarian cancer, hepatoma, gastric carcinoma, breast carcinoma, colon carcinoma, glioma, melanoma, adenocarcinoma of the esophagogastric junction, and cervical cancer.
For research use only. We do not sell to patients.
- Purity : 99.95%
- CAS No.: 146100-02-9
- Formula: C53H86O22
- Molecular Weight:1075.24
-
Storage:
4°C, sealed storage, away from moisture and light
* In solvent : -80°C, 6 months; -20°C, 1 month (sealed storage, away from moisture and light)

To place orders, for customer services and technical support, please contact: MedChemExpress USA
Tel: 609-228-6898 E-mail: [email protected] [email protected]


-
 Biological Activity
-
Chemical Information
-
Solvent & Solubility
- Protocols
- Purity & Documentation
- References
-
 Help & FAQs




Biological Activity
Description
|
mTOR |
AMPK |
Caspase-9 |
Caspase 3 |
Bcl-2 |
Bax |
In Vitro
Macranthoside B (5-20 μM; 6 h treatment, followed by 15 days of growth) dose-dependently inhibits clonogenicity of human ovarian carcinoma A2780 cells, with an IC50 of 8.46 μM[1].
Macranthoside B (5-20 μM; 48 h) dose-dependently activates AMPK and inhibits the mTOR/P70S6K pathway in human ovarian carcinoma A2780 cells[1].
Macranthoside B (2.55-80 μM; 48 h) potently inhibits the proliferation of human HepG2, MGC-803, MCF-7, SW1116, U251, rat C6, and mouse B16F1, B16F10 cancer cells in vitro, with IC50 values ranging from 10 μM to 18 μM[2].
Macranthoside B (0-40 μM; 24, 48 h) inhibits the viability of SKGT-4, OE-19, and OE-33 AEG cells in a concentration-dependent manner, with 48 h IC50 values ranging from 4.74 to 8.59 μM, and is less potent against normal NGEC cells[3].
Macranthoside B (8-10 μM; 24 h) inhibits the colony-forming ability of SKGT-4 and OE-19 AEG cells in a concentration-dependent manner, with significant suppression at 8 μM and 10 μM[3].
Macranthoside B (10-15 μM; 48 h) inhibits the proliferation of SKGT-4 and OE-19 AEG cells in a concentration-dependent manner, with significant reduction in EDU-positive cells at 10 μM and 15 μM[3].
Macranthoside B (8-10 μM; 36 h) inhibits the migration and invasion of SKGT-4 and OE-19 AEG cells in a concentration-dependent manner, with significant suppression at 8 μM and 10 μM[3].
Macranthoside B (40 μM; 4 h) induces apoptosis in human hepatoma HepG2 cells, with 39.02% of cells entering early apoptosis and 13.45% entering late apoptosis/necrosis[2].
Macranthoside B (30-40 μM; 4 h) induces apoptosis in human hepatoma HepG2 cells via a mitochondrion-mediated pathway, activating caspase-9 and caspase-3, cleaving PARP, increasing Bax protein expression, decreasing Bcl-2 protein expression, and elevating the Bax/Bcl-2 ratio[2].
Macranthoside B (5-20 μM; 48 h) dose-dependently upregulates pro-apoptotic markers (cleaved caspase-3, cleaved caspase-9, cleaved PARP) and the autophagy marker LC3-II in human ovarian carcinoma A2780 cells; inhibition of autophagy reduces apoptosis, while inhibition of apoptosis enhances autophagy, and inhibition of ROS or AMPK reduces both apoptosis and autophagy[1].
Macranthoside B (15 μM; 48 h) activates autophagy in SKGT-4 and OE-19 AEG cells, increasing LC3B puncta, autophagic vacuoles, and LC3B II/P62 protein levels, while impairing autophagic flux[3].
Macranthoside B (0-15 μM; 0-48 h) downregulates GPX4 protein levels in SKGT-4 and OE-19 AEG cells in both concentration- and time-dependent manners, reducing levels to as low as 0.1 and 0.5 of control, respectively[3].
Macranthoside B (0-15 μM; 0-48 h) upregulates NCOA4 and FTH1 protein levels in SKGT-4 and OE-19 AEG cells in both concentration- and time-dependent manners, activating NCOA4-mediated ferritinophagy[3].
Macranthoside B (0-15 μM; 48 h) inhibits NRF2 in SKGT-4 and OE-19 AEG cells, downregulating NRF2 protein levels and its downstream target genes HERC2 and VAMP8, disrupting iron homeostasis[3].
Macranthoside B (48 h) disrupts iron homeostasis in SKGT-4 and OE-19 AEG cells, significantly increasing intracellular Fe2+ levels[3].
MedChemExpress (MCE) has not independently confirmed the accuracy of these methods. They are for reference only.
-
Cell Line:Human ovarian carcinoma A2780 cells, human embryonic lung fibroblast HFL1 cells
-
Concentration:1.25 μM, 2.5 μM, 5 μM, 1 μM, 20 μM
-
Incubation Time:24 h, 48 h, 72 h
-
Result:Inhibited A2780 cell viability in a concentration- and time-dependent manner, with IC50 values of 14.66 μM (24 h), 11.23 μM (48 h), 7.52 μM (72 h).
Exhibited IC50 values of 59.58 μM (24 h), 42.34 μM (48 h), 38.44 μM (72 h) in HFL1 cells, showing greater cytotoxicity toward tumor cells than normal cells.
-
Cell Line:human ovarian carcinoma A2780 cells
-
Concentration:5 μM, 10 μM, 20 μM (48 h incubation); 10 μM (48 h incubation with inhibitor pretreatment or beclin 1 siRNA transfection)
-
Incubation Time:48 h
-
Result:Increased levels of cleaved caspase-3, cleaved caspase-9, cleaved PARP, and LC3-II in a concentration-dependent manner at 5, 10, 20 μM for 48 h (cleaved caspase-3 levels relative to β-actin: 4.4, 20.0, 24.7; cleaved caspase-9: 10.5, 14.9, 23.5; cleaved PARP: 2.2, 3.4, 4.7; LC3-II: 3.4, 12.4, 24.9).
Decreased levels of cleaved caspase-3 (from 10.0 to 8.5), cleaved caspase-9 (from 2.0 to 1.8), cleaved PARP (from 1.0 to 0.5), and LC3-II (from 1.0 to 0.23) when cells were pretreated with 5 mM 3-methyladenine prior to 10 μM treatment.
Decreased LC3-II levels (from 1.0 to 0.19) and cleaved PARP levels (from 1.0 to 0.05) when cells were transfected with beclin 1 siRNA prior to 10 μM treatment.
Decreased levels of cleaved caspase-3 (from 2.1 to 0.2), cleaved caspase-9 (from 6.5 to 2.7), cleaved PARP (from 4.8 to 1.9), but increased LC3-II levels (from 2.0 to 3.8) when cells were pretreated with 10 μM Z-VAD-FMK prior to 10 μM treatment.
Decreased levels of cleaved caspase-3 (from 2.2 to 0.8), cleaved caspase-9 (from 1.7 to 1.5), cleaved PARP (from 1.6 to 0.7), and LC3-II (from 5.0 to 2.5) when cells were pretreated with 5 mM NAC prior to 10 μM treatment.
Decreased levels of cleaved caspase-3 (from 1.8 to 0.7) and LC3-II (from 1.6 to 0.7) when cells were pretreated with 10 μM Compound C prior to 10 μM treatment.
-
Cell Line:human ovarian carcinoma A2780 cells
-
Concentration:5 μM, 10 μM, 20 μM (48 h incubation); 10 μM (48 h incubation with inhibitor pretreatment)
-
Incubation Time:48 h
-
Result:Increased p-AMPK levels relative to β-actin (13.0, 18.9, 23.9) and decreased p-mTOR (0.9, 0.8, 0.6) and p-P70S6K (0.6, 0.4, 0.1) levels in a concentration-dependent manner at 5, 10, 20 μM for 48 h.
Decreased p-AMPK (from 2.4 to 1.1), p-mTOR (from 0.4 to 0.9), and p-P70S6K (from 0.5 to 1.0) levels when cells were pretreated with 5 mM NAC prior to 10 μM treatment.
Decreased p-AMPK (from 5.1 to 0.3), p-mTOR (from 0.3 to 0.9), and p-P70S6K (from 0.4 to 0.6) levels when cells were pretreated with 10 μM Compound C prior to 10 μM treatment.
-
Cell Line:human hepatoma HepG2, human gastric cancer MGC-803, human mammary adenocarcinoma MCF-7, human colonic carcinoma SW1116, human glioblastoma U251, rat glioma C6, mouse melanoma B16F1, mouse melanoma B16F10
-
Concentration:2.55-80 μM; 4.25-48 μM (HepG2 cells)
-
Incubation Time:48 h
-
Result:Inhibited HepG2 cell viability with inhibitory rates of 2.58%, 23.21%, 55.89%, 86.55%, and 98.14% at concentrations of 4.25, 7.08, 14.75, 23.04, and 48 μM respectively, with an IC50 of 10 μM.
Inhibited viability of all tested cell lines with IC50 values: MGC-803 (16 μM), MCF-7 (12 μM), SW1116 (14 μM), U251 (18 μM), C6 (14 μM), B16F1 (15 μM), and B16F10 (16 μM).
-
Cell Line:Human hepatoma HepG2
-
Concentration:40 μM
-
Incubation Time:4 h
-
Result:Increased the percentage of early apoptotic cells to 39.02% and the percentage of late apoptotic/necrotic cells to 13.45%, compared to control cells.
-
Cell Line:human hepatoma HepG2
-
Concentration:30 μM, 40 μM
-
Incubation Time:4 h
-
Result:Increased cleaved PARP levels in a concentration-dependent manner.
Decreased procaspase-9 expression significantly, decreased procaspase-3 expression slightly, and increased levels of activated caspase-3 p17 and p12 subunits.
Increased Bax protein levels by 82% and 113% at 30 μM and 40 μM respectively, decreased Bcl-2 protein levels slightly, resulting in a notable increase in the Bax/Bcl-2 ratio.
-
Cell Line:normal gastric epithelial cell line (NGEC), adenocarcinoma of the esophagogastric junction (AEG) cell lines SKGT-4, OE-19, OE-33
-
Concentration:0, 5, 10, 20, 30, 40 μM
-
Incubation Time:24 h; 48 h
-
Result:Inhibited AEG cell viability in a concentration-dependent manner, with normal NGEC cells showing lower sensitivity.
Exhibited 24 h IC50 values of 9.51 μM (SKGT-4), 12.70 μM (OE-19), 10.98 μM (OE-33), and 22.80 μM (NGEC).
Exhibited 48 h IC50 values of 8.59 μM (SKGT-4), 8.47 μM (OE-19), 4.74 μM (OE-33), and 11.69 μM (NGEC).
-
Cell Line:adenocarcinoma of the esophagogastric junction (AEG) cell lines SKGT-4, OE-19
-
Concentration:0, 8, 10 μM
-
Incubation Time:24 h, followed by 15-20 days of drug-free growth
-
Result:Reduced the number of colonies in SKGT-4 and OE-19 cells in a concentration-dependent manner.
Caused statistically significant decreases (***p < 0.001) at both 8 μM and 10 μM compared to the control.
-
Cell Line:adenocarcinoma of the esophagogastric junction (AEG) cell lines SKGT-4, OE-19
-
Concentration:0, 10, 15 μM
-
Incubation Time:48 h
-
Result:Reduced the EDU-positive cell rate in SKGT-4 and OE-19 cells in a concentration-dependent manner.
Caused statistically significant decreases (**p < 0.01, ***p < 0.001) at 10 μM and 15 μM compared to the control.
-
Cell Line:adenocarcinoma of the esophagogastric junction (AEG) cell lines SKGT-4, OE-19
-
Concentration:0, 5, 10, 15 μM
-
Incubation Time:0, 12, 24, 36, 48 h
-
Result:Reduced GPX4 protein levels in SKGT-4 and OE-19 cells in both concentration- and time-dependent manners.
Reduced GPX4 levels to 0.1 of control at 15 μM, and to 0.3 of control after 48 h in SKGT-4 cells.
Reduced GPX4 levels to 0.8 of control at 15 μM, and to 0.5 of control after 48 h in OE-19 cells.\nUpregulated NCOA4 and FTH1 protein levels in SKGT-4 and OE-19 cells in both concentration- and time-dependent manners.
Increased NCOA4 levels to 1.09 of control at 15 μM and 1.1 of control after 48 h; increased FTH1 levels to 1.1 of control at 15 μM and 1.3 of control after 48 h in SKGT-4 cells.
Increased NCOA4 levels to 2.5 of control at 15 μM and 1.1 of control after 48 h; increased FTH1 levels to 1.1 of control at 15 μM and 1.4 of control after 48 h in OE-19 cells.
In Vivo
MedChemExpress (MCE) has not independently confirmed the accuracy of these methods. They are for reference only.
-
Animal Model:Athymic BALB/cA nude mice (female, 35-40 days old, 18-22 g, subcutaneous implantation of HepG2 cells)[2]
-
Dosage:5 mg/kg
-
Administration:i.v.; every two days; 14 days
-
Result:Achieved 53.29% inhibition of tumor growth compared to vehicle control.
Significantly reduced relative tumor volume.
Lowered excised tumor weights compared to vehicle control.
- Western Blot
- RNA extraction experimental
- Mitochondrial membrane-potential fluorescent assay
- Annexin V plus membrane-impermeant dye apoptosis staining
- ROS/oxidative-stress fluorescent staining
- Liver Cancer Modeling
- Breast Cancer Modeling
- Kinase activity and phosphorylation assays
- Detection of Apoptosis
- TUNEL staining for apoptotic DNA fragmentation
- Fluorescent plasma-membrane potential dye assay
- Autophagy
- Mitochondrial membrane-potential and mitochondrial mass staining
- Apoptosis Solutions
- Lysosome and acidic-vesicle live-cell staining
- Ferroptosis Solutions
- Protocol for Kinase activity and phosphorylation assays
- Macroautophagy Solutions


Chemical Information
-
CAS No. 146100-02-9
-
Appearance Solid
-
Molecular Weight 1075.24
-
Formula C53H86O22
-
Color White to off-white
-
SMILES
C[C@@]12C([C@@]3([H])[C@](C(O)=O)(CCC(C)(C)C3)CC2)=CC[C@@]4([H])[C@]1(CC[C@]5([H])[C@@]4(CC[C@H](O[C@@]6([H])[C@@H]([C@H]([C@@H](O)CO6)O)O[C@@]7([H])[C@@H]([C@@H]([C@@H](O)[C@H](C)O7)O[C@]8([H])O[C@@H]([C@@H](O[C@]9([H])O[C@@H]([C@@H](O)[C@H](O)[C@H]9O)CO)[C@H](O)[C@H]8O)CO)O)[C@@]5(C)CO)C)C
-
Structure Classification
-
Shipping
Room temperature in continental US; may vary elsewhere.
-
Storage
4°C, sealed storage, away from moisture and light
* In solvent : -80°C, 6 months; -20°C, 1 month (sealed storage, away from moisture and light)


Solvent & Solubility
In Vitro:
DMSO : 100 mg/mL (93.00 mM; Need ultrasonic; Hygroscopic DMSO has a significant impact on the solubility of product, please use newly opened DMSO)
Please refer to the solubility information to select the appropriate solvent. Once prepared, please aliquot and store the solution to prevent product inactivation from repeated freeze-thaw cycles.
Storage method and period of stock solution: -80°C, 6 months; -20°C, 1 month (sealed storage, away from moisture and light). When stored at -80°C, please use it within 6 months. When stored at -20°C, please use it within 1 month.
Please refer to the solubility information to select the appropriate solvent. Once prepared, please aliquot and store the solution to prevent product inactivation from repeated freeze-thaw cycles.
Storage method and period of stock solution: -80°C, 6 months; -20°C, 1 month (sealed storage, away from moisture and light). When stored at -80°C, please use it within 6 months. When stored at -20°C, please use it within 1 month.
Concentration (start) × Volume (start) = Concentration (final) × Volume (final)
In Vivo:
Select the appropriate dissolution method based on your experimental animal and administration route.
- For the following dissolution methods, please ensure to first prepare a clear stock solution using an In Vitro approach and then sequentially add co-solvents:
- To ensure reliable experimental results, the clarified stock solution can be appropriately stored based on storage conditions. As for the working solution for In Vivo experiments, it is recommended to prepare freshly and use it on the same day.
- The percentages shown for the solvents indicate their volumetric ratio in the final prepared solution. If precipitation or phase separation occurs during preparation, heat and/or sonication can be used to aid dissolution.
Add each solvent one by one: 10% DMSO 40% PEG300 5% Tween-80 45% Saline
Solubility: ≥ 2.5 mg/mL (2.33 mM); Clear solution
This protocol yields a clear solution of ≥ 2.5 mg/mL (saturation unknown).
Taking 1 mL working solution as an example, add 100 μL DMSO stock solution (25.0 mg/mL) to 400 μL PEG300, and mix evenly; then add 50 μL Tween-80 and mix evenly; then add 450 μL Saline to adjust the volume to 1 mL.
Preparation of Saline: Dissolve 0.9 g sodium chloride in ddH₂O and dilute to 100 mL to obtain a clear Saline solution.
Add each solvent one by one: 10% DMSO 90% (20% SBE-β-CD in Saline)
Solubility: ≥ 2.5 mg/mL (2.33 mM); Clear solution
This protocol yields a clear solution of ≥ 2.5 mg/mL (saturation unknown).
Taking 1 mL working solution as an example, add 100 μL DMSO stock solution (25.0 mg/mL) to 900 μL 20% SBE-β-CD in Saline, and mix evenly.
Preparation of 20% SBE-β-CD in Saline (4°C, storage for one week): 2 g SBE-β-CD powder is dissolved in 10 mL Saline, completely dissolve until clear.
In Vivo Dissolution Calculator
Please enter the basic information of animal experiments:
-
-
-
-
Recommended: Prepare an additional quantity of animals to account for potential losses during experiments.
Please enter your animal formula composition:
-
%DMSO +
Recommended: Keep the proportion of DMSO in working solution below 2% if your animal is weak.
-
%+
-
+%Tween-80 + +
-
%Saline +
The co-solvents required include: DMSO, . All of co-solvents are available by MedChemExpress (MCE). , Tween 80. All of co-solvents are available by MedChemExpress (MCE).
Working solution concentration: 0.22 mg/mL
Method for preparing stock solution: mg drug dissolved in μL DMSO. Stock solution concentration: mg/mL. * In solvent : -80°C, 6 months; -20°C, 1 month (sealed storage, away from moisture and light)
1. Take μL DMSO stock solution;
2. Add μL .
μL , mix evenly;
3. Then add μL Tween 80, mix evenly;
4. Then add μL
Please ensure that the stock solution in the first step is dissolved to a clear state, and add co-solvents in sequence. You can use ultrasonic heating (ultrasonic cleaner, recommended frequency 20-40 kHz), vortexing, etc. to assist dissolution.


Purity & Documentation
-
Data Sheet (313 KB)
-
SDS (252 KB)
- English - EN (252 KB)
- Français - FR (252 KB)
- Deutsch - DE (252 KB)
- Norwegian - NO (252 KB)
- Español - ES (252 KB)
- Swedish - SV (252 KB)
- Italian - IT (252 KB)
- Korean - KR (252 KB)
- Portuguese - PT (252 KB)
-
Handling Instructions (2659 KB)
References
[1]. Shan Y, et al. Macranthoside B Induces Apoptosis and Autophagy Via Reactive Oxygen Species Accumulation in Human Ovarian Cancer A2780 Cells. Nutrition and cancer. 2016;68(2):280-9. [Content Brief]
[2]. Wang J, et al. Macranthoside B, a hederagenin saponin extracted from Lonicera macranthoides and its anti-tumor activities in vitro and in vivo. Food and chemical toxicology : an international journal published for the British Industrial Biological Research Association. 2009 Jul;47(7):1716-21. [Content Brief]
[3]. Wang L, et al. Macranthoside B Suppresses the Growth of Adenocarcinoma of Esophagogastric Junction by Regulating Iron Homeostasis and Ferroptosis through NRF2 Inhibition. Current cancer drug targets. 2025;25(8):1013-1027. [Content Brief]
[4]. Li M, et al. Macranthoside B Enhances Paclitaxel-induced Human Cervical Cancer Cell Apoptosis Through ROS-JNK Pathway. Anticancer research. 2025 Jul;45(7):2859-2870. [Content Brief]


Complete Stock Solution Preparation Table
Please refer to the solubility information to select the appropriate solvent. Once prepared, please aliquot and store the solution to prevent product inactivation from repeated freeze-thaw cycles.
Storage method and period of stock solution: -80°C, 6 months; -20°C, 1 month (sealed storage, away from moisture and light). When stored at -80°C, please use it within 6 months. When stored at -20°C, please use it within 1 month.
| Optional Solvent | Concentration Solvent Mass | 1 mg | 5 mg | 10 mg | 25 mg |
|---|---|---|---|---|---|
| DMSO | 1 mM | 0.9300 mL | 4.6501 mL | 9.3002 mL | 23.2506 mL |
| 5 mM | 0.1860 mL | 0.9300 mL | 1.8600 mL | 4.6501 mL | |
| 10 mM | 0.0930 mL | 0.4650 mL | 0.9300 mL | 2.3251 mL | |
| 15 mM | 0.0620 mL | 0.3100 mL | 0.6200 mL | 1.5500 mL | |
| 20 mM | 0.0465 mL | 0.2325 mL | 0.4650 mL | 1.1625 mL | |
| 25 mM | 0.0372 mL | 0.1860 mL | 0.3720 mL | 0.9300 mL | |
| 30 mM | 0.0310 mL | 0.1550 mL | 0.3100 mL | 0.7750 mL | |
| 40 mM | 0.0233 mL | 0.1163 mL | 0.2325 mL | 0.5813 mL | |
| 50 mM | 0.0186 mL | 0.0930 mL | 0.1860 mL | 0.4650 mL | |
| 60 mM | 0.0155 mL | 0.0775 mL | 0.1550 mL | 0.3875 mL | |
| 80 mM | 0.0116 mL | 0.0581 mL | 0.1163 mL | 0.2906 mL |


Macranthoside B Related Classifications
HY-N5008 Related Classifications
 Powered by Bioz