



TC11
Based on 3 publication(s) in Google Scholar
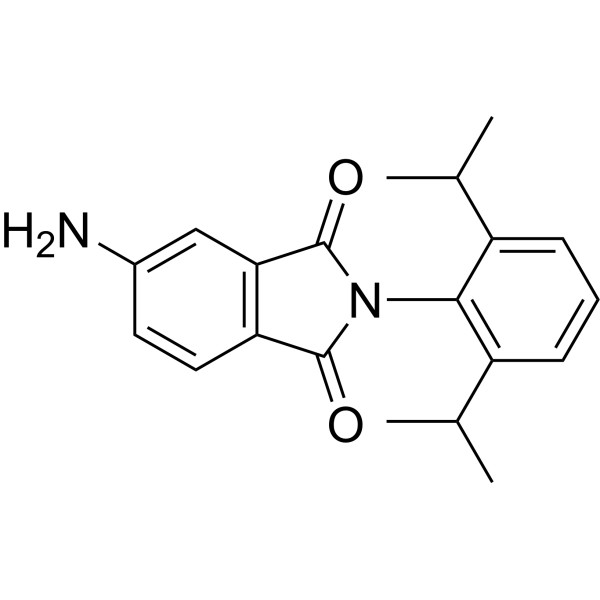
TC11 is a MCL1 degrader and apoptosis inducer. TC11 induces sustained CDK1 activation to phosphorylate and degrade MCL1, activates caspase-3, -8, and -9, inhibits centrosomal-regulatory NPM function to block centrosomal clustering, and triggers apoptosis independent of the cereblon pathway. TC11 blocks tumor cell proliferation in vitro and acts against tumor xenografts in vivo. TC11 can be used for the research of multiple myeloma.
Nos produits utilisent uniquement pour la recherche. Nous ne vendons pas aux patients.
- Pureté : 99.55%
- CAS No.: 100823-03-8
- Formule: C20H22N2O2
- Masse moléculaire:322.40
-
Stockage:
4°C, protect from light
* In solvent : -80°C, 6 months; -20°C, 1 month (protect from light)

To place orders, for customer services and technical support, please contact: MedChemExpress USA
Tel: 609-228-6898 E-mail: [email protected] [email protected]


-
 Activité biologique
-
Chemical Information
-
Solvant et solubilité
- Protocole
- Pureté et documentation
- Références
-
 Help & FAQs


-
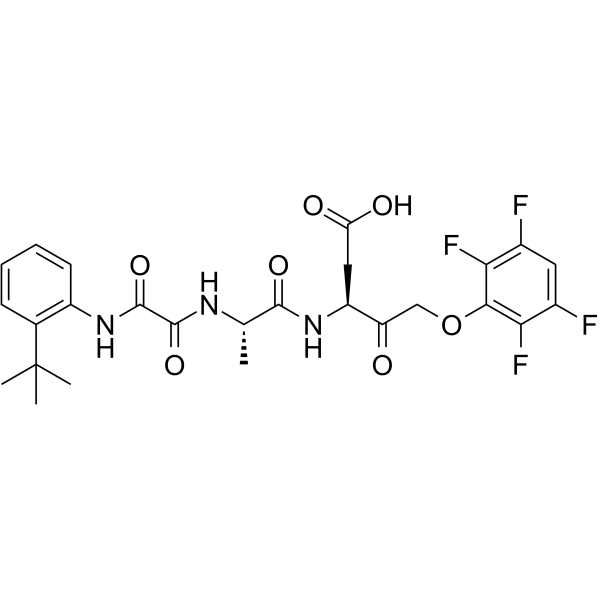
HY-10396
Emricasanpan-Caspase Inhibitor -
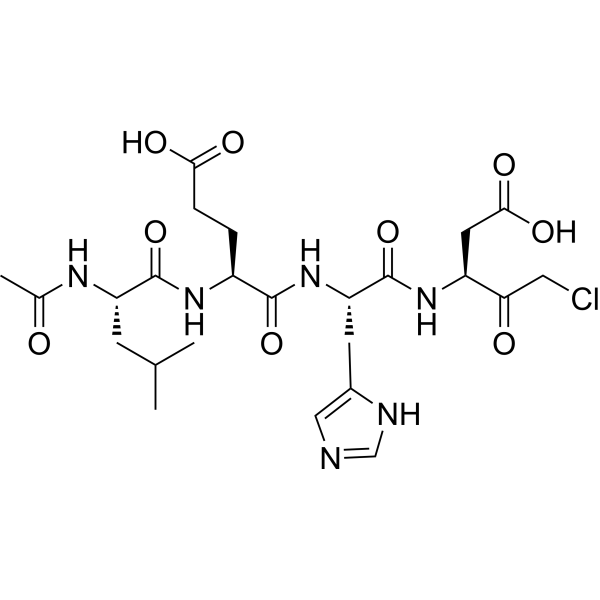
HY-136744
Caspase-9 Inhibitor IIICaspase-9 Inhibitor -
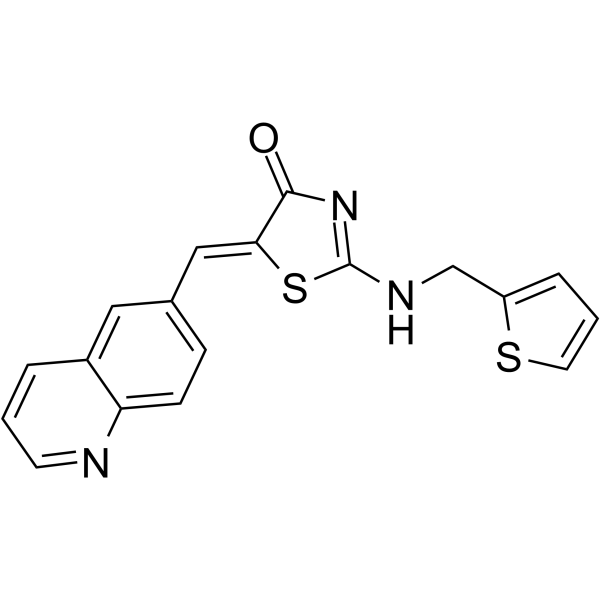
HY-12529
Ro-3306CDK1 Inhibitor -
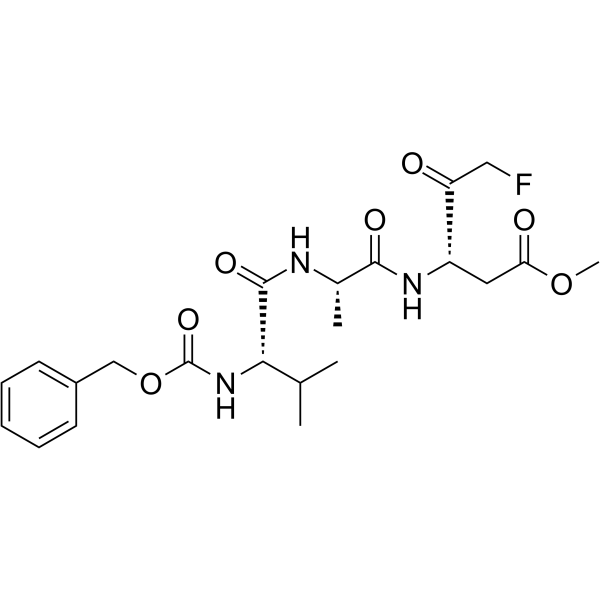
HY-16658
Z-VAD(OMe)-FMKPan-caspase Inhibitor -
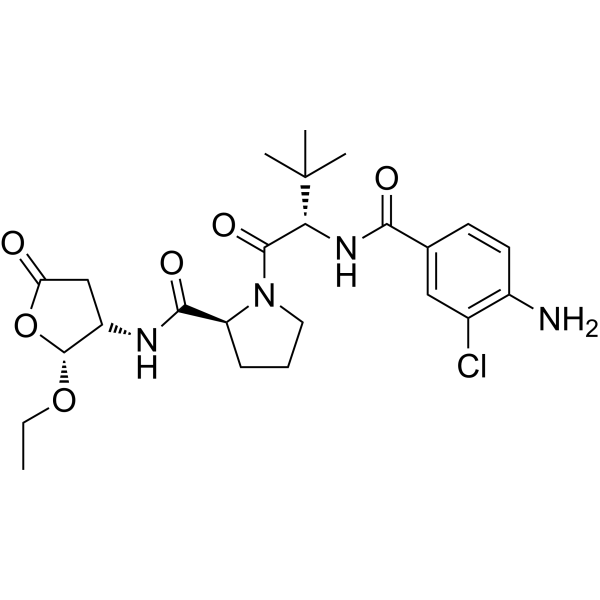
HY-13205
BelnacasanCaspase-1 Inhibitor -
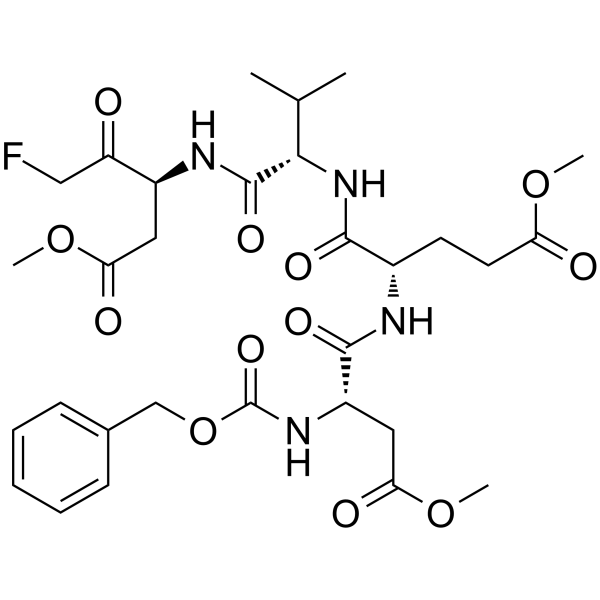
HY-12466
Z-DEVD-FMKCaspase-3 Inhibitor -
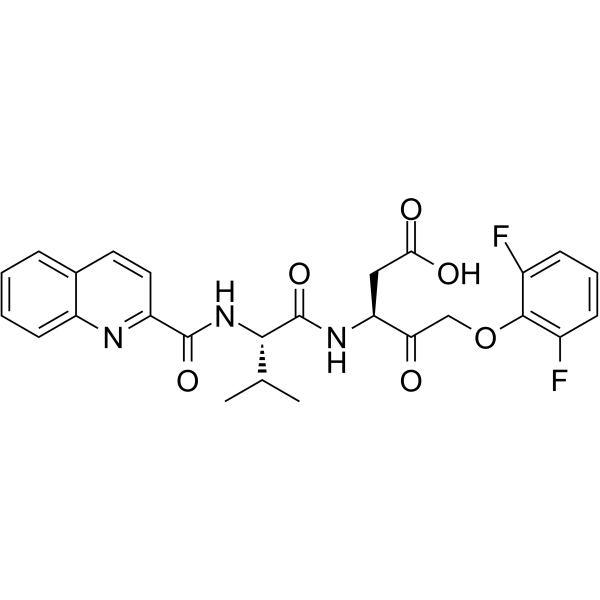
HY-12305
Q-VD-OPhPan-caspase Inhibitor -
HY-N0605
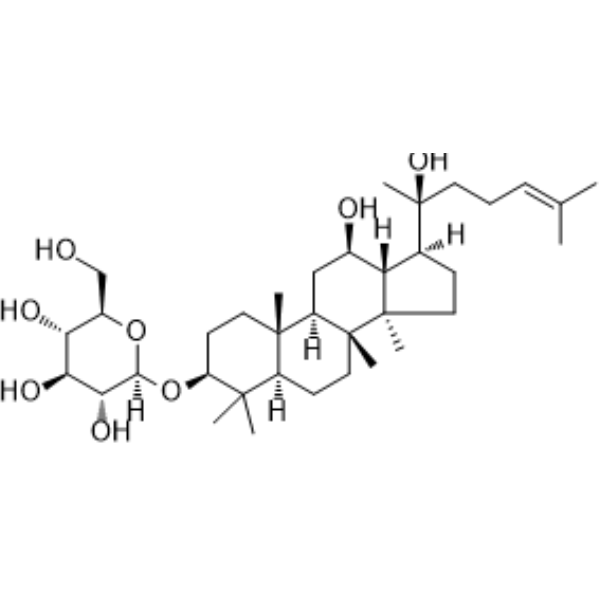
Ginsenoside Rh2Caspase Activator -
HY-P1001
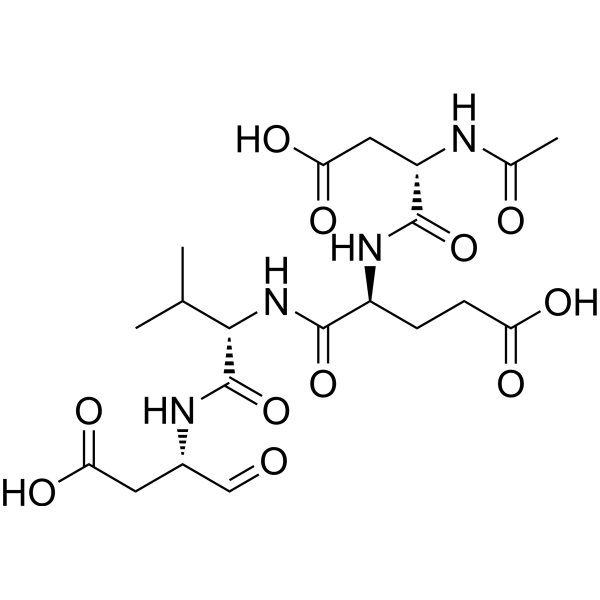
Ac-DEVD-CHOCaspase-3 Inhibitor -
HY-P1009
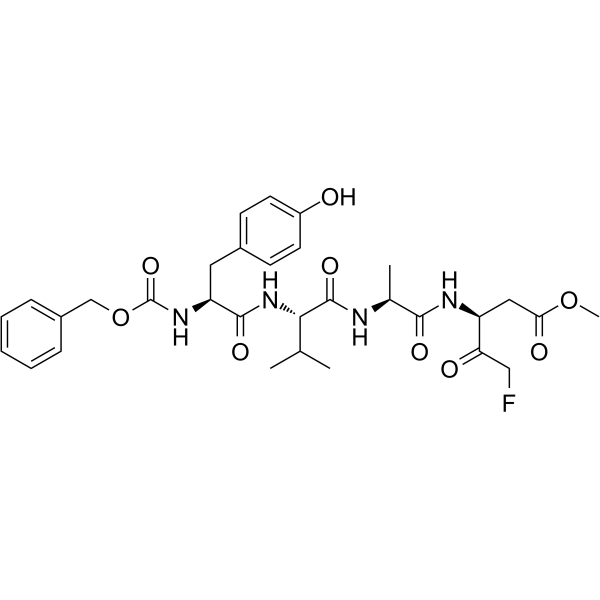
Z-YVAD-FMKCaspase 1/4 Inhibitor -
HY-P1008
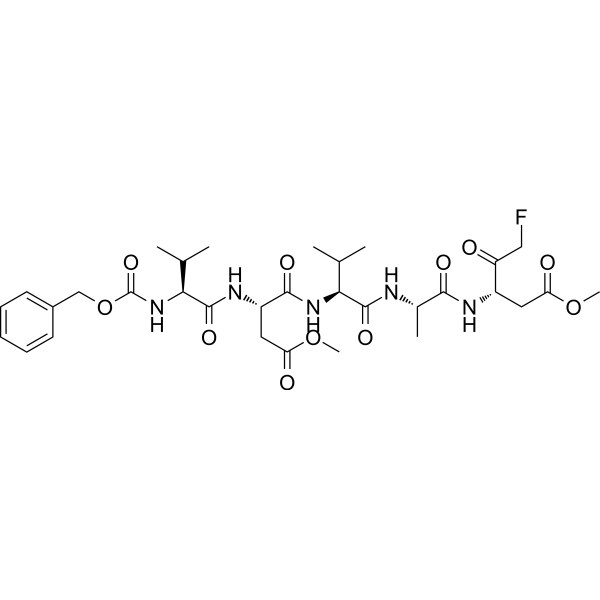
Z-VDVAD-FMKCaspase-2 Inhibitor -
HY-120838
Heptelidic acidGAPDH Inhibitor
Publications Citing Use of MedChemExpress (MCE) TC11
MoreVoir tous les produits spécifiques à Isoform Caspase
More

Activité biologique
Description
|
MCL1 |
CDK1 |
Caspase-9 |
Caspase-3 |
Caspase-8 |
Cellular Effect
|
Cell Line

|
Type | Value | Description | References |
|---|---|---|---|---|
| KMS-27 | IC50 |
8 μM
|
Antiproliferative activity against human KMS27 multiple myeloma cells assessed as reduction in cell viability incubated for 72 hrs by WST-1 assay.
Antiproliferative activity against human KMS27 multiple myeloma cells assessed as reduction in cell viability incubated for 72 hrs by WST-1 assay.
|
22761710 |
| KMS-34 | IC50 |
4 μM
|
Antiproliferative activity against human KMS34 multiple myeloma cells assessed as reduction in cell viability incubated for 72 hrs by WST-1 assay.
Antiproliferative activity against human KMS34 multiple myeloma cells assessed as reduction in cell viability incubated for 72 hrs by WST-1 assay.
|
22761710 |
| KMM-1 | IC50 |
7 μM
|
Antiproliferative activity against human KMM1 multiple myeloma cells assessed as reduction in cell viability incubated for 72 hrs by WST-1 assay.
Antiproliferative activity against human KMM1 multiple myeloma cells assessed as reduction in cell viability incubated for 72 hrs by WST-1 assay.
|
22761710 |
| KMS-11 | IC50 |
6 μM
|
Antiproliferative activity against human KMS11 multiple myeloma cells assessed as reduction in cell viability incubated for 72 hrs by WST-1 assay.
Antiproliferative activity against human KMS11 multiple myeloma cells assessed as reduction in cell viability incubated for 72 hrs by WST-1 assay.
|
22761710 |
| RPMI-8226 | IC50 |
7 μM
|
Antiproliferative activity against human RPMI8226 multiple myeloma cells assessed as reduction in cell viability incubated for 72 hrs by WST-1 assay.
Antiproliferative activity against human RPMI8226 multiple myeloma cells assessed as reduction in cell viability incubated for 72 hrs by WST-1 assay.
|
22761710 |
In Vitro
TC11 (1-5 μM; 24 h) does not downregulate CRBN substrates IKZF1 and IKZF3 in human multiple myeloma KMS34 cells after 24 h of treatment at 1 or 5 μM[1].
TC11 (1-30 μM; 48 h) induces cell death in CRBN-silenced human multiple myeloma KMS21 cells in a CRBN-independent manner at concentrations of 1 μM and above after 48 h[1].
TC11 (0-50 μM; 72 h) potently inhibits proliferation of KMM1, KMS11, KMS27, KMS34, and RPMI8226 multiple myeloma cell lines with IC50 values ranging from 4-8 μM[2].
TC11 (1-2.5 μM; 72 h) shows that NPM knockdown increases the sensitivity of HeLa cells to TC11-induced cytotoxicity, with TC11 showing more potent viability reduction in NPM-depleted cells than control cells[2].
MedChemExpress (MCE) has not independently confirmed the accuracy of these methods. They are for reference only.
-
Cell Line:human multiple myeloma KMS34 cells
-
Concentration:1 μM, 3 μM, 10 μM, 30 μM
-
Incubation Time:48 h
-
Result:Dose-dependently reduced cell viability in KMS34 cells, with significant viability loss observed at 3, 10, and 30 μM.
-
Cell Line:human multiple myeloma KMS34 cells
-
Concentration:1 μM, 5 μM
-
Incubation Time:24 h
-
Result:Did not reduce the expression levels of CRBN substrates IKZF1 and IKZF3 compared to immunomodulatory imide drug-treated cells.
-
Cell Line:CRBN-silenced human multiple myeloma KMS21 cells
-
Concentration:1 μM, 3 μM, 10 μM, 30 μM
-
Incubation Time:48 h
-
Result:Induced cell death that was not inhibited in CRBN-silenced KMS21 cells, unlike lenalidomide-induced cell death which was suppressed.
-
Cell Line:human multiple myeloma KMS34 cells
-
Concentration:5 μM
-
Incubation Time:24 h
-
Result:Resulted in accumulation of KMS34 cells in M phase, with the M phase fraction increasing from 1.65% in vehicle-treated cells to 22.7% in TC11-treated cells.
-
Cell Line:human multiple myeloma KMS34 cells
-
Concentration:5 μM
-
Incubation Time:12-48 h
-
Result:Caused dephosphorylation of cdc2 at T14 (12 h post-treatment) and Y15 (36 h post-treatment).
Increased phosphorylation of cdc2 at T161 (12-48 h post-treatment).
Induced cleavage of caspase-3 (12 h post-treatment) and caspase-9 (24 h post-treatment).
Reduced MCL1 expression levels over the 12-48 h treatment period.
-
Cell Line:KMM1, KMS11, KMS27, KMS34, RPMI8226
-
Concentration:0-50 μM
-
Incubation Time:72 h
-
Result:Inhibited proliferation of all tested multiple myeloma cell lines, with IC50 values of 7 μM (KMM1), 6 μM (KMS11), 8 μM (KMS27), 4 μM (KMS34), and 7 μM (RPMI8226).
-
Cell Line:KMS34, HeLa
-
Concentration:0, 5, 25, 50 μM
-
Incubation Time:6 h; 24 h; 96 h
-
Result:Induced cleavage of PARP in KMS34 and HeLa cells after 24 h.
Induced cleavage of procaspase-3, 8, and 9 to their activated forms in KMS34 cells after 6 h.
Observed DNA fragmentation in KMS34 cells treated for 6 h.
Increased the percentage of early (Annexin V-positive/PI-negative) and late (Annexin V-positive/PI-positive) apoptotic KMS34 cells to 53.1% and 43.8%, respectively, after treatment with 50 μM for 96 h.
-
Cell Line:HeLa
-
Concentration:5, 10, 20 μM
-
Incubation Time:6 h; 24 h
-
Result:Induced concentration-dependent increases in the percentage of mitotic HeLa cells with multipolar spindles: ~50% at 5 μM, ~90% at 10 μM, and ~100% at 20 μM.
Caused most interphase HeLa cells to exhibit multiple nuclei after 24 h treatment with 5 μM.
-
Cell Line:NPM-knockdown HeLa cells, control HeLa cells
-
Concentration:1, 2.5 μM
-
Incubation Time:72 h
-
Result:Reduced viability of NPM-depleted HeLa cells to ~70% and ~20% at 1 μM and 2.5 μM, respectively.
Reduced viability of control siRNA-transfected HeLa cells to ~100% and ~60% at 1 μM and 2.5 μM, respectively, showing significantly reduced viability in NPM-depleted cells compared to control cells.
In Vivo
MedChemExpress (MCE) has not independently confirmed the accuracy of these methods. They are for reference only.
-
Animal Model:ICR/SCID (male, 5 weeks old, subcutaneous inoculation of 3×10⁷ KMS34 multiple myeloma cells)[2]
-
Dosage:20 mg/kg
-
Administration:i.p.; twice with a 3-day interval
-
Result:Showed significant tumor volume suppression at 7 and 14 days post-treatment.
Increased cells with aggregated chromatin in treated tumor tissue.
Increased single-stranded DNA-positive apoptotic cells in treated tumor tissue.
Caused no mouse deaths or macroscopic toxicity.
- Annexin V plus membrane-impermeant dye apoptosis staining
- BrdU Incorporation Assay
- Somatic Cell Culture
- CFSE Dye Dilution Proliferation Assay
- Dye-dilution cell tracking and proliferation staining
- CCK-8/WST-8 Cell Proliferation Assay
- Protocol for Cell Cycle
- Cell Counting-Based Growth Curve Assay
- Colony Formation (Clonogenic) Assay
- Cell Viability Determination by MTT Colorimetric Assay
- EdU Incorporation Assay (Click Chemistry-Based DNA Synthesis Measurement)
- Detection of Apoptosis
- TUNEL staining for apoptotic DNA fragmentation
- Ki-67 Immunostaining Proliferation Assay
- PCNA Immunodetection Proliferation Assay
- Protocol for Cell Counting and Cell Density Analysis
- Apoptosis Solutions
- MTT Cell Proliferation Assay


Chemical Information
-
CAS No. 100823-03-8
-
Appearance Solid
-
Masse moléculaire 322.40
-
Formule C20H22N2O2
-
Color White to yellow
-
SMILES
O=C1N(C2=C(C(C)C)C=CC=C2C(C)C)C(C3=C1C=CC(N)=C3)=O
-
Livraison
Room temperature in continental US; may vary elsewhere.
-
Stockage
4°C, protect from light
* In solvent : -80°C, 6 months; -20°C, 1 month (protect from light)


Publications (3)
-
Journal Impact Factor
-
Most Recent
-
Mol Med Rep
CDK1‑induced regulation of p53 phosphorylation at Ser315 mediates cell cycle arrest and apoptosis of macrophages infected with clinical isolates of Mycobacterium tuberculosis. [Abstract]2026 Jan;33(1):44. PMID: 41268607 -
-
Tumour Virus Res
Ad-VT oncolytic adenovirus suppresses bladder cancer via cAMP-dependent AMPK-Raptor activation and G2/M arrest. [Abstract]2026 Jan 29:200337. PMID: 41619809


Solvant et solubilité
In Vitro:
DMSO : 50 mg/mL (155.09 mM; Need ultrasonic; Hygroscopic DMSO has a significant impact on the solubility of product, please use newly opened DMSO)
Please refer to the solubility information to select the appropriate solvent. Once prepared, please aliquot and store the solution to prevent product inactivation from repeated freeze-thaw cycles.
Storage method and period of stock solution: -80°C, 6 months; -20°C, 1 month (protect from light). When stored at -80°C, please use it within 6 months. When stored at -20°C, please use it within 1 month.
Please refer to the solubility information to select the appropriate solvent. Once prepared, please aliquot and store the solution to prevent product inactivation from repeated freeze-thaw cycles.
Storage method and period of stock solution: -80°C, 6 months; -20°C, 1 month (protect from light). When stored at -80°C, please use it within 6 months. When stored at -20°C, please use it within 1 month.
Concentration (start) × Volume (start) = Concentration (final) × Volume (final)
In Vivo:
Select the appropriate dissolution method based on your experimental animal and administration route.
- For the following dissolution methods, please ensure to first prepare a clear stock solution using an In Vitro approach and then sequentially add co-solvents:
- To ensure reliable experimental results, the clarified stock solution can be appropriately stored based on storage conditions. As for the working solution for In Vivo experiments, it is recommended to prepare freshly and use it on the same day.
- The percentages shown for the solvents indicate their volumetric ratio in the final prepared solution. If precipitation or phase separation occurs during preparation, heat and/or sonication can be used to aid dissolution.
In Vivo Dissolution Calculator
Please enter the basic information of animal experiments:
-
-
-
-
Recommended: Prepare an additional quantity of animals to account for potential losses during experiments.
Please enter your animal formula composition:
-
%DMSO +
Recommended: Keep the proportion of DMSO in working solution below 2% if your animal is weak.
-
%+
-
+%Tween-80 + +
-
%Saline +
The co-solvents required include: DMSO, . All of co-solvents are available by MedChemExpress (MCE). , Tween 80. All of co-solvents are available by MedChemExpress (MCE).
Working solution concentration: 0.22 mg/mL
Method for preparing stock solution: mg drug dissolved in μL DMSO. Stock solution concentration: mg/mL. * In solvent : -80°C, 6 months; -20°C, 1 month (protect from light)
1. Take μL DMSO stock solution;
2. Add μL .
μL , mix evenly;
3. Then add μL Tween 80, mix evenly;
4. Then add μL
Please ensure that the stock solution in the first step is dissolved to a clear state, and add co-solvents in sequence. You can use ultrasonic heating (ultrasonic cleaner, recommended frequency 20-40 kHz), vortexing, etc. to assist dissolution.


Pureté et documentation
-
Fiche technique (298 KB)
-
SDS (393 KB)
- English - EN (393 KB)
- Français - FR (393 KB)
- Deutsch - DE (393 KB)
- Norwegian - NO (393 KB)
- Español - ES (393 KB)
- Swedish - SV (393 KB)
- Italian - IT (393 KB)
- Korean - KR (393 KB)
- Portuguese - PT (393 KB)
-
Instruction de manipulation (2659 KB)
Références
[1]. Ichikawa D, et al. A phenylphthalimide derivative, TC11, induces apoptosis by degrading MCL1 in multiple myeloma cells. Biochemical and biophysical research communications. 2020 Jan 01;521(1):252-258. [Content Brief]
[2]. Shiheido H, et al. A phthalimide derivative that inhibits centrosomal clustering is effective on multiple myeloma. PloS one. 2012;7(6):e38878. [Content Brief]


Complete Stock Solution Preparation Table
Please refer to the solubility information to select the appropriate solvent. Once prepared, please aliquot and store the solution to prevent product inactivation from repeated freeze-thaw cycles.
Storage method and period of stock solution: -80°C, 6 months; -20°C, 1 month (protect from light). When stored at -80°C, please use it within 6 months. When stored at -20°C, please use it within 1 month.
| Optional Solvent | Concentration Solvent Mass | 1 mg | 5 mg | 10 mg | 25 mg |
|---|---|---|---|---|---|
| DMSO | 1 mM | 3.1017 mL | 15.5087 mL | 31.0174 mL | 77.5434 mL |
| 5 mM | 0.6203 mL | 3.1017 mL | 6.2035 mL | 15.5087 mL | |
| 10 mM | 0.3102 mL | 1.5509 mL | 3.1017 mL | 7.7543 mL | |
| 15 mM | 0.2068 mL | 1.0339 mL | 2.0678 mL | 5.1696 mL | |
| 20 mM | 0.1551 mL | 0.7754 mL | 1.5509 mL | 3.8772 mL | |
| 25 mM | 0.1241 mL | 0.6203 mL | 1.2407 mL | 3.1017 mL | |
| 30 mM | 0.1034 mL | 0.5170 mL | 1.0339 mL | 2.5848 mL | |
| 40 mM | 0.0775 mL | 0.3877 mL | 0.7754 mL | 1.9386 mL | |
| 50 mM | 0.0620 mL | 0.3102 mL | 0.6203 mL | 1.5509 mL | |
| 60 mM | 0.0517 mL | 0.2585 mL | 0.5170 mL | 1.2924 mL | |
| 80 mM | 0.0388 mL | 0.1939 mL | 0.3877 mL | 0.9693 mL | |
| 100 mM | 0.0310 mL | 0.1551 mL | 0.3102 mL | 0.7754 mL |


TC11 Related Classifications
HY-129478 Related Classifications
 Powered by Bioz