



Sapanisertib
Based on 56 publication(s) in Google Scholar
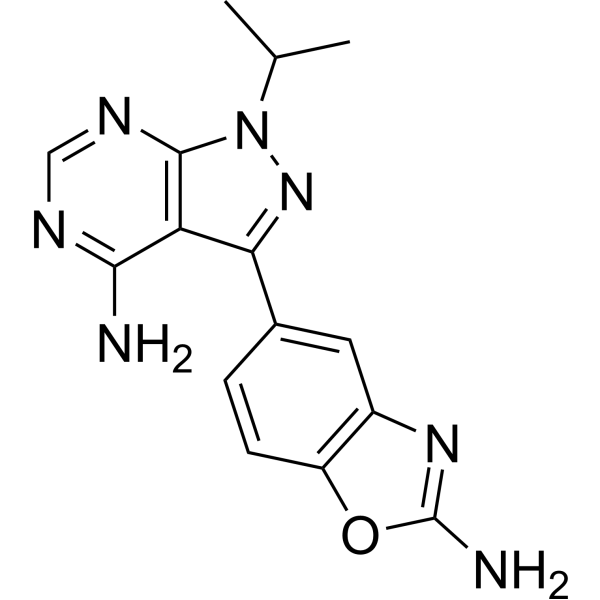
Sapanisertib (INK-128; MLN0128; TAK-228) is an orally active dual mTORC1/mTORC2 inhibitor. Sapanisertib directly and simultaneously inhibits mTORC1/2 activity through competitive binding with ATP, thereby comprehensively blocking downstream processes such as protein and lipid synthesis and cytoskeletal reorganization, consequently suppressing tumor cell proliferation and promoting apoptosis. Sapanisertib is applicable to research on melanoma, ovarian cancer, pulmonary fibrosis, and hematological malignancies.
For research use only. We do not sell to patients.
- Purity : 99.78%
- CAS No.: 1224844-38-5
- Formula: C15H15N7O
- Molecular Weight:309.33
-
Storage:Powder -20°C, 3 years , 4°C, 2 years ; In solvent -80°C, 2 years , -20°C, 1 year

To place orders, for customer services and technical support, please contact: MedChemExpress USA
Tel: 609-228-6898 E-mail: [email protected] [email protected]


-
 Biological Activity
-
Chemical Information
-
Solvent & Solubility
- Protocols
- Purity & Documentation
- References
-
 Help & FAQs


-
HY-10218
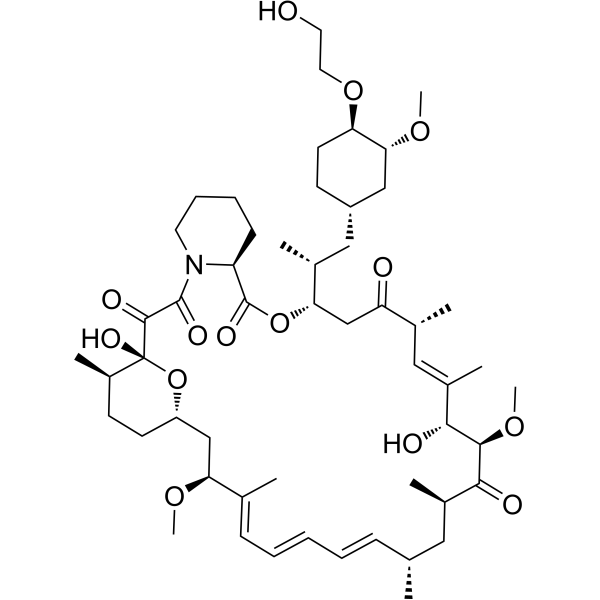
EverolimusmTORC Inhibitor -
HY-10219
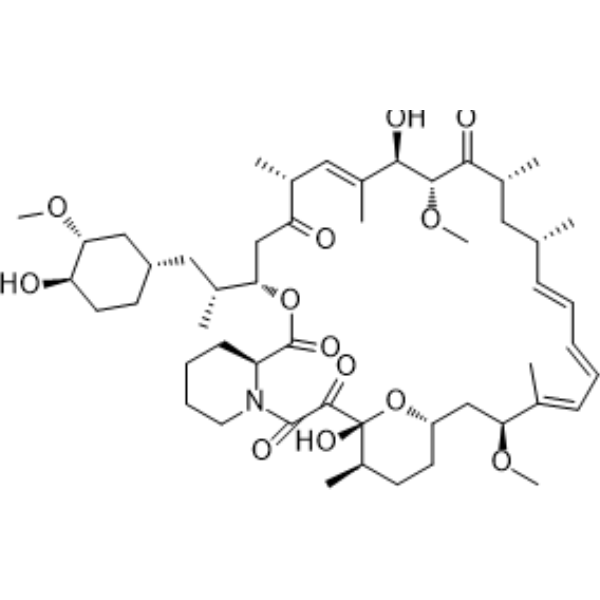
RapamycinmTOR Inhibitor -
HY-10422
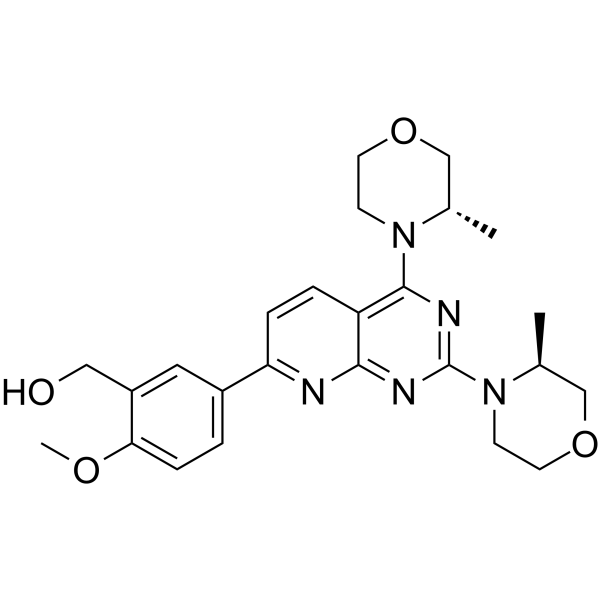
AZD-8055mTOR Inhibitor -
HY-15247
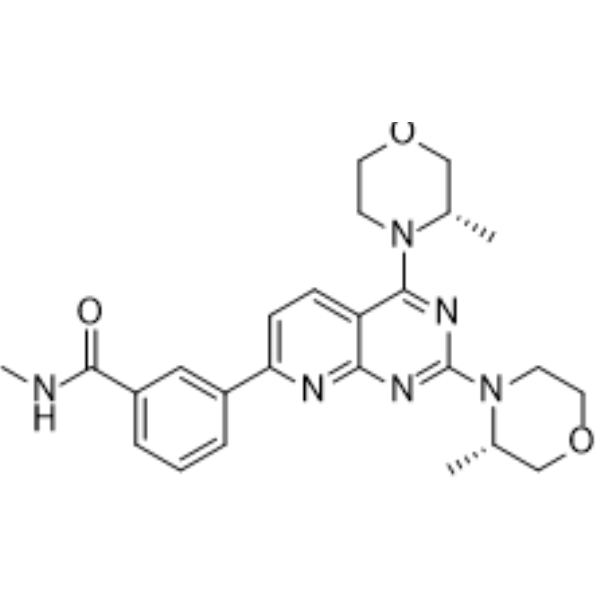
VistusertibmTORC Inhibitor -
HY-13003
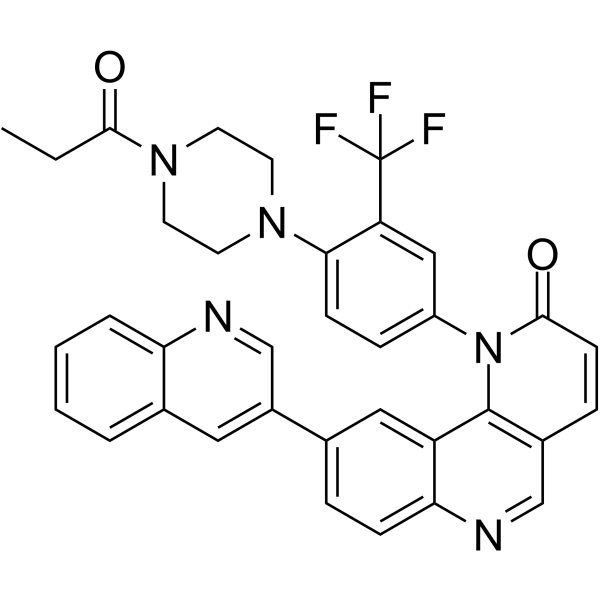
Torin 1mTOR Inhibitor -
HY-50910
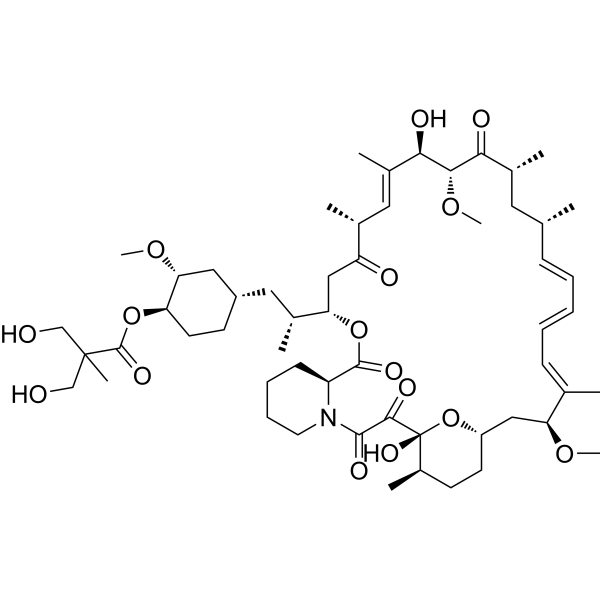
TemsirolimusmTOR Inhibitor -
HY-B0795
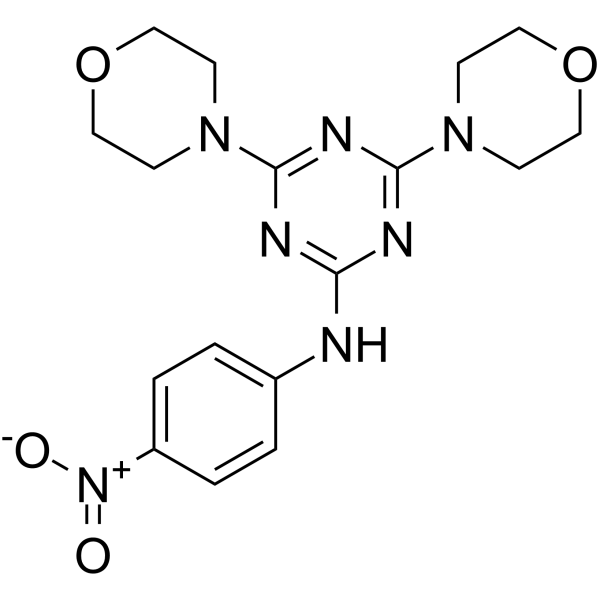
MHY1485mTOR Activator -
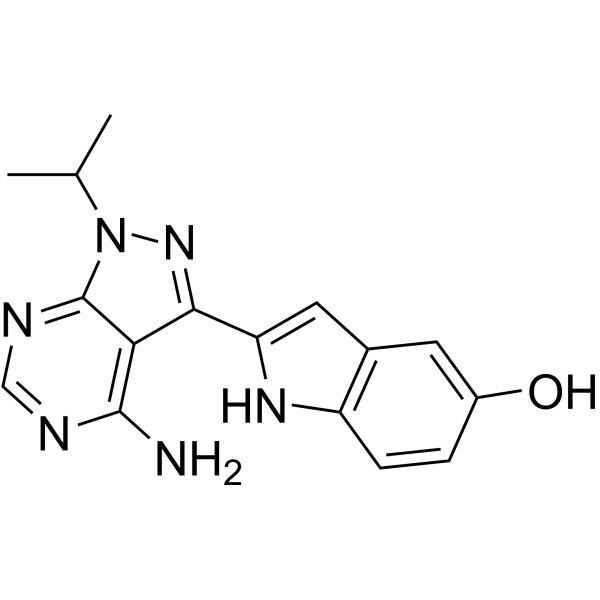
HY-10474
TorkinibmTOR Inhibitor -
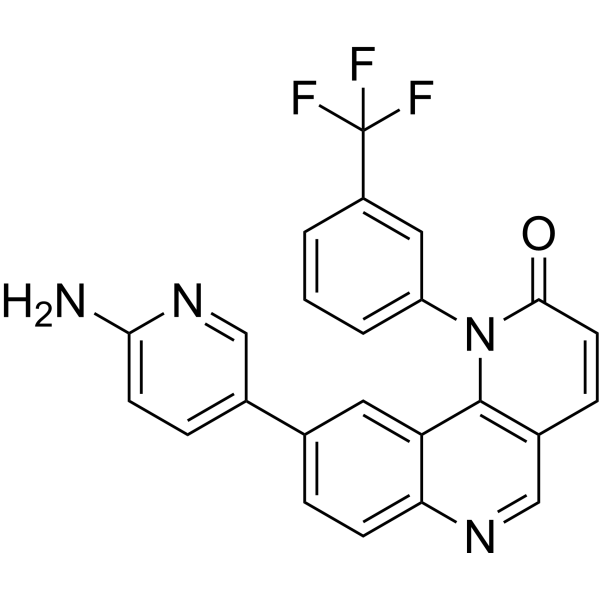
HY-13002
Torin 2mTOR Inhibitor -
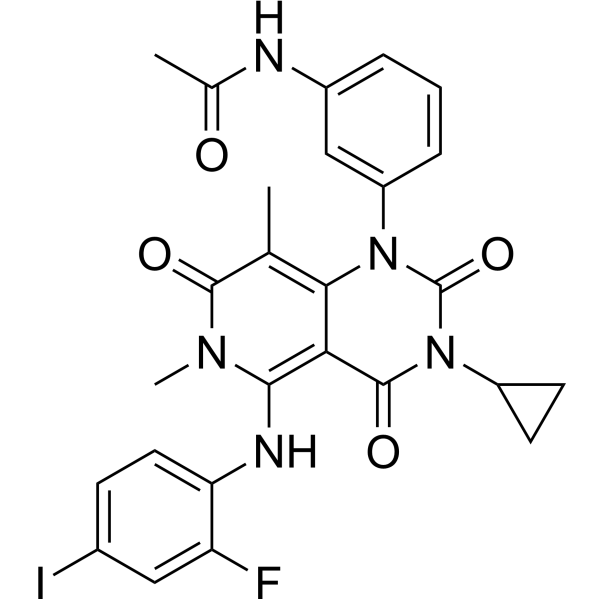
HY-10999
TrametinibMEK Inhibitor -

HY-10297
OmipalisibPI3K/mTOR Inhibitor -
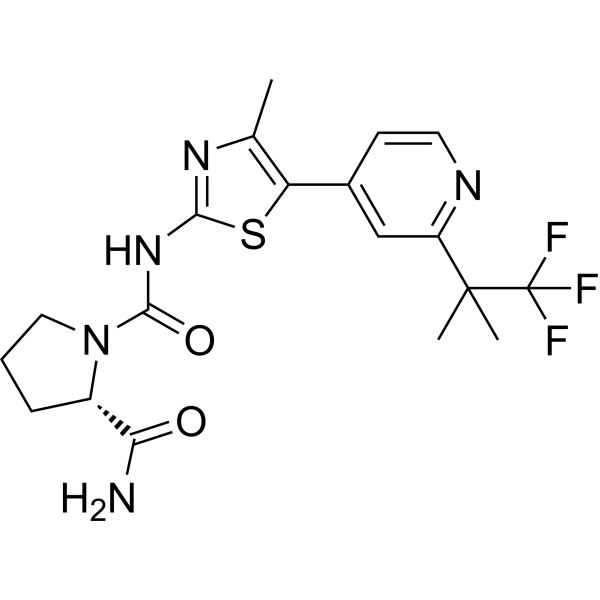
HY-15244
AlpelisibPI3Kα Inhibitor
Publications Citing Use of MedChemExpress (MCE) Sapanisertib
More- Nature. 2016 Dec 1;540(7631):119-123. [Abstract]
- Cell. 2024 Nov 14;187(23):6566-6583.e22. [Abstract]
- Cell Stem Cell. 2020 Sep 3;27(3):441-458.e10. [Abstract]
- Cell Stem Cell. 2018 Mar 1;22(3):369-383.e8. [Abstract]
- Nat Cell Biol. 2025 Jan;27(1):73-86. [Abstract]
- Nat Cell Biol. 2024 Feb;26(2):181-193. [Abstract]
- Cancer Res. 2025 Jun 6. [Abstract]
- Autophagy. 2026 May 15:1-16. [Abstract]
- Nat Commun. 2017 Jun 8:8:15617. [Abstract]
- Mol Cell. 2026 Apr 16;86(8):1546-1559.e8. [Abstract]
- Sci Transl Med. 2018 Jul 18;10(450):eaaq1093. [Abstract]
- Sci Adv. 2025 Mar 7;11(10):eadt1763. [Abstract]
- Sci Adv. 2021 Nov 12;7(46):eabi6439. [Abstract]
- Sci Adv. 2020 Aug 12;6(33):eabb8771. [Abstract]
- Cell Death Dis. 2026 May 6;17(1):600. [Abstract]
- Nat Struct Mol Biol. 2024 Oct;31(10):1625-1639. [Abstract]
- Dev Cell. 2020 Jan 27;52(2):236-250.e7. [Abstract]
- Oncogene. 2015 Mar 26;34(13):1729-35. [Abstract]
- Aging Cell. 2026 Jan 20;25(2):e70352.
- Cell Rep. 2025 Jul 17;44(8):115985. [Abstract]
- Cell Rep. 2023 Jul 4;42(7):112764. [Abstract]
- Cell Syst. 2020 Jan 22;10(1):66-81.e11. [Abstract]
- Mol Ther Nucleic Acids. 2025 Dec 15.
- Cancer Metab. 2024 Jun 30;12(1):19. [Abstract]
- Int J Mol Sci. 2022 Mar 29;23(7):3749. [Abstract]
- Front Pharmacol. 2020 Nov 11:11:580407. [Abstract]
- Chem Biol Interact. 2026 Jan 25:424:111869. [Abstract]
- Molecules. 2020 Apr 23;25(8):1980. [Abstract]
- Transl Oncol. 2021 Jan;14(1):100913. [Abstract]
- Cancers (Basel). 2022 Mar 19;14(6):1575. [Abstract]
- iScience. 2021 Sep 25;24(10):103170. [Abstract]
- J Virol. 2014 Oct;88(20):11872-85. [Abstract]
- J Photochem Photobiol B. 2020 Dec:213:112055. [Abstract]
- Microb Pathog. 2026 Apr:213:108349. [Abstract]
- Immunol Cell Biol. 2019 Jul;97(6):563-576. [Abstract]
- Biochim Biophys Acta Gen Subj. 2020 Aug;1864(8):129612. [Abstract]
- J Surg Res. 2023 Feb:282:137-146. [Abstract]
- bioRxiv. 2026 May 2.
- bioRxiv. 2026 Mar 25.
- bioRxiv. 2026 Feb 4.
- bioRxiv. 2026 Jan 14:2026.01.13.699274. [Abstract]
- Res Sq. 2025 Jul 18.
- University of Washington. 2025.
- bioRxiv. 2025 Apr 26:2025.04.24.650512. [Abstract]
- bioRxiv. 2025 January 26.
- Res Sq. 2024 Nov 1:rs.3.rs-5329081. [Abstract]
- Res Sq. 2024 Jul 15.
- University of Washington. 2024.
- Free University of Berlin. 2024.
- bioRxiv. 2024 May 15.
- bioRxiv. 2024 Mar 13:2024.03.08.584103. [Abstract]
- BioChem. 2023 Nov 9, 3(4), 170-181.
- bioRxiv. 2023 Aug 4:2023.08.04.552011. [Abstract]
- bioRxiv. 2023 May 30.
- Patent. US20220054606A1.
- Biomed Pharmacother. 2021 Jan:133:110906. [Abstract]
 Customer Validation & Images

-
WB

-
WB
-
WB
-
IF


Biological Activity
Description
|
mTORC1 |
mTORC2 |
p70S6K |
Akt |
HIF-1α |
Collagen I |
Collagen III |
Wnt5A |
Cellular Effect
|
Cell Line

|
Type | Value | Description | References |
|---|---|---|---|---|
| A549 | IC50 |
0.174 μM
Compound: MLN0128; INK128
|
Antiproliferative activity against human A549 cells assessed as inhibition of cell growth measured after 72 hrs by MTT assay
Antiproliferative activity against human A549 cells assessed as inhibition of cell growth measured after 72 hrs by MTT assay
|
[PMID: 34509167] |
| Bel-7402 | IC50 |
>100 μM
Compound: MLN0128; INK128
|
Antiproliferative activity against human Bel-7402 cells assessed as inhibition of cell growth measured after 72 hrs by MTT assay
Antiproliferative activity against human Bel-7402 cells assessed as inhibition of cell growth measured after 72 hrs by MTT assay
|
[PMID: 34509167] |
| CNE-2 | IC50 |
0.101 μM
Compound: MLN0128; INK128
|
Antiproliferative activity against human CNE-2 cells assessed as inhibition of cell growth measured after 72 hrs by MTT assay
Antiproliferative activity against human CNE-2 cells assessed as inhibition of cell growth measured after 72 hrs by MTT assay
|
[PMID: 34509167] |
| HCT-116 | IC50 |
0.048 μM
Compound: MLN0128; INK128
|
Antiproliferative activity against human HCT-116 cells assessed as inhibition of cell growth measured after 72 hrs by MTT assay
Antiproliferative activity against human HCT-116 cells assessed as inhibition of cell growth measured after 72 hrs by MTT assay
|
[PMID: 34509167] |
| HeLa | IC50 |
0.036 μM
Compound: MLN0128; INK128
|
Antiproliferative activity against human HeLa cells assessed as inhibition of cell growth measured after 72 hrs by MTT assay
Antiproliferative activity against human HeLa cells assessed as inhibition of cell growth measured after 72 hrs by MTT assay
|
[PMID: 34509167] |
| Hep 3B2 | IC50 |
4.43 μM
Compound: MLN0128; INK128
|
Antiproliferative activity against human Hep3B cells assessed as inhibition of cell growth measured after 72 hrs by MTT assay
Antiproliferative activity against human Hep3B cells assessed as inhibition of cell growth measured after 72 hrs by MTT assay
|
[PMID: 34509167] |
| HepG2 | IC50 |
1.73 μM
Compound: 5; MLN0128
|
Antiproliferative activity against human HepG2 cells assessed as inhibition of cell growth incubated for 70 hrs by CCK-8 assay
Antiproliferative activity against human HepG2 cells assessed as inhibition of cell growth incubated for 70 hrs by CCK-8 assay
|
[PMID: 37421709] |
| HepG2 | IC50 |
2.13 μM
Compound: MLN0128; INK128
|
Antiproliferative activity against human HepG2 cells assessed as inhibition of cell growth measured after 72 hrs by MTT assay
Antiproliferative activity against human HepG2 cells assessed as inhibition of cell growth measured after 72 hrs by MTT assay
|
[PMID: 34509167] |
| HL-60 | IC50 |
0.16 μM
Compound: 5; MLN0128
|
Antiproliferative activity against human HL-60 cells assessed as inhibition of cell growth incubated for 70 hrs by CCK-8 assay
Antiproliferative activity against human HL-60 cells assessed as inhibition of cell growth incubated for 70 hrs by CCK-8 assay
|
[PMID: 37421709] |
| Huh-7 | IC50 |
0.007 μM
Compound: MLN0128; INK128
|
Antiproliferative activity against human Huh-7 cells assessed as inhibition of cell growth measured after 72 hrs by MTT assay
Antiproliferative activity against human Huh-7 cells assessed as inhibition of cell growth measured after 72 hrs by MTT assay
|
[PMID: 34509167] |
| HUVEC | IC50 |
>10 μM
Compound: 5; MLN0128
|
Cytotoxicity against HUVEC assessed as inhibition of cell growth incubated for 70 hrs by CCK-8 assay
Cytotoxicity against HUVEC assessed as inhibition of cell growth incubated for 70 hrs by CCK-8 assay
|
[PMID: 37421709] |
| L02 | IC50 |
0.28 μM
Compound: MLN0128; INK128
|
Cytotoxicity against human L02 cells assessed as reduction in cell viability measured after 72 hrs by MTT assay
Cytotoxicity against human L02 cells assessed as reduction in cell viability measured after 72 hrs by MTT assay
|
[PMID: 34509167] |
| MCF7 | IC50 |
0.053 μM
Compound: MLN0128; INK128
|
Antiproliferative activity against human MCF7 cells assessed as inhibition of cell growth measured after 72 hrs by MTT assay
Antiproliferative activity against human MCF7 cells assessed as inhibition of cell growth measured after 72 hrs by MTT assay
|
[PMID: 34509167] |
| MCF7 | IC50 |
1.23 μM
Compound: 5; MLN0128
|
Antiproliferative activity against human MCF7 cells assessed as inhibition of cell growth incubated for 70 hrs by CCK-8 assay
Antiproliferative activity against human MCF7 cells assessed as inhibition of cell growth incubated for 70 hrs by CCK-8 assay
|
[PMID: 37421709] |
| MDA-MB-231 | IC50 |
0.031 μM
Compound: MLN0128; INK128
|
Antiproliferative activity against human MDA-MB-231 cells assessed as inhibition of cell growth measured after 72 hrs by MTT assay
Antiproliferative activity against human MDA-MB-231 cells assessed as inhibition of cell growth measured after 72 hrs by MTT assay
|
[PMID: 34509167] |
| PLC-PRF-5 | IC50 |
6.63 μM
Compound: MLN0128; INK128
|
Antiproliferative activity against human PLC-PRF-5 cells assessed as inhibition of cell growth measured after 72 hrs by MTT assay
Antiproliferative activity against human PLC-PRF-5 cells assessed as inhibition of cell growth measured after 72 hrs by MTT assay
|
[PMID: 34509167] |
| SK-HEP1 | IC50 |
0.008 μM
Compound: MLN0128; INK128
|
Antiproliferative activity against human SK-HEP1 cells assessed as inhibition of cell growth measured after 72 hrs by MTT assay
Antiproliferative activity against human SK-HEP1 cells assessed as inhibition of cell growth measured after 72 hrs by MTT assay
|
[PMID: 34509167] |
| SNU-423 | IC50 |
0.015 μM
Compound: MLN0128; INK128
|
Antiproliferative activity against human SNU-423 cells assessed as inhibition of cell growth measured after 72 hrs by MTT assay
Antiproliferative activity against human SNU-423 cells assessed as inhibition of cell growth measured after 72 hrs by MTT assay
|
[PMID: 34509167] |
In Vitro
Sapanisertib (INK-128) (200 nM; overnight) phosphate enhances glycolytic capacity and alters lipid metabolism in mESCs[3].
Sapanisertib (INK-128) (10-100 nM; 18 h) phosphate impairs in vitro maturation, reduces the MII formation rate, and decreases mTOR expression in mouse germinal vesicle (GV) stage oocytes[5].
Sapanisertib (40 nM; 4-24 h) phosphate inhibits mTOR and ERK pathway activation in WM3311, WM2032, WM853-2, and WM858 human skin melanoma cell lines[1].
Sapanisertib (1 nM; 72 h) phosphate inhibits TGF-β1 (HY-P78168)-induced epithelial-mesenchymal transition in A549 cells[2].
Sapanisertib (INK-128) (3 nM-3 µM; 96 h) phosphate inhibits cell growth and synergizes with ABT-737 (HY-50907) to induce cell death in patient-derived xenograft (PDX) cell models derived from HGS-OvCa[4].
Sapanisertib (10 nM; 24 h) phosphate induces apoptosis in M1 and M5 canine melanoma cell lines[1].
Sapanisertib (0.125 nM-10 μM; 72 h) phosphate potently reduces the viability of canine mucosal melanoma cell lines (UCDK9M1, UCDK9M2, UCDK9M3, UCDK9M5, Jones) and human cutaneous melanoma cell lines (WM3311, WM2032, WM853-2, WM858), with IC50 values ranging from 10 nM to 100 nM; furthermore, it exhibits synergistic effects with Trametinib (HY-10999), further decreasing cell survival in most of these cell lines[1].
Sapanisertib (INK-128) (200 nM; 24 h) phosphate induces a reversible diapause-like state in R1 (LL) and R1 (SS) mouse embryonic stem cells by inhibiting the mTORC1/2 signaling pathway and reducing the transcriptionally active epigenetic mark H4K16ac[3].
Sapanisertib (0.5-1 nM; 72 h) phosphate inhibits TGF-β1-induced L929 cell proliferation, and at 1 nM, it suppresses collagen deposition and Wnt5a/mTOR signaling pathway activation[2].
MedChemExpress (MCE) has not independently confirmed the accuracy of these methods. They are for reference only. Further protocols information, click here.
-
Cell Line:M1, M5, Jones, WM3311, WM2032, WM853-2, WM858 cells
-
Concentration:40 nmol/L
-
Incubation Time:4 h, 24 h
-
Result:Inhibited the phosphorylation of p-AKT and the downstream effector p-S6, and altered the expression of cell cycle proteins (Cyclin B1) and apoptosis-related proteins (p-BAD).
-
Cell Line:M1, M5 cells
-
Concentration:10 nM
-
Incubation Time:24 h
-
Result:Showed a trend toward inducing cell apoptosis.
-
Cell Line:A549 cells
-
Concentration:1 nM
-
Incubation Time:72 h
-
Result:Prevented the TGF-β1-induced decrease in E-cadherin protein expression.
-
Cell Line:A549 cells
-
Concentration:1 nM
-
Incubation Time:72 h
-
Result:Suppressed the TGF-β1-induced increase in vimentin expression.
-
Cell Line:L929 cells
-
Concentration:0.5, 1 nM
-
Incubation Time:72 h
-
Result:Strongly inhibited the cell proliferation induced by TGF-β1 stimulation.
-
Cell Line:L929 cells
-
Concentration:1 nM
-
Incubation Time:72 h
-
Result:Significantly reduced the TGF-β1-induced overexpression of α-SMA, collagen I, and collagen III, and decreased the protein levels of Wnt5a, mTOR, HIF-1α, and p70S6K.
-
Cell Line:mESCs (R1(LL) and R1(SS)) cells
-
Concentration:200 nM
-
Incubation Time:24 h
-
Result:Downregulated the phosphorylation of mTOR complex targets (S6, 4EBP1, Akt) and decreased the epigenetic mark H4K16ac.
-
Cell Line:HGS-OvCa PDX in vitro cultured cells (e.g., DF68, DF101, DF14)
-
Concentration:0.003, 0.01, 0.03, 0.1, 0.3, 1, 3 µM
-
Incubation Time:96 h
-
Result:Exhibited a distinct cell growth inhibition effect and further reduced cell viability when combined with ABT-737.
-
Cell Line:mouse germinal vesicle (GV) stage oocytes
-
Concentration:10, 50, 100 nM
-
Incubation Time:18 h
-
Result:Reduced the overall maturation rate from the GV stage to the MII stage and caused abnormal morphological changes such as enlarged polar bodies and increased cytoplasmic granularity.
-
Cell Line:mouse oocytes
-
Concentration:10, 50, 100 nM
-
Incubation Time:18 h
-
Result:Significantly reduced the expression of mTOR in MII stage oocytes, and abnormal spindle organization was observed.
In Vivo
Sapanisertib (INK-128) (2.0-3.0 mg/kg; p.o.; daily or every other day; 3-21 days) phosphate monotherapy inhibits the growth of canine mucosal melanoma xenografts and PI3K/AKT/mTOR pathway activity, but induces compensatory ERK activation; when administered every other day or in combination with Trametinib, both tolerability and efficacy are improved[1].
Sapanisertib (1 mg/kg; i.g.; daily administration; 14 days) phosphate attenuates pulmonary fibrosis, reduces collagen deposition, and improves pathological scores in a rat model of pulmonary fibrosis induced by intratracheal instillation of Bleomycin (HY-17565A)[2].
MedChemExpress (MCE) has not independently confirmed the accuracy of these methods. They are for reference only.
-
Animal Model:Sprague-Dawley (male, 8-9 weeks old, 180-200 g, bleomycin-induced pulmonary fibrosis model)[2]
-
Dosage:1 mg/kg
-
Administration:i.g.; once daily; 14 days
-
Result:Increased lung Hounsfield unit values compared to bleomycin-exposed alone rats.
Reduced pathological scores measured via H&E staining.
Decreased lung coefficient values.
Reduced pulmonary collagen deposition measured via Masson's trichrome staining.
Lowered Ashcroft scores.
Reduced hydroxyproline levels.
Decreased protein expression of collagen I and collagen III.
Blocked bleomycin-induced increases in Wnt5a, mTOR, HIF-1α, α-SMA, and p-p70S6K.
Reversed bleomycin-induced decreases in E-cadherin protein expression.
-
Animal Model:nu/nu athymic nude mice (6- to 8-week-old female; experimental metastasis model via intravenous tail vein injection of M1-derived metastatic subline cells)[1]
-
Dosage:2.0 mg/kg
-
Administration:p.o.; three times a week; 28 days
-
Result:Reduced intrathoracic metastatic tumor burden compared with vehicle control, but was less effective than single-agent daily trametinib.
Clinical Trial
| NCT Number | Sponsor | Condition | Start Date |
Phase
|
|---|---|---|---|---|
| NCT01329991 | Plexxikon| | 2011-05 | PHASE1 |


Chemical Information
-
CAS No. 1224844-38-5
-
Appearance Solid
-
Molecular Weight 309.33
-
Formula C15H15N7O
-
Color White to off-white
-
SMILES
NC1=NC=NC2=C1C(C3=CC4=C(C=C3)OC(N)=N4)=NN2C(C)C
-
Synonyms
INK-128; MLN0128; TAK-228
-
Shipping
Room temperature in continental US; may vary elsewhere.
-
Storage
Powder -20°C 3 years 4°C 2 years In solvent -80°C 2 years -20°C 1 year


Publications (56)
-
Journal Impact Factor
-
Most Recent
-
Nature
2016 Dec 1;540(7631):119-123. PMID: 27880763 -
Cell
2024 Nov 14;187(23):6566-6583.e22. PMID: 39332412 -
Cell Stem Cell
Histone Acetyltransferase MOF Blocks Acquisition of Quiescence in Ground-State ESCs through Activating Fatty Acid Oxidation. [Abstract]2020 Sep 3;27(3):441-458.e10. PMID: 32610040 -
Cell Stem Cell
The Transcriptionally Permissive Chromatin State of Embryonic Stem Cells Is Acutely Tuned to Translational Output. [Abstract]2018 Mar 1;22(3):369-383.e8. PMID: 29499153 -
Nat Cell Biol
Chromosome mis-segregation triggers cell cycle arrest through a mechanosensitive nuclear envelope checkpoint. [Abstract]2025 Jan;27(1):73-86. PMID: 39779939 -
Nat Cell Biol
2024 Feb;26(2):181-193. PMID: 38177284 -
Cancer Res
Genome-Wide CRISPR Screening Reveals that mTOR Inhibition Initiates Ferritinophagy and Ferroptosis in Head and Neck Cancer. [Abstract]2025 Jun 6. PMID: 40479615 -
Autophagy
African swine fever virus I10L protein inhibits autolysosome formation by disrupting RAB7-HOPS complex-dependent SNARE complex assembly. [Abstract]2026 May 15:1-16. PMID: 42138513 -
Nat Commun
2017 Jun 8:8:15617. PMID: 28593995
Sapanisertib purchased from MedChemExpress. Usage Cited in: Nat Commun. 2017 Jun 8:8:15617. [Abstract]
Immunoblot analysis of KRAS protein levels in parental (P) and resistant derivatives (R1 and R2) following 4 h treatment with the corresponding inhibitor MLN0128 (Sapanisertib).
-
Mol Cell
mTORC1 activity suppresses ferroptosis through a SCARB1-dependent HDL-tocopherol uptake pathway. [Abstract]2026 Apr 16;86(8):1546-1559.e8. PMID: 41997112 -
Sci Transl Med
PP2A inhibition is a druggable MEK inhibitor resistance mechanism in KRAS-mutant lung cancer cells. [Abstract]2018 Jul 18;10(450):eaaq1093. PMID: 30021885 -
-
Sci Adv
2021 Nov 12;7(46):eabi6439. PMID: 34767444 -
Sci Adv
2020 Aug 12;6(33):eabb8771. PMID: 32851185 -
Cell Death Dis
mTOR inhibition enhances the antitumor efficacy of pan-RAF-MEK blockade by inhibiting the ATF4-MTHFD2 pathway. [Abstract]2026 May 6;17(1):600. PMID: 42091854 -
Nat Struct Mol Biol
2024 Oct;31(10):1625-1639. PMID: 38783076 -
Dev Cell
2020 Jan 27;52(2):236-250.e7. PMID: 31991105 -
Oncogene
The ShcA adaptor activates AKT signaling to potentiate breast tumor angiogenesis by stimulating VEGF mRNA translation in a 4E-BP-dependent manner. [Abstract]2015 Mar 26;34(13):1729-35. PMID: 24837366
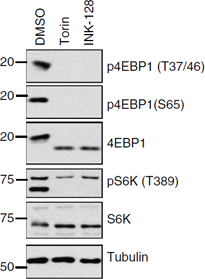
Sapanisertib purchased from MedChemExpress. Usage Cited in: Oncogene. 2015 Mar 26;34(13):1729-35. [Abstract]
INK-128 ablates phosphorylation of the mTORC1 substrates, 4E-BP1 and S6K.
-
-
Cell Rep
2025 Jul 17;44(8):115985. PMID: 40682778 -
Cell Rep
Enhanced bypass of PD-L1 translation reduces the therapeutic response to mTOR kinase inhibitors. [Abstract]2023 Jul 4;42(7):112764. PMID: 37405918 -
Cell Syst
Torin2 Exploits Replication and Checkpoint Vulnerabilities to Cause Death of PI3K-Activated Triple-Negative Breast Cancer Cells. [Abstract]2020 Jan 22;10(1):66-81.e11. PMID: 31812693 -
-
Cancer Metab
Long-acting Erwinia chrysanthemi, Pegcrisantaspase, induces alternate amino acid biosynthetic pathways in a preclinical model of pancreatic ductal adenocarcinoma. [Abstract]2024 Jun 30;12(1):19. PMID: 38951899 -
Int J Mol Sci
Differential Oxygen Exposure Modulates Mesenchymal Stem Cell Metabolism and Proliferation through mTOR Signaling. [Abstract]2022 Mar 29;23(7):3749. PMID: 35409106 -
Front Pharmacol
CC-223, NSC781406, and BGT226 Exerts a Cytotoxic Effect Against Pancreatic Cancer Cells via mTOR Signaling. [Abstract]2020 Nov 11:11:580407. PMID: 33343350 -
Chem Biol Interact
Hexavalent chromium promotes malignant transformation via enhanced translation of SUV39H1. [Abstract]2026 Jan 25:424:111869. PMID: 41371533 -
Molecules
In Vitro and in Vivo Activity of mTOR Kinase and PI3K Inhibitors Against Leishmania donovani and Trypanosoma brucei. [Abstract]2020 Apr 23;25(8):1980. PMID: 32340370 -
Transl Oncol
Enhanced efficacy of JAK1 inhibitor with mTORC1/C2 targeting in smoldering/chronic adult T cell leukemia. [Abstract]2021 Jan;14(1):100913. PMID: 33129109 -
Cancers (Basel)
Identification of New Vulnerabilities in Conjunctival Melanoma Using Image-Based High Content Drug Screening. [Abstract]2022 Mar 19;14(6):1575. PMID: 35326726 -
iScience
2021 Sep 25;24(10):103170. PMID: 34646996 -
J Virol
Epstein-Barr virus-encoded latent membrane protein 2A promotes the epithelial-mesenchymal transition in nasopharyngeal carcinoma via metastatic tumor antigen 1 and mechanistic target of rapamycin signaling induction. [Abstract]2014 Oct;88(20):11872-85. PMID: 25100829
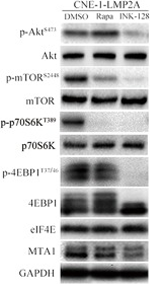
Sapanisertib purchased from MedChemExpress. Usage Cited in: J Virol. 2014 Oct;88(20):11872-85. [Abstract]
Representative Western blot from two independent experiments of p-Akt, p-mTOR, mTOR, p-4EBP1, 4EBP1, eIF4E, c-myc, and MTA1 genes in CNE-1-LMP2A cells treated with Rapamycin (50 nM) or INK-128 (200 nM) for 24 h. The quantification of the Western blot signals are analyzed.
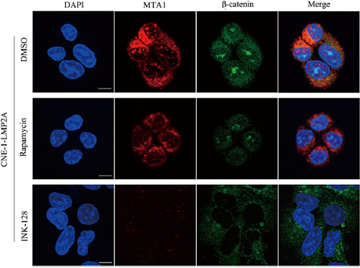
Sapanisertib purchased from MedChemExpress. Usage Cited in: J Virol. 2014 Oct;88(20):11872-85. [Abstract]
Confocal analysis of MTA1 (red) and β-catenin (green) expression in CNE-1-LMP2A cells treated with Rapamycin (50 nM) or INK-128 (200 nM) for 24 h. The scale bar represents 10 μm. Immunofluorescence analysis of MTA1 and β-catenin expression reveals that MTA1 is decreased and β-catenin is maintained in the cytoplasm when the cells are treated with INK-128.
-
J Photochem Photobiol B
Directly imaging the localisation and photosensitization properties of the pan-mTOR inhibitor, AZD2014, in living cancer cells. [Abstract]2020 Dec:213:112055. PMID: 33142217 -
Microb Pathog
mTORC2-dependent autophagy inhibition regulates the replication of HSV-1 and adenovirus in viral keratitis & conjunctivitis. [Abstract]2026 Apr:213:108349. PMID: 41628839 -
Immunol Cell Biol
Macrophage ERα promoted invasion of endometrial cancer cell by mTOR/KIF5B-mediated epithelial to mesenchymal transition. [Abstract]2019 Jul;97(6):563-576. PMID: 30779215 -
Biochim Biophys Acta Gen Subj
2020 Aug;1864(8):129612. PMID: 32272203 -
J Surg Res
2023 Feb:282:137-146. PMID: 36274448 -
-
-
-
bioRxiv
Decreased tRNA abundance contributes to decreased translation elongation rate in a prolonged mitosis. [Abstract]2026 Jan 14:2026.01.13.699274. PMID: 41648386 -
-
-
bioRxiv
Capacity for compensatory cyclin D2 response confers trametinib resistance in canine mucosal melanoma. [Abstract]2025 Apr 26:2025.04.24.650512. PMID: 40568110 -
-
Res Sq
Transcriptional Regulation of Protein Synthesis by Mediator Kinase Represents a Therapeutic Vulnerability in MYC-driven Medulloblastoma. [Abstract]2024 Nov 1:rs.3.rs-5329081. PMID: 39574899 -
-
-
-
-
bioRxiv
Transcriptional Regulation of Protein Synthesis by Mediator Kinase in MYC-driven Medulloblastoma. [Abstract]2024 Mar 13:2024.03.08.584103. PMID: 38559100 -
-
bioRxiv
2023 Aug 4:2023.08.04.552011. PMID: 37577705 -
-
-
Biomed Pharmacother
Combined inhibition of RNA polymerase I and mTORC1/2 synergize to combat oral squamous cell carcinoma. [Abstract]2021 Jan:133:110906. PMID: 33190037


Solvent & Solubility
In Vitro:
DMSO : 55 mg/mL (177.80 mM; Need ultrasonic; Hygroscopic DMSO has a significant impact on the solubility of product, please use newly opened DMSO)
Please refer to the solubility information to select the appropriate solvent. Once prepared, please aliquot and store the solution to prevent product inactivation from repeated freeze-thaw cycles.
Storage method and period of stock solution: -80°C, 2 years; -20°C, 1 year. When stored at -80°C, please use it within 2 years. When stored at -20°C, please use it within 1 year.
Please refer to the solubility information to select the appropriate solvent. Once prepared, please aliquot and store the solution to prevent product inactivation from repeated freeze-thaw cycles.
Storage method and period of stock solution: -80°C, 2 years; -20°C, 1 year. When stored at -80°C, please use it within 2 years. When stored at -20°C, please use it within 1 year.
Concentration (start) × Volume (start) = Concentration (final) × Volume (final)
In Vivo:
Select the appropriate dissolution method based on your experimental animal and administration route.
- For the following dissolution methods, please ensure to first prepare a clear stock solution using an In Vitro approach and then sequentially add co-solvents:
- To ensure reliable experimental results, the clarified stock solution can be appropriately stored based on storage conditions. As for the working solution for In Vivo experiments, it is recommended to prepare freshly and use it on the same day.
- The percentages shown for the solvents indicate their volumetric ratio in the final prepared solution. If precipitation or phase separation occurs during preparation, heat and/or sonication can be used to aid dissolution.
Add each solvent one by one: 10% DMSO 40% PEG300 5% Tween-80 45% Saline
Solubility: ≥ 2.08 mg/mL (6.72 mM); Clear solution
This protocol yields a clear solution of ≥ 2.08 mg/mL (saturation unknown).
Taking 1 mL working solution as an example, add 100 μL DMSO stock solution (20.8 mg/mL) to 400 μL PEG300, and mix evenly; then add 50 μL Tween-80 and mix evenly; then add 450 μL Saline to adjust the volume to 1 mL.
Preparation of Saline: Dissolve 0.9 g sodium chloride in ddH₂O and dilute to 100 mL to obtain a clear Saline solution.
Add each solvent one by one: 10% DMSO 90% (20% SBE-β-CD in Saline)
Solubility: ≥ 2.08 mg/mL (6.72 mM); Clear solution
This protocol yields a clear solution of ≥ 2.08 mg/mL (saturation unknown).
Taking 1 mL working solution as an example, add 100 μL DMSO stock solution (20.8 mg/mL) to 900 μL 20% SBE-β-CD in Saline, and mix evenly.
Preparation of 20% SBE-β-CD in Saline (4°C, storage for one week): 2 g SBE-β-CD powder is dissolved in 10 mL Saline, completely dissolve until clear.
In Vivo Dissolution Calculator
Please enter the basic information of animal experiments:
-
-
-
-
Recommended: Prepare an additional quantity of animals to account for potential losses during experiments.
Please enter your animal formula composition:
-
%DMSO +
Recommended: Keep the proportion of DMSO in working solution below 2% if your animal is weak.
-
%+
-
+%Tween-80 + +
-
%Saline +
The co-solvents required include: DMSO, . All of co-solvents are available by MedChemExpress (MCE). , Tween 80. All of co-solvents are available by MedChemExpress (MCE).
Working solution concentration: 0.22 mg/mL
Method for preparing stock solution: mg drug dissolved in μL DMSO. Stock solution concentration: mg/mL.
1. Take μL DMSO stock solution;
2. Add μL .
μL , mix evenly;
3. Then add μL Tween 80, mix evenly;
4. Then add μL
Please ensure that the stock solution in the first step is dissolved to a clear state, and add co-solvents in sequence. You can use ultrasonic heating (ultrasonic cleaner, recommended frequency 20-40 kHz), vortexing, etc. to assist dissolution.

Protocols
-
Collagen: Sirius Red Staining
Sirius Red or picrosirius red staining is a histochemical method for visualizing collagen-rich extracellular matrix in tissue sections, and collagen fibers are detected as red-stained structures under bright-field microscopy with enhanced birefringence under polarized light. Picrosirius red is useful for assessing total collagen organization, distribution, and fibrosis burden, but polarized color should not be interpreted as a definitive collagen type I versus type III readout because color is affected by fiber orientation, thickness, and packing.
-
Annexin V plus membrane-impermeant dye apoptosis staining
Annexin V-based apoptosis assays rely on the detection of phosphatidylserine (PS) externalization from the inner leaflet of the plasma membrane to the outer leaflet, an early biochemical hallmark of apoptosis. Fluorescently labeled Annexin V binds PS in a calcium-dependent manner, enabling identification of early apoptotic cells by flow cytometry or fluorescence microscopy. When combined with a membrane-impermeant DNA-binding dye (e. g. , propidium iodide), this approach allows discrimination between viable (Annexin V−/dye−), early apoptotic (Annexin V+/dye−), and late apoptotic or necrotic (Annexin V+/dye+) cell populations by assessing membrane integrity and PS exposure.
-
BrdU Incorporation Assay
Bromodeoxyuridine (BrdU) incorporation assay is based on the principle that BrdU, a thymidine analog, is incorporated into newly synthesized DNA during the S phase of the cell cycle, thereby serving as a marker of DNA replication and cellular proliferation. Incorporated BrdU can be detected using anti-BrdU antibodies following DNA denaturation, enabling visualization or quantification of proliferating cells through immunochemical detection methods such as immunofluorescence or immunohistochemistry.
-
Somatic Cell Culture
A method of simulating the in vivo environment in vitro to maintain the cell growth, differentation and main functions.
-
Connective Tissue: Masson's Trichrome/Collagen Trichrome Staining
Masson’s Trichrome (collagen/trichrome staining) is a histological technique that differentially stains tissue compartments using sequential acidic dyes to distinguish collagen from muscle and cytoplasmic components based on dye affinity and tissue permeability differences, enabling visualization of fibrosis and connective tissue architecture in histological sections. The classical formulation typically uses Weigert's iron hematoxylin for nuclear staining, Biebrich scarlet-acid fuchsin for cytoplasm and muscle, and aniline blue (or light green variants) for collagen, producing a characteristic blue/green collagen signal contrasted against red cytoplasm and dark nuclei. The staining principle relies on selective displacement of smaller dye molecules by larger anionic dyes in collagen-rich regions under controlled acidified conditions, which enhances collagen-specific dye retention. This property makes the method widely used for fibrosis assessment in organs such as heart, liver, lung, a
-
CFSE Dye Dilution Proliferation Assay
The CFSE (carboxyfluorescein diacetate succinimidyl ester) dye dilution proliferation assay is based on the covalent labeling of intracellular proteins by a cell-permeant fluorescent dye that becomes fluorescent upon intracellular ester cleavage and then is stably retained within cells. As labeled cells divide, the dye is partitioned equally between daughter cells, resulting in a stepwise halving of fluorescence intensity that can be quantified by flow cytometry to determine the number of cell divisions undergone by each cell population. This fluorescence dilution approach enables quantitative tracking of lymphocyte proliferation at the single-cell level over multiple rounds of division. CFSE-based proliferation analysis has been widely applied to measure antigen-driven lymphocyte expansion in vitro, where discrete fluorescence peaks correspond to successive cell divisions and allow reconstruction of proliferative history within heterogeneous populations.
-
Dye-dilution cell tracking and proliferation staining
Dye-dilution cell tracking assays quantify cell proliferation by covalently labeling intracellular proteins with a stable fluorescent dye that is equally partitioned between daughter cells during mitosis, resulting in stepwise halving of fluorescence intensity with each cell division as measured by flow cytometry histograms. Carboxyfluorescein diacetate succinimidyl ester (CFSE) is a prototypical dye that diffuses into cells, is enzymatically converted into a fluorescent compound, and then covalently binds intracellular amine groups, producing long-lived fluorescence suitable for tracking multiple rounds of division in vitro and in vivo. Successive generations of dividing cells form discrete peaks of decreasing fluorescence intensity, enabling estimation of proliferation history, precursor frequency, and division index within heterogeneous populations. Alternative dyes such as CellTrace Violet (CTV) and far-red membrane dyes (e. g. , PKH26) follow the same dilution principle but differ
-
CCK-8/WST-8 Cell Proliferation Assay
The CCK-8/WST-8 assay is based on the reduction of the water-soluble tetrazolium salt WST-8 to a water-soluble formazan product by cellular dehydrogenases in metabolically active cells, where the generated formazan amount is proportional to the number of living cells and is quantified by measuring absorbance in the visible range, providing a colorimetric readout for cell viability and proliferation assessment. This class of tetrazolium-based assays improves upon earlier MTT-based systems by producing a water-soluble formazan, eliminating the need for organic solubilization steps and enabling direct spectrophotometric measurement in culture medium.
-
Protocol for Cell Cycle
Cell-cycle analysis by flow cytometry measures DNA content in single cells to estimate the fraction of cells in G0/G1, S, and G2/M phases. Propidium iodide intercalates into DNA, and after RNA removal with RNase, fluorescence intensity reflects cellular DNA content: 2N cells are assigned to G0/G1, cells between 2N and 4N to S phase, and 4N cells to G2/M. DNA-content analysis alone cannot reliably separate G0 from G1 or G2 from M. Ki-67 can distinguish quiescent G0 cells from cycling cells, EdU or BrdU incorporation marks active DNA synthesis in S phase, and phospho-histone H3 staining identifies mitotic cells within the 4N population.
-
Cell Counting-Based Growth Curve Assay
Cell counting-based growth curve assays quantify cell proliferation by directly measuring changes in viable cell number over time using manual or automated counting methods such as hemocytometer-based counting or instrument-assisted cell enumeration, enabling construction of growth curves that reflect population expansion dynamics in response to culture conditions. A widely used approach is trypan blue exclusion with hemocytometer counting, where membrane-compromised (non-viable) cells take up the dye, allowing discrimination between viable and non-viable cells while simultaneously enabling total cell number quantification. Repeated sampling across time points allows estimation of proliferation rate, growth phases, and comparative growth kinetics between experimental conditions.
-
Colony Formation (Clonogenic) Assay
The clonogenic (colony formation) assay measures the ability of a single cell to retain reproductive viability and form a macroscopic colony, typically defined as a cluster derived from one progenitor cell after a defined growth period. This assay is widely used to evaluate cell survival after exposure to ionizing radiation or cytotoxic treatments and is considered a standard method in radiation biology for generating dose-response relationships of reproductive cell death. Colony formation reflects long-term proliferative capacity rather than short-term metabolic activity, and survival is quantified by comparing treated versus untreated conditions based on colony number and derived survival fractions.
-
Phalloidin F-actin cytoskeleton staining
Phalloidin F-actin staining detects polymerized filamentous actin in fixed and permeabilized specimens by using fluorescent phalloidin or phalloidin-derived phallotoxins that bind actin filaments and generate a fluorescence microscopy readout corresponding to F-actin organization, including stress fibers, cortical actin, filament bundles, and tissue-specific actin networks. Phalloidin stabilizes F-actin by reducing actin subunit dissociation from filament ends, and fluorescent phallotoxins were established as tools for visualizing actin-containing structures in eukaryotic cells.
-
Cell Viability Determination by MTT Colorimetric Assay
The following protocol uses the MTT colorimetric assay as a classic literature-established method for assessing cell viability/metabolic activity in cultured mammalian cells. MTT[3-(4,5-dimethylthiazol-2-yl)-2,5-diphenyltetrazolium bromide] is reduced by metabolically active cells to a colored formazan product; the amount of formazan is quantified spectrophotometrically and provides an indirect measure of metabolically active viable cells. Importantly, MTT reduction reflects cellular oxidoreductase/metabolic activity rather than an absolute direct count of living cells, so changes in cellular metabolism can alter the signal independently of cell number.
-
Fibrosis/Collagen Morphometry
Fibrosis and collagen morphometry is based on the quantitative visualization of fibrillar collagen deposition in tissue sections using histochemical stains such as Sirius Red (Picrosirius Red) or Masson's trichrome, followed by image-based or polarization-enhanced analysis to estimate collagen proportional area as a surrogate of extracellular matrix accumulation during fibrotic remodeling. Sirius Red combined with polarized light microscopy enhances detection of collagen fibers due to birefringence properties, enabling more specific visualization of collagen type I and III fibrils compared to conventional bright-field histology, while whole-section or region-restricted digital morphometry reduces field-selection bias in fibrosis assessment. Alternative quantitative approaches include second harmonic generation (SHG) and two-photon excited fluorescence microscopy, which enable label-free detection of fibrillar collagen and have been validated against histological staining and biochemica
-
EdU Incorporation Assay (Click Chemistry-Based DNA Synthesis Measurement)
The EdU incorporation assay measures DNA synthesis by adding the thymidine analog 5-ethynyl-2′-deoxyuridine to cells or tissues, where it is incorporated into newly synthesized DNA during S phase. Incorporated EdU is detected by copper-catalyzed azide-alkyne cycloaddition, in which a fluorescent azide covalently reacts with the ethynyl group on EdU, allowing S-phase cells to be detected by fluorescence microscopy, flow cytometry, or high-content imaging. EdU detection does not require DNA denaturation or anti-BrdU antibody access, which preserves sample structure and improves compatibility with immunostaining and multiparameter cytometry compared with BrdU-based detection. EdU can be cytotoxic in a cell-type- and exposure-dependent manner, so pulse duration, concentration, and continuous-labeling designs should be validated for each cell type.
-
Ki-67 Immunostaining Proliferation Assay
Ki-67 immunostaining measures the growth fraction of a cell population by detecting Ki-67, a nuclear antigen present in proliferating cells and absent in quiescent G0 cells. The readout is the percentage of Ki-67-positive nuclei among total counted cells, commonly called the Ki-67 labeling index or proliferation index.
-
Apoptosis
Apoptosis, also called programmed cell death, is generally characterized by distinct morphological characteristics.
-
TUNEL staining for apoptotic DNA fragmentation
TUNEL staining detects DNA strand breaks by using terminal deoxynucleotidyl transferase to add labeled nucleotides to exposed 3′-OH DNA termini, generating either microscopic staining in fixed cells or tissue sections, or fluorescence/cytometric signal in cell suspensions. TUNEL positivity reflects DNA fragmentation but should not be interpreted alone as definitive apoptosis, because TUNEL can also label necrotic, autolytic, mechanically damaged, or DNA-repair-associated DNA breaks.
-
PCNA Immunodetection Proliferation Assay
PCNA immunodetection measures proliferative activity by detecting proliferating cell nuclear antigen, a nuclear protein associated with DNA polymerase δ function and DNA replication. The assay readout is the proportion of PCNA-positive nuclei among total counted cells, but PCNA labeling is not identical to BrdU labeling because PCNA can mark late G1/early S-associated replication competence and may persist beyond active DNA synthesis depending on fixation and extraction conditions.
-
Protocol for Cell Counting and Cell Density Analysis
Cell counting and cell-density analysis estimate the number of cells in a known volume or field area. Manual hemocytometer counting uses a chamber of defined geometry to convert counted cells into cells/mL, while automated counters and image-analysis workflows detect cell objects from optical, brightfield, fluorescence, impedance, or digital-image features. Trypan blue viability counting is based on dye exclusion: viable cells with intact membranes exclude dye, while non-viable cells with compromised membranes stain blue. The readout is total cell density, viable-cell density, dead-cell density, and percent viability. Cell density can also be estimated from microscopy images by counting objects per image area, from flow cytometry using calibrated volume or reference particles, or from in situ microscopy in bioreactors after calibration against reference methods such as hemocytometer or flow cytometry.
-
Apoptosis Solutions
Apoptosis is a regulated, generally non-lytic cell-death pathway that removes unwanted, damaged, infected, or abnormal cells through coordinated morphological changes, caspase activation, DNA fragmentation, and membrane remodeling. The intrinsic apoptosis pathway is controlled mainly by mitochondrial outer membrane permeabilization, BCL-2 family proteins, cytochrome c release, apoptosome formation, caspase-9 activation, and downstream executioner caspase-3/7 activation. The extrinsic apoptosis pathway is initiated by death receptors such as Fas, TNFR, and TRAIL receptors, which recruit adaptor proteins and activate caspase-8 before engaging executioner caspases or mitochondrial amplification through BID cleavage. Apoptosis is linked to many phenotypes, including cancer cell killing, tissue homeostasis, immune regulation, neurodegeneration, infection response, and treatment-induced cytotoxicity; unresolved questions include how apoptosis interacts with necroptosis, pyroptosis, ferroptos
-
MTT Cell Proliferation Assay
The MTT assay is a colorimetric endpoint assay for estimating viable cell number, cell growth, cytotoxicity, or cell activation in cultured mammalian cells. Living cells reduce the yellow tetrazolium salt MTT into purple/blue formazan, while dead cells do not generate the same signal; the resulting color can be quantified with a multiwell spectrophotometer. MTT reduction is commonly interpreted as a readout of metabolic activity that often correlates with viable cell number, but it should not be treated as a direct cell-counting method unless the assay is optimized for the cell type and experimental condition. Studies show that MTT reduction can involve mitochondrial and non-mitochondrial reducing systems, and formazan may accumulate in intracellular lipid droplets rather than simply marking mitochondria.


Purity & Documentation
-
Data Sheet (309 KB)
-
SDS (396 KB)
- English - EN (396 KB)
- Français - FR (396 KB)
- Deutsch - DE (396 KB)
- Norwegian - NO (396 KB)
- Español - ES (396 KB)
- Swedish - SV (396 KB)
- Italian - IT (396 KB)
- Korean - KR (396 KB)
- Portuguese - PT (396 KB)
-
Handling Instructions (2659 KB)
References


Complete Stock Solution Preparation Table
Please refer to the solubility information to select the appropriate solvent. Once prepared, please aliquot and store the solution to prevent product inactivation from repeated freeze-thaw cycles.
Storage method and period of stock solution: -80°C, 2 years; -20°C, 1 year. When stored at -80°C, please use it within 2 years. When stored at -20°C, please use it within 1 year.
| Optional Solvent | Concentration Solvent Mass | 1 mg | 5 mg | 10 mg | 25 mg |
|---|---|---|---|---|---|
| DMSO | 1 mM | 3.2328 mL | 16.1640 mL | 32.3279 mL | 80.8198 mL |
| 5 mM | 0.6466 mL | 3.2328 mL | 6.4656 mL | 16.1640 mL | |
| 10 mM | 0.3233 mL | 1.6164 mL | 3.2328 mL | 8.0820 mL | |
| 15 mM | 0.2155 mL | 1.0776 mL | 2.1552 mL | 5.3880 mL | |
| 20 mM | 0.1616 mL | 0.8082 mL | 1.6164 mL | 4.0410 mL | |
| 25 mM | 0.1293 mL | 0.6466 mL | 1.2931 mL | 3.2328 mL | |
| 30 mM | 0.1078 mL | 0.5388 mL | 1.0776 mL | 2.6940 mL | |
| 40 mM | 0.0808 mL | 0.4041 mL | 0.8082 mL | 2.0205 mL | |
| 50 mM | 0.0647 mL | 0.3233 mL | 0.6466 mL | 1.6164 mL | |
| 60 mM | 0.0539 mL | 0.2694 mL | 0.5388 mL | 1.3470 mL | |
| 80 mM | 0.0404 mL | 0.2020 mL | 0.4041 mL | 1.0102 mL | |
| 100 mM | 0.0323 mL | 0.1616 mL | 0.3233 mL | 0.8082 mL |


Sapanisertib Related Classifications
HY-13328 Related Classifications
 Powered by Bioz
Keywords
- Sapanisertib
- 1224844-38-5
- INK-128
- MLN0128
- TAK-228
- INK128
- INK 128
- MLN0128
- MLN 0128
- MLN-0128
- TAK228
- TAK 228
- TAK-228
- mTOR
- Apoptosis
- Akt
- ERK
- CDK
- Ribosomal S6 Kinase (RSK)
- Collagen
- HIF/HIF Prolyl-Hydroxylase
- Wnt
- mTORC1
- S6
- 4EBP-1
- AKT
- embryonic stem cells
- apoptosis
- pulmonary fibrosis
- mTORC2
- PI3K/AKT/mTOR signaling
- melanoma
- Inhibitor
- inhibitor
- inhibit