



Brassinin
Based on 2 publication(s) in Google Scholar
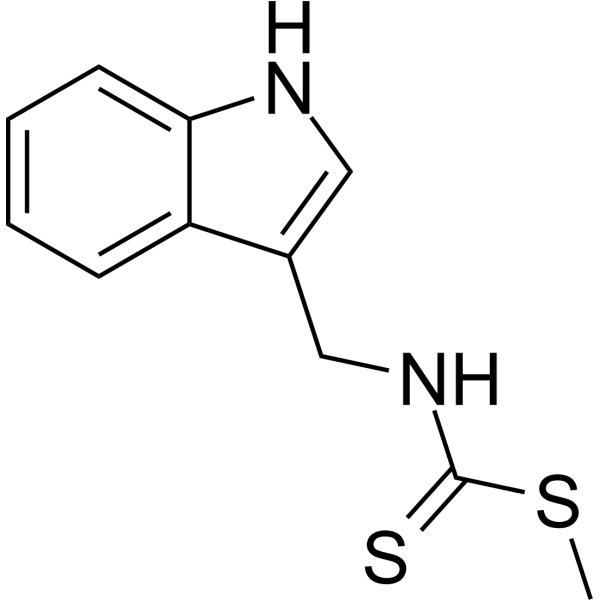
Brassinin is an indole derivative found in cruciferous plants. Brassinin acts as an IDO inhibitor (Ki = 97.7 μM). Brassinin inhibits angiogenesis and induces apoptosis, autophagy, paraptosis, ROS production, and ER stress. Brassinin selectively stimulates lysosomal degradation of Tie2 and promotes lysosomal and proteasomal degradation of FGFR1 in endothelial cells, downregulating AKT and ERK phosphorylation. Brassinin inhibits endothelial cell proliferation, migration, tube formation, spheroid sprouting, and angiogenesis. Brassinin inhibits PI3K/Akt/mTOR/S6K1 signaling, upregulates p21 and p27, and induces G1 phase cell cycle arrest through RB hypophosphorylation. Brassinin inhibits tyrosinase catalytic activity, reduces tyrosinase mRNA, and inhibits MITF nuclear translocation. Brassinin is used for research on triple-negative breast cancer, chronic myeloid leukemia, colon cancer, glioma, atherosclerosis, and skin cancer.
Nur für Forschungszwecke. Wir verkaufen nicht an Patienten.
- Reinheit : 99.80%
- CAS. Nr.: 105748-59-2
- Formel: C11H12N2S2
- Molecular Weight:236.37
-
Speicherung:
-20°C, protect from light
* In solvent : -80°C, 6 months; -20°C, 1 month (protect from light)

To place orders, for customer services and technical support, please contact: MedChemExpress USA
Tel: 609-228-6898 E-mail: [email protected] [email protected]


-
 Biologische Aktivität
-
Chemical Information
-
Lösungsmittel & Löslichkeit
- Protokoll
- Reinheit & Dokumentation
- Verweise
-
 Help & FAQs


Publications Citing Use of MedChemExpress (MCE) Brassinin
MoreAlle Endogenous Metabolite Isoform-spezifische Produkte anzeigen
More

Biologische Aktivität
Beschreibung
IC50 & Target
[5]|
IDO 97.7 μM (Ki) |
Cellular Effect
|
Cell Line

|
Type | Value | Description | References |
|---|---|---|---|---|
| LN-229 | IC50 |
200.8 μM
|
Antiproliferative activity against human LN229 glioma cells assessed as reduction in cell viability incubated for 48 hrs by CCK8 assay.
Antiproliferative activity against human LN229 glioma cells assessed as reduction in cell viability incubated for 48 hrs by CCK8 assay.
|
42674968 |
| U-373MG ATCC | IC50 |
325.6 μM
|
Antiproliferative activity against human U373 glioma cells assessed as reduction in cell viability incubated for 48 hrs by CCK8 assay.
Antiproliferative activity against human U373 glioma cells assessed as reduction in cell viability incubated for 48 hrs by CCK8 assay.
|
42674968 |
| T98G | IC50 |
236.7 μM
|
Antiproliferative activity against human T98G glioma cells assessed as reduction in cell viability incubated for 48 hrs by CCK8 assay.
Antiproliferative activity against human T98G glioma cells assessed as reduction in cell viability incubated for 48 hrs by CCK8 assay.
|
42674968 |
In Vitro
Brassinin (2.5-100 µM; 48 h) preferentially reduces the viability of HUVECs and HDMECs compared with pericytes, fibroblasts, and breast cancer cells[1].
Brassinin (25-100 µM; 6 h, then additional 18 h with BrdU (5-BrdU) (HY-15910)) inhibits HUVEC proliferation in a dose-dependent manner[1].
Brassinin (25-100 µM; 24 h) inhibits HUVEC migration in a dose-dependent manner[1].
Brassinin (25-100 µM; 24 h) inhibits HUVEC tube formation, causing a 78% reduction in tube network structures at 100 µM[1].
Brassinin (25-100 µM; 24 h) inhibits HUVEC spheroid sprouting in a dose-dependent manner[1].
Brassinin (25-100 µM; 2 h) selectively downregulates Tie2 and FGFR1 protein levels in HUVECs and inhibits AKT and ERK phosphorylation[1].
Brassinin promotes the degradation of Tie2 and FGFR1 proteins in HUVECs, with only a slight effect on Tie2 mRNA and no effect on FGFR1 mRNA[1].
Brassinin (100-400 μM; 24 h) does not affect basal proliferation but significantly reverses Ang II (Angiotensin II human) (HY-13948)-induced proliferation of mouse aortic SMCs[6].
Brassinin (100 μM; 24 h) significantly attenuates Ang II-induced migration of mouse aortic SMCs without affecting basal migration[6].
Brassinin (100 μM; 24 h) reverses the Ang II-induced decrease in SM α-actin and calponin expression in mouse aortic SMCs[6].
Brassinin (100 μM; 24 h) significantly upregulates CSE protein expression in mouse aortic SMCs without affecting 3-MST levels[6].
Brassinin (100 μM; 24 h) significantly induces CSE mRNA levels in mouse aortic SMCs[6].
Brassinin (100 μM; 24 h) significantly enhances the binding of C/EBPβ to the CSE promoter in mouse aortic SMCs[6].
Brassinin stimulates lysosomal degradation of Tie2 and both lysosomal and proteasomal degradation of FGFR1 in HUVECs[1].
Brassinin (10-100 µM; 24 h) exhibits cytotoxicity against KBM5, KCL22, and LAMA84 CML cells, while showing low cytotoxicity toward PBMCs[2].
Brassinin (50 µM; 24 h) reduces the viability of CML cells[2].
Brassinin (10-100 µM; 24 h) activates the MAPK signaling pathway in KBM5, K562, KCL22, and LAMA84 CML cells[2].
Brassinin (200 µM or higher; 24-72 h) inhibits the growth of human colon cancer HT-29 cells in a dose- and time-dependent manner[3].
Brassinin (1-15 µM; 1 h pretreatment; 6 days stimulation) inhibits α-MSH (HY-P0252)-induced melanin accumulation in B16F10 cells[7].
Brassinin (5-15 µM; 1 h pretreatment; 6 days stimulation) decreases cellular tyrosinase activity in α-MSH-stimulated B16F10 cells[7].
Brassinin (5-15 µM; 1 h pretreatment; 6 days stimulation) decreases tyrosinase mRNA levels in α-MSH-stimulated B16F10 cells[7].
Brassinin (5-15 µM; 1 h pretreatment; 6 days stimulation) inhibits the nuclear translocation of MITF in α-MSH-stimulated B16F10 cells[7].
Brassinin (100-400 μM; 48 h) exhibits antiproliferative effects in U373, T98G, LN229, GBM-Y2, and GBM-Y5 glioma cells, with IC50 values ranging from 200.8 to 547.5 μM at 48 h, but shows lower toxicity in normal HA1800 astrocytes[8].
Brassinin (25-200 μM; 48 h) inhibits clonogenic proliferation of U373, LN229, and GBM-Y2 glioma cells[8].
Brassinin (50-200 μM) inhibits the activity of the AMPKα-ULK1-beclin1 signaling pathway in U373 and LN229 glioma cells in a dose-dependent manner[8].
Brassinin (10-50 µM; 24 h) induces apoptosis, autophagy, and paraptosis markers in KBM5, K562, KCL22, and LAMA84 CML cells[2].
Brassinin (50 µM; 24 h) increases the sub G1 phase cell population in CML cells[2].
Brassinin (200-400 µM; 24 h) induces G1 phase arrest in human colon cancer HT-29 cells, with the maximum arrest effect observed at 300 µM[3].
Brassinin (50-400 µM; 6-24 h) upregulates p21 and p27 proteins and inhibits RB protein phosphorylation in human colon cancer HT-29 cells[3].
Brassinin (50-400 µM; 3-24 h) increases the amount of p21 mRNA in human colon cancer HT-29 cells by stabilizing p21 mRNA[3].
Brassinin (300-400 µM; 24 h) at least partially contributes to its induced G1 phase arrest in HT-29 cells through the increase of p27 and/or p21[3].
Brassinin (300-400 µM) induces G1 phase arrest in HT-29 cells, which involves the inhibition of the PI3K-Akt pathway[3].
Brassinin (50-400 µM; 24 h) inhibits the PI3K-Akt signaling pathway in human colon cancer HT-29 cells, as evidenced by decreased phosphorylation levels of Akt, PDK1, and GSK-3β[3].
Brassinin (50-200 μM; 48 h) blocks cell cycle progression by arresting U373 and GBM-Y2 glioma cells in the G1 phase[8].
Brassinin (50 µM; 24 h) promotes early apoptosis in KBM5, K562, KCL22, and LAMA84 CML cells[2].
Brassinin (50 µM; 24 h) induces autophagy in CML cells[2].
Brassinin (50-200 μM) inhibits autophagosome formation in U373 and LN229 glioma cells, manifested as decreased LC3-II levels and increased p62 levels[8].
Brassinin (50 µM; 12 h) induces ROS production in KBM5, K562, KCL22, and LAMA84 CML cells[2].
Brassinin (50 µM; 24 h) causes GSH/GSSG imbalance in KBM5, K562, KCL22, and LAMA84 CML cells[2].
Brassinin (50-200 μM; 48 h) induces excessive ROS production in U373 and LN229 glioma cells in a dose-dependent manner[8].
Brassinin (50 µM; 24 h) causes loss of mitochondrial membrane potential in KBM5, K562, KCL22, and LAMA84 CML cells[2].
Brassinin (50 µM; 24 h) induces ER stress and vacuolization in KBM5, K562, KCL22, and LAMA84 CML cells[2].
Brassinin (200-400 μM; 60 min) is a moderate competitive inhibitor of purified recombinant human IDO at 37 °C, with a Ki of 97.7 μM[5].
Brassinin (5-30 µM; 30 min) inhibits mushroom tyrosinase activity in a cell-free system[7].
Brassinin binds to the active site of tyrosinase with a docking score of -6.7 kcal/mol, acting as a potent tyrosinase inhibitor[7].
Brassinin (100 μM; 24 h) effectively attenuates Ang II-induced oxidative stress in mouse aortic SMCs without affecting basal ROS levels[6].
Brassinin (1-50 µM; 4 min) exhibits antioxidant activity in cell-free FRAP assays[7].
Brassinin (100 μM; 24 h) attenuates Ang II-induced upregulation of TNFα and IL6 and inhibits IL2 mRNA levels in mouse aortic SMCs[6].
Brassinin (5-20 µM; 30 min) inhibits TNF-α-induced IL-8 mRNA expression in HUVECs in a dose-dependent manner[9].
Brassinin (100 μM; 24 h) specifically reverses Ang II-induced AT1R mRNA expression without affecting AT2R, ACE, or ACE2 in mouse aortic SMCs[6].
Brassinin (50-200 μM; 48 h) promotes apoptosis in U373 and LN229 glioma cells in a dose-dependent manner[8].
Brassinin (50-200 μM) induces G1 phase arrest in U373 and LN229 glioma cells by regulating cell cycle regulatory proteins, and alters apoptosis-related protein expression to promote apoptosis[8].
Brassinin (100-200 μM; 48 h) inhibits autophagic flux in U373 and LN229 glioma cells[8].
Brassinin (1-20 µM; 30 min) inhibits TNF-α-induced adhesion of U937 monocytes to HUVECs in a dose-dependent manner[9].
Brassinin (1-20 µM; 30 min) inhibits TNF-α-induced protein expression of VCAM-1, ICAM-1, and E-selectin in HUVECs[9].
Brassinin (5-20 µM; 30 min) inhibits TNF-α-induced nuclear translocation of NF-κB p65 and increases cytoplasmic IκB-α levels in HUVECs[9].
Brassinin (1-20 µM; 30 min) inhibits TNF-α-induced cell surface expression of VCAM-1, ICAM-1, and E-selectin in HUVECs in a dose-dependent manner[9].
Brassinin (30 min) reduces TNF-α-induced intracellular ROS production in HUVECs[9].
MedChemExpress (MCE) has not independently confirmed the accuracy of these methods. They are for reference only.
-
Cell Line:HUVECs, HDMECs, hPC-PLs, NHDFs, MCF-7, MDA-MB-231, 4T1
-
Concentration:2.5-100 µM
-
Incubation Time:48 h
-
Result:Significantly reduced the viability of HUVECs and HDMECs.
Did not affect the viability of pericytes (hPC-PLs), fibroblasts (NHDFs), and breast cancer cells (MCF-7, MDA-MB-231, and 4T1).
-
Cell Line:HUVECs
-
Concentration:25, 50, and 100 µM
-
Incubation Time:6 h, then additional 18 h with BrdU
-
Result:Significantly inhibited EC proliferation in a dose-dependent manner.
-
Cell Line:HUVECs
-
Concentration:25, 50, and 100 µM
-
Incubation Time:24 h
-
Result:Markedly and dose-dependently reduced the number of migrated HUVECs.
-
Cell Line:HUVECs
-
Concentration:25, 50, and 100 µM
-
Incubation Time:2 h
-
Result:Significantly suppressed the phosphorylation of both AKT and ERK.
Selectively reduced the expression of Tie2 and FGFR1, but not VEGFR1 and VEGFR2.
-
Cell Line:KBM5, K562, KCL22, LAMA84, and PBMCs
-
Concentration:10, 15, 30, 50, 100 µM
-
Incubation Time:24 h
-
Result:Suppressed the viability of KBM5, KCL22, and LAMA84 cells.
Slightly affected K562 cells.
Exhibited less than 10% cytotoxicity against PBMCs at a concentration up to 50 µM.
-
Cell Line:KBM5, K562, KCL22, and LAMA84
-
Concentration:10, 30, 50 µM
-
Incubation Time:24 h
-
Result:Stimulated apoptosis and autophagy by promoting PARP cleavage and increasing LC3 expression.
Caused paraptosis by downregulating the expression of Alix.
-
Cell Line:CML cells
-
Concentration:50 µM
-
Incubation Time:24 h
-
Result:Attenuated the viability of the CML cells.
-
Cell Line:CML cells
-
Concentration:50 µM
-
Incubation Time:24 h
-
Result:Enhanced the distribution of the cells in the sub G1 phase.
-
Cell Line:KBM5, K562, KCL22, and LAMA84
-
Concentration:50 µM
-
Incubation Time:24 h
-
Result:Showed an increased concentration in the early apoptosis stage.
-
Cell Line:CML cells
-
Concentration:50 µM
-
Incubation Time:24 h
-
Result:Markedly increased the percentage of the autophagosome-stained cells.
-
Cell Line:KBM5, K562, KCL22, and LAMA84
-
Concentration:50 µM
-
Incubation Time:24 h
-
Result:Indicated that vacuolization was obtained primarily from the ER.
Induced a marked expression of ATF4 and CHOP.
-
Cell Line:KBM5, K562, KCL22, and LAMA84
-
Concentration:50 µM
-
Incubation Time:24 h
-
Result:Observed depletion of GSH.
Increased GSSG and GSSG/GSH ratio, indicating the existence of oxidative stress.
-
Cell Line:KBM5, K562, KCL22, and LAMA84
-
Concentration:10, 15, 30, 50, 100 µM
-
Incubation Time:24 h
-
Result:Significantly increased the phosphorylation of JNK, p38, and ERK.
-
Cell Line:HT-29
-
Concentration:200 µM; 300 µM; 400 µM
-
Incubation Time:24 h
-
Result:Increased cells at G1 phase from 36.2% (DMSO control) to 50.1%, 72.9%, and 55.1% with 200, 300, and 400 µM brassinin, respectively.
-
Cell Line:HT-29
-
Concentration:50-400 µM
-
Incubation Time:24 h
-
Result:Decreased phosphorylated Akt expression remarkably.
Decreased phosphorylation of PDK1 but did not change phosphorylation of PTEN.
Decreased phosphorylation of GSK-3β.
-
Cell Line:Mouse aortic vascular smooth muscle cells (SMCs)
-
Concentration:100 μM (alone); 100 μM (with 30 nM Ang II); 200-400 μM (alone)
-
Incubation Time:24 h
-
Result:Had no significant effect on basal SMC proliferation at 100 μM.
Reduced cell proliferation at 200, 300, and 400 μM.
Reversed the increased SMC proliferation stimulated by 30 nM Ang II at 100 μM.
-
Cell Line:Mouse aortic vascular smooth muscle cells (SMCs)
-
Concentration:100 μM
-
Incubation Time:24 h
-
Result:Reversed Ang II-stimulated migration.
Had no impact on basal cell migration.
Ang II alone increased migration by approximately 2.6-fold.
-
Cell Line:Mouse aortic vascular smooth muscle cells (SMCs)
-
Concentration:100 μM
-
Incubation Time:24 h
-
Result:Restored the expression of SM α-actin and calponin that were downregulated by Ang II.\n
Significantly upregulated CSE protein expression compared to the control group.
Did not alter the protein level of 3-MST.
-
Cell Line:Mouse aortic vascular smooth muscle cells (SMCs)
-
Concentration:100 μM
-
Incubation Time:24 h
-
Result:Markedly reduced the fluorescent intensity brought up by Ang II.
Had no impact on basal oxidative stress levels.
-
Cell Line:Mouse aortic vascular smooth muscle cells (SMCs)
-
Concentration:100 μM
-
Incubation Time:24 h
-
Result:Attenuated Ang II-induced upregulation of TNFα and IL6 mRNA levels.
Suppressed IL2 mRNA levels both in the presence and absence of Ang II.
Had no effect on IL4 mRNA expression.\nReversed Ang II-induced increase in AT1R mRNA levels with no significant effect on AT2R expression.
Did not alter the mRNA expression of ACE or ACE2.\n
Markedly induced CSE mRNA levels compared to control.
Ang II alone did not significantly alter CSE gene expression.
-
Cell Line:B16F10
-
Concentration:5 µM; 15 µM
-
Incubation Time:1 h pretreatment; 6 days stimulation
-
Result:Significantly reduced the mRNA level of tyrosinase among TRP-1, TRP-2, and tyrosinase genes.
-
Cell Line:B16F10
-
Concentration:5 µM; 15 µM
-
Incubation Time:1 h pretreatment; 6 days stimulation
-
Result:Inhibited MITF translocation into the nucleus compared with α-MSH-only treated cells.
-
Cell Line:U373, T98G, LN229, GBM-Y2, GBM-Y5, HA1800
-
Concentration:100-400 μM (48 h); 200 μM (24-96 h)
-
Incubation Time:48 h; 0-96 h
-
Result:Reduced the viability of U373, T98G, LN229, GBM-Y2, and GBM-Y5 cells in a concentration-dependent manner.
Exhibited minimal effect on the viability of HA1800 astrocytes.
Achieved IC50 values at 48 h for LN229: 200.8 μM, U373: 325.6 μM, T98G: 236.7 μM, GBM-Y2: 260.1 μM, and GBM-Y5: 547.5 μM.
Demonstrated a time-dependent inhibitory effect on glioma cell viability.
-
Cell Line:U373, LN229, GBM-Y2
-
Concentration:25 μM; 50 μM; 100 μM; 200 μM
-
Incubation Time:48 h
-
Result:Inhibited the proliferation of U373, LN229, and GBM-Y2 cells.
-
Cell Line:U373, GBM-Y2
-
Concentration:50, 100, 200 μM
-
Incubation Time:48 h
-
Result:Increased the percentage of cells in the G1 phase and decreased the percentage of cells in the S phase for U373 and GBM-Y2 cells.
Induced a marked increase in the percentage of U373 cells in the sub-G1 phase.
-
Cell Line:U373, LN229
-
Concentration:50, 100, 200 μM
-
Incubation Time:48 h
-
Result:Increased the percentage of apoptotic and sub-G1-phase cells in a concentration-dependent manner in U373 and LN229 cells.
-
Cell Line:U373, LN229
-
Concentration:100, 200 μM
-
Incubation Time:48 h
-
Result:Significantly reduced the number of LC3-positive puncta in U373 cells compared to untreated cells.
Decreased the number of LC3-positive puncta in LN229 cells.
-
Cell Line:U373, LN229
-
Concentration:100 μM
-
Incubation Time:48 h
-
Result:Inhibited cell proliferation, which was reversed (at least in part) by NAC in U373 cells and LN229 cells.
-
Cell Line:U373, LN229
-
Concentration:100 μM
-
Incubation Time:48 h
-
Result:Decreased LC3-II levels and increased p62 levels, which were reversed by the addition of NAC.
Reductions in p-AMPKα and beclin1 levels were reversed by NAC, but not p-ULK1 levels.
-
Cell Line:U373
-
Concentration:100 μM
-
Incubation Time:48 h
-
Result:Reduced the levels of CDK4/6 and Bcl-2, and increased the levels of p53, cleaved PARP, and Bax; these changes were rescued by NAC.
-
Cell Line:U373, LN229
-
Concentration:200 μM
-
Incubation Time:48 h
-
Result:Reduced viability, which was significantly rescued in the presence of rapamycin in U373 cells and LN229 cells.
Induced apoptosis that was partially reversed by rapamycin treatment in U373 and LN229 cells.
-
Cell Line:HUVECs
-
Concentration:1, 5, 10, 20 µM (brassinin); 10 ng/mL (TNF-α)
-
Incubation Time:30 min (brassinin pretreatment); 6 h (TNF-α stimulation)
-
Result:Inhibited TNF-α-induced VCAM-1, ICAM-1, and E-selectin protein expression levels.
-
Cell Line:HUVECs
-
Concentration:5, 10, 20 µM (brassinin); 10 ng/mL (TNF-α)
-
Incubation Time:30 min (brassinin pretreatment); 6 h (TNF-α stimulation)
-
Result:Increased cytoplasmic IκB-α levels.
Decreased cytoplasmic NF-κB p65 levels and increased nuclear NF-κB p65 levels.
-
Cell Line:HUVECs
-
Concentration:5, 10, 20 µM (brassinin); 10 ng/mL (TNF-α)
-
Incubation Time:30 min (brassinin pretreatment); 6 h (TNF-α stimulation)
-
Result:Markedly abrogated TNF-α-induced IL-8 mRNA expression in a dose-dependent manner.
In Vivo
Brassinin (180 mg/kg; i.p.; once daily; 14 days) significantly reduces TNBC tumor size and microvessel density while decreasing tumor cell proliferation without affecting apoptosis[1].
Brassinin (75 mg/kg; i.p.; 5 days/week; 2 weeks) suppresses glioma growth in a subcutaneous xenograft model, reducing tumor volume and weight, inhibiting proliferation, and decreasing Bcl-2, p-AMPKα, and beclin1 signaling with good safety[8].
Brassinin (75 mg/kg; i.p.; 5 days/week; 3 weeks) inhibits glioma growth in an intracranial xenograft model and extends the median survival of tumor-bearing mice from 29.5 days to 33.5 days[8].
MedChemExpress (MCE) has not independently confirmed the accuracy of these methods. They are for reference only.
-
Animal Model:Balb/c mice (8-10 weeks old)[1]
-
Dosage:100 µM
-
Administration:s.c.; single administration
-
Result:Reduced microvessel density by 40% compared to vehicle-treated controls.
-
Animal Model:Balb/c mice (female, 12-15 weeks old)[1]
-
Dosage:180 mg/kg
-
Administration:i.p.; once daily; 14 days
-
Result:Significantly reduced tumor size on day 10 and 14 after spheroid transplantation.
Markedly reduced functional microvessel density between day 3 and 14.
Significantly decreased centerline red blood cell velocity and volumetric blood flow of tumor microvessels on day 10 and 14.
Showed significantly smaller tumor size, lower microvessel density, and a decreased number of Ki67-positive proliferating tumor cells, but no change in cleaved caspase-3-positive apoptotic cells.
No difference in tumor microvessel diameter or body weight was observed.
-
Animal Model:BALB/c nude mice (18-22 g)[8]
-
Dosage:75 mg/kg
-
Administration:i.p.; 5 days/week; 2 weeks
-
Result:Reduced tumor volume from day 8 onwards.
Significantly reduced tumor weight on day 14.
Decreased the number of Ki67-positive cells.
Markedly reduced signals of Bcl-2, p-AMPKα, and beclin1.
-
Animal Model:BALB/c nude mice (18-22 g)[8]
-
Dosage:75 mg/kg
-
Administration:i.p.; 5 days/week; 3 weeks
-
Result:Significantly reduced tumor size.
Inhibited tumor proliferation.
Extended median survival from 29.5 days to 33.5 days.
- RNA extraction experimental
- Human pluripotent stem cell endothelial-cell differentiation
- Cell migration
- Somatic Cell Culture
- Breast Cancer Modeling
- Cytoplasmic-Nuclear Fractionated Protein Extraction
- Detection of Apoptosis
- TUNEL staining for apoptotic DNA fragmentation
- Flow cytometric DNA-content cell-cycle staining
- Endothelial Tube Formation Assay
- Autophagy
- Apoptosis Solutions
- Lysosome and acidic-vesicle live-cell staining
- MTT Cell Proliferation Assay
- Macroautophagy Solutions
- Endothelial Cell Migration/Angiogenic Sprouting Assay
- Western Blot
- Vascular/Branching Fractal Analysis
- Annexin V plus membrane-impermeant dye apoptosis staining
- ROS/oxidative-stress fluorescent staining
- BrdU Incorporation Assay
- CFSE Dye Dilution Proliferation Assay
- Dye-dilution cell tracking and proliferation staining
- CCK-8/WST-8 Cell Proliferation Assay
- Protocol for Cell Cycle
- Research Protocol for Cardiovascular Diseases
- Cell Counting-Based Growth Curve Assay
- Colony Formation (Clonogenic) Assay
- Cell Viability Determination by MTT Colorimetric Assay
- Kinase activity and phosphorylation assays
- EdU Incorporation Assay (Click Chemistry-Based DNA Synthesis Measurement)
- Ki-67 Immunostaining Proliferation Assay
- PCNA Immunodetection Proliferation Assay
- Protocol for Cell Counting and Cell Density Analysis
- Protocol for Kinase activity and phosphorylation assays


Chemical Information
-
CAS. Nr. 105748-59-2
-
Appearance Powder
-
Molecular Weight 236.37
-
Formel C11H12N2S2
-
Color Off-white to light yellow
-
SMILES
S=C(NCC1=CNC2=CC=CC=C21)SC
-
Synonyms
Brassinine
-
Structure Classification
-
Initial Source
-
Versand
Room temperature in continental US; may vary elsewhere.
-
Speicherung
-20°C, protect from light
* In solvent : -80°C, 6 months; -20°C, 1 month (protect from light)


Publications (2)
-
Journal Impact Factor
-
Most Recent
-
ACS Environ Au
Machine Learning-Assisted Recognition of Environmental Sulfur-Containing Chemicals in Nontargeted Mass Spectrometry Analysis of Inadequate Mass Resolution. [Abstract]2025 Aug 5;5(6):573-582. PMID: 41277996 -
Anal Chem
Exposome-Scale Investigation of Cl-/Br-Containing Chemicals Using High-Resolution Mass Spectrometry, Multistage Machine Learning, and Cloud Computing. [Abstract]2025 Jun 3;97(21):11099-11109. PMID: 40401576


Lösungsmittel & Löslichkeit
In Vitro:
DMSO : 50 mg/mL (211.53 mM; ultrasonic and warming and heat to 60°C; Hygroscopic DMSO has a significant impact on the solubility of product, please use newly opened DMSO)
Please refer to the solubility information to select the appropriate solvent. Once prepared, please aliquot and store the solution to prevent product inactivation from repeated freeze-thaw cycles.
Storage method and period of stock solution: -80°C, 6 months; -20°C, 1 month (protect from light). When stored at -80°C, please use it within 6 months. When stored at -20°C, please use it within 1 month.
Please refer to the solubility information to select the appropriate solvent. Once prepared, please aliquot and store the solution to prevent product inactivation from repeated freeze-thaw cycles.
Storage method and period of stock solution: -80°C, 6 months; -20°C, 1 month (protect from light). When stored at -80°C, please use it within 6 months. When stored at -20°C, please use it within 1 month.
Konzentration (Stammlösung) × Volumen (Stammlösung) = Konzentration (Ziellösung) × Volumen (Ziellösung)
In Vivo:
Select the appropriate dissolution method based on your experimental animal and administration route.
- For the following dissolution methods, please ensure to first prepare a clear stock solution using an In Vitro approach and then sequentially add co-solvents:
- To ensure reliable experimental results, the clarified stock solution can be appropriately stored based on storage conditions. As for the working solution for In Vivo experiments, it is recommended to prepare freshly and use it on the same day.
- The percentages shown for the solvents indicate their volumetric ratio in the final prepared solution. If precipitation or phase separation occurs during preparation, heat and/or sonication can be used to aid dissolution.
Add each solvent one by one: 10% DMSO 40% PEG300 5% Tween-80 45% Saline
Solubility: 1.25 mg/mL (5.29 mM); Suspended solution; Need ultrasonic
This protocol yields a suspended solution of 1.25 mg/mL. Suspended solution can be used for oral and intraperitoneal injection.
Taking 1 mL working solution as an example, add 100 μL DMSO stock solution (12.5 mg/mL) to 400 μL PEG300, and mix evenly; then add 50 μL Tween-80 and mix evenly; then add 450 μL Saline to adjust the volume to 1 mL.
Preparation of Saline: Dissolve 0.9 g sodium chloride in ddH₂O and dilute to 100 mL to obtain a clear Saline solution.
Add each solvent one by one: 10% DMSO 90% (20% SBE-β-CD in Saline)
Solubility: 1.25 mg/mL (5.29 mM); Suspended solution; Need ultrasonic
This protocol yields a suspended solution of 1.25 mg/mL. Suspended solution can be used for oral and intraperitoneal injection.
Taking 1 mL working solution as an example, add 100 μL DMSO stock solution (12.5 mg/mL) to 900 μL 20% SBE-β-CD in Saline, and mix evenly.
Preparation of 20% SBE-β-CD in Saline (4°C, storage for one week): 2 g SBE-β-CD powder is dissolved in 10 mL Saline, completely dissolve until clear.
In Vivo Dissolution Calculator
Please enter the basic information of animal experiments:
-
-
-
-
Recommended: Prepare an additional quantity of animals to account for potential losses during experiments.
Please enter your animal formula composition:
-
%DMSO +
Recommended: Keep the proportion of DMSO in working solution below 2% if your animal is weak.
-
%+
-
+%Tween-80 + +
-
%Saline +
The co-solvents required include: DMSO, . All of co-solvents are available by MedChemExpress (MCE). , Tween 80. All of co-solvents are available by MedChemExpress (MCE).
Working solution concentration: 0.22 mg/mL
Method for preparing stock solution: mg drug dissolved in μL DMSO. Stock solution concentration: mg/mL. * In solvent : -80°C, 6 months; -20°C, 1 month (protect from light)
1. Take μL DMSO stock solution;
2. Add μL .
μL , mix evenly;
3. Then add μL Tween 80, mix evenly;
4. Then add μL
Please ensure that the stock solution in the first step is dissolved to a clear state, and add co-solvents in sequence. You can use ultrasonic heating (ultrasonic cleaner, recommended frequency 20-40 kHz), vortexing, etc. to assist dissolution.


Reinheit & Dokumentation
-
Data Sheet (338 KB)
-
SDS (394 KB)
- English - EN (394 KB)
- Français - FR (394 KB)
- Deutsch - DE (394 KB)
- Norwegian - NO (394 KB)
- Español - ES (394 KB)
- Swedish - SV (394 KB)
- Italian - IT (394 KB)
- Korean - KR (394 KB)
- Portuguese - PT (394 KB)
-
Handling Instructions (2659 KB)
Verweise


Complete Stock Solution Preparation Table
Please refer to the solubility information to select the appropriate solvent. Once prepared, please aliquot and store the solution to prevent product inactivation from repeated freeze-thaw cycles.
Storage method and period of stock solution: -80°C, 6 months; -20°C, 1 month (protect from light). When stored at -80°C, please use it within 6 months. When stored at -20°C, please use it within 1 month.
| Optional Solvent | Concentration Solvent Mass | 1 mg | 5 mg | 10 mg | 25 mg |
|---|---|---|---|---|---|
| DMSO | 1 mM | 4.2307 mL | 21.1533 mL | 42.3066 mL | 105.7664 mL |
| 5 mM | 0.8461 mL | 4.2307 mL | 8.4613 mL | 21.1533 mL | |
| 10 mM | 0.4231 mL | 2.1153 mL | 4.2307 mL | 10.5766 mL | |
| 15 mM | 0.2820 mL | 1.4102 mL | 2.8204 mL | 7.0511 mL | |
| 20 mM | 0.2115 mL | 1.0577 mL | 2.1153 mL | 5.2883 mL | |
| 25 mM | 0.1692 mL | 0.8461 mL | 1.6923 mL | 4.2307 mL | |
| 30 mM | 0.1410 mL | 0.7051 mL | 1.4102 mL | 3.5255 mL | |
| 40 mM | 0.1058 mL | 0.5288 mL | 1.0577 mL | 2.6442 mL | |
| 50 mM | 0.0846 mL | 0.4231 mL | 0.8461 mL | 2.1153 mL | |
| 60 mM | 0.0705 mL | 0.3526 mL | 0.7051 mL | 1.7628 mL | |
| 80 mM | 0.0529 mL | 0.2644 mL | 0.5288 mL | 1.3221 mL | |
| 100 mM | 0.0423 mL | 0.2115 mL | 0.4231 mL | 1.0577 mL |


Brassinin Related Classifications
HY-111334 Related Classifications
 Powered by Bioz
Keywords
- Brassinin
- 105748-59-2
- Brassinine
- Endogenous Metabolite
- Indoleamine 2,3-Dioxygenase (IDO)
- Apoptosis
- Autophagy
- Paraptosis
- Reactive Oxygen Species (ROS)
- Tie
- Akt
- PERK
- PI3K
- mTOR
- Ribosomal S6 Kinase (RSK)
- autophagy
- apoptosis
- glioma
- angiogenesis inhibitor
- endothelial cells
- colon cancer
- paraptosis
- HUVECs
- IDO inhibitor
- chronic myelogenous leukemia
- Inhibitor
- inhibitor
- inhibit