



Isopimaric acid

Based on 1 Customer Validation
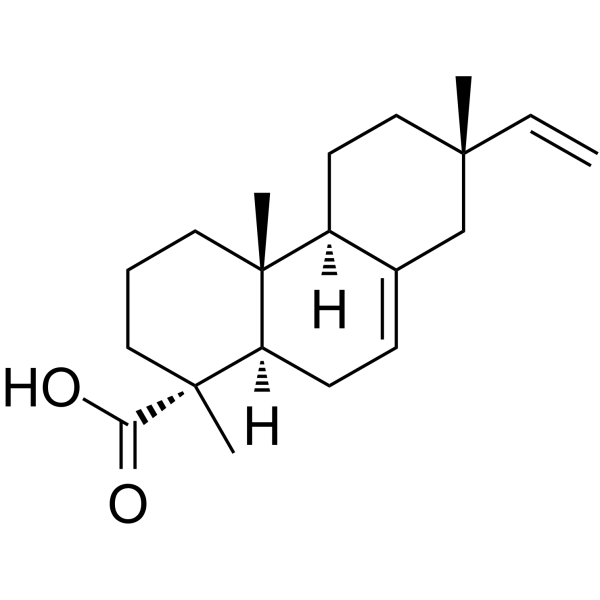
Isopimaric acid is a coniferous tree defense compound. Isopimaric acid binds to AKT and inhibits mTOR phosphorylation, thereby regulating the AKT/mTOR pathway. Isopimaric acid inhibits oxidative stress, inflammation, microglial migration, apoptosis, autophagic flux, ornithine decarboxylase activity, breast cancer proliferation and metastasis, and fungal spore germination. Isopimaric acid also induces M2 microglial polarization, mitochondrial damage, ROS accumulation, starvation-induced colon cancer cell apoptosis, and breast cancer cell cycle arrest. Isopimaric acid activates potassium channels, regulates sodium channels and calcium channels, reduces myocardial excitability, and improves arrhythmia. Isopimaric acid acts as an oxidative substrate for CYP6BW1/3, down-regulates PINK1/Parkin, and regulates calcium homeostasis, oxidative phosphorylation, EMT, and the Wnt pathway. Isopimaric acid exhibits activity against drug-resistant Staphylococcus aureus, repels feeding, and promotes the growth of rice seedlings. Isopimaric acid is suitable for research related to epilepsy, tumors, drug-resistant bacterial infections, atrial fibrillation, hypertension, hyperlipidemia, pulmonary tuberculosis, etc.
For research use only. We do not sell to patients.
- Purity : 99.88%
- CAS No.: 5835-26-7
- Formula: C20H30O2
- Molecular Weight:302.45
-
Storage:Powder -20°C, 3 years ; In solvent -80°C, 6 months , -20°C, 1 month

To place orders, for customer services and technical support, please contact: MedChemExpress USA
Tel: 609-228-6898 E-mail: [email protected] [email protected]


-
 Biological Activity
-
Chemical Information
-
Solvent & Solubility
- Protocols
- Purity & Documentation
- References
-
 Help & FAQs




All Calcium Channel Isoforms
More

Biological Activity
Description
|
Akt |
mTOR |
Calcium Channel |
PINK1 |
potassium channel |
Sodium Channel |
Wnt |
Parkin |
Cellular Effect
|
Cell Line

|
Type | Value | Description | References |
|---|---|---|---|---|
| KB | IC50 |
>60 μM
Compound: 3
|
Cytotoxicity against human KB cells
Cytotoxicity against human KB cells
|
[PMID: 11000026] |
| Oocyte | EC50 |
141.6 μM
Compound: 4
|
Allosteric modulation of gamma-aminobutyric acid receptor A alpha1beta2gamma2S expressed in Xenopus oocytes assessed as potentiation of GABA-mediated chloride current by voltage clamp analysis
Allosteric modulation of gamma-aminobutyric acid receptor A alpha1beta2gamma2S expressed in Xenopus oocytes assessed as potentiation of GABA-mediated chloride current by voltage clamp analysis
|
[PMID: 21793559] |
| Oocyte | EC50 |
257 μM
Compound: 4
|
Allosteric modulation of gamma-aminobutyric acid receptor A alpha1beta3gamma2S expressed in Xenopus oocytes assessed as potentiation of GABA-mediated chloride current by voltage clamp analysis
Allosteric modulation of gamma-aminobutyric acid receptor A alpha1beta3gamma2S expressed in Xenopus oocytes assessed as potentiation of GABA-mediated chloride current by voltage clamp analysis
|
[PMID: 21793559] |
| Oocyte | EC50 |
289.5 μM
Compound: 4
|
Allosteric modulation of gamma-aminobutyric acid receptor A alpha1beta1gamma2S expressed in Xenopus oocytes assessed as potentiation of GABA-mediated chloride current by voltage clamp analysis
Allosteric modulation of gamma-aminobutyric acid receptor A alpha1beta1gamma2S expressed in Xenopus oocytes assessed as potentiation of GABA-mediated chloride current by voltage clamp analysis
|
[PMID: 21793559] |
| Oocyte | EC50 |
317 μM
Compound: 4
|
Allosteric modulation of gamma-aminobutyric acid receptor A alpha5beta2gamma2S expressed in Xenopus oocytes assessed as potentiation of GABA-mediated chloride current by voltage clamp analysis relative to control
Allosteric modulation of gamma-aminobutyric acid receptor A alpha5beta2gamma2S expressed in Xenopus oocytes assessed as potentiation of GABA-mediated chloride current by voltage clamp analysis relative to control
|
[PMID: 21793559] |
| Oocyte | EC50 |
364.8 μM
Compound: 4
|
Allosteric modulation of gamma-aminobutyric acid receptor A alpha2beta2gamma2S expressed in Xenopus oocytes assessed as potentiation of GABA-mediated chloride current by voltage clamp analysis
Allosteric modulation of gamma-aminobutyric acid receptor A alpha2beta2gamma2S expressed in Xenopus oocytes assessed as potentiation of GABA-mediated chloride current by voltage clamp analysis
|
[PMID: 21793559] |
| Oocyte | EC50 |
724.1 μM
Compound: 4
|
Allosteric modulation of gamma-aminobutyric acid receptor A alpha3beta2gamma2S expressed in Xenopus oocytes assessed as potentiation of GABA-mediated chloride current by voltage clamp analysis
Allosteric modulation of gamma-aminobutyric acid receptor A alpha3beta2gamma2S expressed in Xenopus oocytes assessed as potentiation of GABA-mediated chloride current by voltage clamp analysis
|
[PMID: 21793559] |
In Vitro
Isopimaric acid (0.1-1000.0 µM; 24 h) at 0.1-100.0 µM is non-toxic to murine microglial BV2 cells after 24 h incubation, while 1000.0 µM increases cell survival[1].
Isopimaric acid (0.1-100.0 µM; 24 h) significantly inhibits lipopolysaccharide-induced migration of murine microglial BV2 cells after 24 h co-incubation, with 100.0 µM showing the strongest effect[1].
Isopimaric acid (0.1-100.0 µM; 24 h) significantly reduces lipopolysaccharide-induced lactate dehydrogenase release in murine microglial BV2 cells after 24 h co-incubation, with 100.0 µM showing the strongest effect[1].
Isopimaric acid binds to the active pocket of AKT via interactions with residues Phe161 and Gly162, potentially inhibiting AKT phosphorylation[1].
Isopimaric acid (1 mM; 1 h) is oxidized by heterologously expressed mountain pine beetle CYP6BW1 in vitro to form epoxidized and hydrolyzed epoxide (vicinal diol) products[2].
Isopimaric acid (1 mM; 1 h) is oxidized by heterologously expressed mountain pine beetle CYP6BW3 in vitro to form a minor epoxidized product and a major hydrolyzed epoxide (vicinal diol) product[2].
Isopimaric acid (25 µg/mL; 3 d) promotes shoot growth in multiple Oryza sativa L. rice seedling lines, with the WRs260 line showing the greatest increases of 36.48% in shoot length and 49.00% in shoot weight[7].
Isopimaric acid (25 µg/mL) alters growth-related phytohormone concentrations in Oryza sativa L. rice seedling shoots and roots, including significant reductions in IAA in CJCx59 shoots and significant increases in IBA in JRC053 shoots[7].
Isopimaric acid (25 µg/mL) reduces cytokinin-related phytohormone concentrations in Oryza sativa L. rice seedling shoots and roots, with the greatest reduction of 31.00% seen in tZ concentrations in CJCHC4 shoots[7].
Isopimaric acid (25 µg/mL) reduces gibberellin-related phytohormone concentrations in Oryza sativa L. rice seedling shoots and roots, with a significant reduction of 32.53% seen in GA7 concentrations in NG28 shoots[7].
Isopimaric acid (25 µg/mL) reduces defense-related phytohormone concentrations in Oryza sativa L. rice seedling shoots and roots, with a significant reduction of 45.14% seen in ABA concentrations in NG28 shoots[7].
Isopimaric acid (25 µg/mL) modulates the correlations between phytohormone concentrations and growth characteristics in Oryza sativa L. rice seedlings, including a significant negative correlation between shoot length and IBA concentrations, and a significant negative correlation between root weight and ABA concentrations[7].
Isopimaric acid (0.1-100.0 µM; 12 h) significantly inhibits glutamate-induced reactive oxygen species production in murine microglial BV2 cells after 12 h co-incubation[1].
Isopimaric acid (0.1-100.0 µM; 24 h) significantly inhibits lipopolysaccharide-induced reactive oxygen species production in murine microglial BV2 cells after 24 h co-incubation[1].
Isopimaric acid (0.1-100.0 µM; 24 h) significantly suppresses lipopolysaccharide-induced late-phase apoptosis in murine microglial BV2 cells after 24 h co-incubation[1].
Isopimaric acid (0.1-100.0 µM; 24 h) preserves mitochondrial membrane potential in lipopolysaccharide-stimulated murine microglial BV2 cells after 24 h co-incubation[1].
Isopimaric acid (1.0-100.0 µM; 24 h) upregulates antioxidant (SOD-1, SOD-2) and M2 polarization (Arg-1) gene expression, and at 100.0 µM downregulates inflammatory (IL-1β, TNF-α) gene expression in lipopolysaccharide-stimulated murine microglial BV2 cells after 24 h co-incubation[1].
Isopimaric acid (0.1-100.0 µM; 24 h) suppresses inflammatory protein (IL-1β, TNF-α) expression and inhibits phosphorylation of AKT and mTOR, without affecting PI3Kα or PI3Kβ protein levels, in lipopolysaccharide-stimulated murine microglial BV2 cells after 24 h co-incubation[1].
Isopimaric acid (512 µg/mL starting; 18 h) inhibits growth of XU212, SA-1199B, RN4220, EMRSA-15, EMRSA-16, and ATCC 25923 Staphylococcus aureus strains with MIC values ranging from 32 to 64 µg/mL[3].
Isopimaric acid (10 µg/mL; 18 h) does not potentiate the activity of Tetracycline (HY-A0107), Norfloxacin (HY-B0132), Erythromycin (HY-B0220), or Oxacillin (HY-B0925A) against XU212, SA-1199B, RN4220, EMRSA-15, or EMRSA-16 Staphylococcus aureus strains[3].
Isopimaric acid (512 µg/mL starting, combined with 20 µg/mL Reserpine (HY-N0480); 18 h) exhibits reduced antibacterial activity against XU212 and SA-1199B Staphylococcus aureus strains, with MIC values increasing to 128 µg/mL and 64 µg/mL, respectively[3].
Isopimaric acid (combined with 10 µg/mL Epicatechin gallate ((-)-Epicatechin gallate) (HY-N0002) for EMRSA-15, 4 µg/mL Epicatechin gallate for EMRSA-16; 18 h) antibacterial activity against EMRSA-15 and EMRSA-16 Staphylococcus aureus strains is unaffected by combination with Epicatechin gallate, with MIC values remaining at 32 µg/mL and 64 µg/mL, respectively[3].
Isopimaric acid (1-50 μM) reduces spontaneous action potential frequency in mouse atrial HL-1 cells by up to 50% at 1, 10, and 25 μM, with minimal effects on other action potential parameters except at 50 μM, where it prolongs action potential duration at 90% repolarization[5].
Isopimaric acid (1-50 μM) promotes inactivation of sodium currents in mouse atrial HL-1 cells by shifting activation and steady-state inactivation curves to more negative voltages, dose-dependently slowing recovery from inactivation, and reducing late steady-state current, with peak current only reduced at 50 μM[5].
Isopimaric acid (1-50 μM) increases peak transient outward potassium currents by 30% at 1 and 10 μM and shifts steady-state inactivation to more negative voltages in mouse atrial HL-1 cells, with no effect on activation gating[5].
Isopimaric acid (1-50 μM) promotes opening of rapidly activating delayed-rectifier potassium currents in mouse atrial HL-1 cells by shifting activation to more negative voltages and speeding activation kinetics at 1, 10, and 50 μM, with no effect on steady-state inactivation[5].
Isopimaric acid (1-50 μM) reduces L-type calcium currents in mouse atrial HL-1 cells by 53% at 1 μM, shifting activation and steady-state inactivation curves to more negative voltages, with greater effects on inactivation, and effects saturated at the lowest concentration tested[5].
Isopimaric acid (1-50 μM) dose-dependently reduces T-type calcium currents in mouse atrial HL-1 cells, with a 40% reduction at 10 μM, and shifts activation and steady-state inactivation curves to more negative voltages, with greater effects on inactivation[5].
Isopimaric acid (1-50 μM) has no significant effect on pace-maker hyperpolarization-activated non-selective cation currents in mouse atrial HL-1 cells at concentrations up to 50 μM[5].
Isopimaric acid (1-10 μM) restores regular spontaneous action potential firing in isoproterenol-induced arrhythmic mouse atrial HL-1 cells, with near-complete restoration at 1 μM and full restoration at 10 μM[5].
Isopimaric acid (24-72 h) potently inhibits the proliferation of 4T1, MDA-MB-231, and MCF-7 breast cancer cells in a time- and concentration-dependent manner, with the strongest activity in 4T1 cells (IC50 = 22.46 μg/mL at 72 h)[8].
Isopimaric acid (5-30 μg/mL; 10 days) inhibits colony formation of 4T1, MDA-MB-231, and MCF-7 breast cancer cells in a concentration-dependent manner[8].
Isopimaric acid (5-30 μg/mL; 24 h) reduces the rate of new cell proliferation in 4T1, MDA-MB-231, and MCF-7 breast cancer cells in a concentration-dependent manner[8].
Isopimaric acid (10 μg/mL; 24 h) downregulates the calcium signaling and oxidative phosphorylation pathways in 4T1 breast cancer cells, as revealed by transcriptomic and GSEA analysis[8].
Isopimaric acid (10-40 μg/mL; 48 h) induces apoptosis of 4T1, MDA-MB-231, and MCF-7 breast cancer cells in a concentration-dependent manner, with near-maximal apoptotic rates at 30-40 μg/mL in 4T1 cells[8].
Isopimaric acid (10-40 μg/mL; 48 h) induces G1-phase cell cycle arrest in 4T1 breast cancer cells in vitro in a concentration-dependent manner[8].
Isopimaric acid (5-20 μg/mL; 24 h) downregulates cell cycle-related proteins (CDK2, CDK4, CyclinD1) and anti-apoptotic proteins Bcl-XL and Bcl-2, while upregulating pro-apoptotic proteins BAD and BAX in 4T1 breast cancer cells in vitro in a concentration-dependent manner[8].
Isopimaric acid (10-20 μg/mL; 24 h) inhibits the migration of 4T1, MDA-MB-231, and MCF-7 breast cancer cells in a concentration-dependent manner, with the strongest activity in 4T1 cells[8].
Isopimaric acid (2.5-20 μg/mL; 24 h) inhibits the migration and invasion of 4T1, MDA-MB-231, and MCF-7 breast cancer cells in a concentration-dependent manner, with the strongest activity in 4T1 cells[8].
Isopimaric acid (5-20 μg/mL; 24 h) upregulates E-cadherin and downregulates Vimentin, β-catenin, and ZEB1 in 4T1, MDA-MB-231, and MCF-7 breast cancer cells in a concentration-dependent manner, indicating inhibition of the EMT pathway[8].
Isopimaric acid (20 μg/mL; 48 h) reduces the expression of Vimentin and β-catenin in 4T1 and MDA-MB-231 breast cancer cells, consistent with inhibition of the EMT pathway[8].
MedChemExpress (MCE) has not independently confirmed the accuracy of these methods. They are for reference only. Further protocols information, click here.
-
Cell Line:Murine microglial BV2 cells
-
Concentration:0.1 µM, 1.0 µM, 10.0 µM, 100.0 µM, 1000.0 µM
-
Incubation Time:24 h
-
Result:Did not affect the survival rate of BV2 cells at concentrations of 0.1 to 100.0 µM.
Significantly increased cell survival rate compared to controls at 1000.0 µM.
-
Cell Line:LPS-stimulated murine microglial BV2 cells
-
Concentration:0.1 µM, 1.0 µM, 10.0 µM, 100.0 µM
-
Incubation Time:24 h
-
Result:Significantly inhibited LPS-induced BV2 cell migration.
Reduced migratory area to 88.10% at 0.1 µM, 91.55% at 1.0 µM, 83.03% at 10.0 µM, and 70.55% at 100.0 µM, compared to 146.60% in the LPS-only group.
Showed the strongest effect at 100.0 µM.
-
Cell Line:LPS-stimulated murine microglial BV2 cells
-
Concentration:0.1 µM, 1.0 µM, 10.0 µM, 100.0 µM
-
Incubation Time:24 h
-
Result:Prevented LPS-induced late-phase apoptosis in BV2 cells.
Reduced late apoptotic rates to 3.47% at 0.1 µM, 4.19% at 1.0 µM, 4.40% at 10.0 µM, and 4.33% at 100.0 µM, compared to 9.94% in the LPS-only group.
-
Cell Line:LPS-stimulated murine microglial BV2 cells
-
Concentration:0.1 µM, 1.0 µM, 10.0 µM, 100.0 µM
-
Incubation Time:24 h
-
Result:Significantly increased mRNA expression of anti-oxidative enzymes SOD-1 and SOD-2.
Significantly decreased mRNA expression of inflammatory cytokines IL-1β and TNF-α at 100.0 µM.
Significantly increased mRNA expression of M2 polarization marker Arg-1 at 1.0, 10.0, and 100.0 µM.
-
Cell Line:LPS-stimulated murine microglial BV2 cells
-
Concentration:0.1 µM, 1.0 µM, 10.0 µM, 100.0 µM
-
Incubation Time:24 h
-
Result:Inhibited protein expression of IL-1β and TNF-α.
Suppressed phosphorylation of mTOR and AKT.
Did not alter protein expression of PI3Kα or PI3Kβ compared to the LPS-only group.
-
Cell Line:4T1, MDA-MB-231, MCF-7 breast cancer cells
-
Concentration:5 μg/mL; 10 μg/mL; 20 μg/mL; 30 μg/mL
-
Incubation Time:10 days
-
Result:Significantly reduced colony formation in all three breast cancer cell lines in a concentration-dependent manner.
Reduced colony formation in 4T1 cells to ~90% at 5 μg/mL, ~85% at 10 μg/mL, ~60% at 20 μg/mL, and nearly eliminated at 30 μg/mL.
Induced similar concentration-dependent reductions in MDA-MB-231 and MCF-7 cells, with statistical significance compared to controls.
-
Cell Line:4T1, MDA-MB-231, MCF-7 breast cancer cells
-
Concentration:5 μg/mL; 10 μg/mL; 20 μg/mL; 30 μg/mL
-
Incubation Time:24 h
-
Result:Significantly reduced the EdU-positive cell rate in all three breast cancer cell lines in a concentration-dependent manner.
Decreased the positive rate in 4T1 cells from ~70% in controls to ~55% at 5 μg/mL, ~45% at 10 μg/mL, ~30% at 20 μg/mL, and further reduced at 30 μg/mL.
Induced similar concentration-dependent decreases in MDA-MB-231 and MCF-7 cells, with statistical significance compared to controls.
-
Cell Line:4T1, MDA-MB-231, MCF-7 breast cancer cells
-
Concentration:10 μg/mL; 20 μg/mL; 30 μg/mL; 40 μg/mL
-
Incubation Time:48 h
-
Result:Induced apoptosis in breast cancer cells in a concentration-dependent manner.
Increased the apoptotic rate in 4T1 cells from near 0% in controls to ~15% at 10 μg/mL, ~20% at 20 μg/mL, ~80% at 30 μg/mL, and ~90% at 40 μg/mL, with statistical significance compared to controls.
Induced similar concentration-dependent increases in apoptosis in MDA-MB-231 and MCF-7 cells.
-
Cell Line:4T1 breast cancer cells
-
Concentration:10 μg/mL; 20 μg/mL; 30 μg/mL; 40 μg/mL
-
Incubation Time:48 h
-
Result:Induced G1-phase cell cycle arrest in 4T1 cells in a concentration-dependent manner.
Increased the proportion of cells in G1 phase from ~40% in controls to ~45% at 10 μg/mL, ~50% at 20 μg/mL, ~60% at 30 μg/mL, and ~60% at 40 μg/mL.
Decreased the proportion of cells in G2/M and S phases correspondingly, with statistical significance compared to controls.
-
Cell Line:4T1 breast cancer cells
-
Concentration:5 μg/mL; 10 μg/mL; 15 μg/mL; 20 μg/mL
-
Incubation Time:24 h
-
Result:Altered the expression of cell cycle and apoptosis-related proteins in a concentration-dependent manner.
Decreased expression of cell cycle-related proteins CDK2, CDK4, and CyclinD1 with increasing concentration (relative expression levels: CDK2 = 0.68, 0.60, 0.60, 0.31; CDK4 = 0.41, 0.33, 0.25, 0.03, 0.01; CyclinD1 = 0.59, 0.66, 0.86, 0.45, 0.25 for 0, 5, 10, 15, 20 μg/mL respectively).
Decreased expression of anti-apoptotic proteins Bcl-XL and Bcl-2 (relative expression Bcl-XL = 0.47, 0.51, 0.55, 0.23, 0.18; Bcl-2 = 1.00, 0.88, 0.73, 0.61, 0.45 for 0, 5, 10, 15, 20 μg/mL respectively).
Increased expression of pro-apoptotic proteins BAD and BAX (relative expression: BAD = 0.03, 0.21, 0.57, 0.55, 0.61; BAX = 0.22, 1.02, 1.11, 1.09, 1.18 for 0, 5, 10, 15, 20 μg/mL respectively).
-
Cell Line:4T1, MDA-MB-231, MCF-7 breast cancer cells
-
Concentration:10 μg/mL; 15 μg/mL; 20 μg/mL
-
Incubation Time:24 h
-
Result:Significantly reduced the wound healing capacity (migration) of all three breast cancer cell lines in a concentration-dependent manner.
Strongly inhibited scratch closure in 4T1 cells at 20 μg/mL, with statistical significance compared to controls.
Induced similar concentration-dependent migration inhibition in MDA-MB-231 and MCF-7 cells, with the most potent effect in 4T1 cells.
-
Cell Line:4T1, MDA-MB-231, MCF-7 breast cancer cells
-
Concentration:2.5 μg/mL; 5 μg/mL; 10 μg/mL; 15 μg/mL; 20 μg/mL
-
Incubation Time:24 h
-
Result:Significantly reduced migration and invasion of all three breast cancer cell lines in a concentration-dependent manner.
Reduced migration in 4T1 cells to ~60% at 2.5 μg/mL, ~40% at 5 μg/mL, ~20% at 10 μg/mL, ~10% at 15 μg/mL, and ~5% at 20 μg/mL compared to controls.
Induced similar concentration-dependent reduction in invasion of 4T1 cells.
Caused statistically significant decreases across all concentrations in all cell lines, with the most potent effect in 4T1 cells.
-
Cell Line:4T1, MDA-MB-231, MCF-7 breast cancer cells
-
Concentration:5 μg/mL; 10 μg/mL; 15 μg/mL; 20 μg/mL
-
Incubation Time:24 h
-
Result:Altered the expression of EMT-related proteins in a concentration-dependent manner.
Increased E-cadherin expression with increasing concentration (relative expression: 4T1 = 0.04, 0.16, 0.25, 0.25, 0.37; MDA-MB-231 = 0.60, 0.47, 0.53, 0.73, 0.97; MCF-7 = 0.70, 0.80, 0.72, 1.07, 1.02 for 0, 5, 10, 15, 20 μg/mL respectively).
Decreased Vimentin and β-catenin expression with increasing concentration (relative expression Vimentin: 4T1 = 1.13, 0.88, 0.52, 0.41, 0.66; MDA-MB-231 = 2.35, 2.08, 1.89, 1.59, 1.50; MCF-7 = 0.62, 0.51, 0.39, 0.42, 0.37; relative expression β-catenin: 4T1 = 1.45, 1.17, 0.84, 0.75, 0.92; MDA-MB-231 = 1.33, 1.27, 1.21, 1.24, 1.03; MCF-7 = 0.72, 0.43, 0.34, 0.39, 0.31 for 0, 5, 10, 15, 20 μg/mL respectively).
Decreased ZEB1 expression with increasing concentration.
-
Cell Line:4T1, MDA-MB-231 breast cancer cells
-
Concentration:20 μg/mL
-
Incubation Time:48 h
-
Result:Reduced the fluorescence intensity of EMT-related proteins Vimentin and β-catenin in both 4T1 and MDA-MB-231 cells compared to untreated controls, indicating decreased expression of these mesenchymal markers.
Parmacokinetics
| Species | Dose | Route | Cmax | Tmax | AUC0-24 | AUC0-∞ | CL/F | T1/2 | MRT |
|---|---|---|---|---|---|---|---|---|---|
| Rat[9] | 5 mg/kg | i.v. | 1740.1 ng/mL | 0 h | 744.7 ng·h/mL | 818.4 ng·h/mL | 6.1 L/h | 6.6 h | 1.4 h |
| Rat[9] | 50 mg/kg | p.o. | 83.7 ng/mL | 0.9 h | 886.6 ng·h/mL | 923.3 ng·h/mL | 70.3 L/h | 10.4 h | 9.3 h |
| Rat[9] | 100 mg/kg | p.o. | 296.4 ng/mL | 0.6 h | 2604.5 ng·h/mL | 2643.9 ng·h/mL | 59.0 L/h | 5.5 h | 7.6 h |
| Rat[9] | 200 mg/kg | p.o. | 246.23 ng/mL | 0.65 h | 3184.7 ng·h/mL | 3193.4 ng·h/mL | 79.8 L/h | 3.6 h | 7.9 h |
In Vivo
MedChemExpress (MCE) has not independently confirmed the accuracy of these methods. They are for reference only.
-
Animal Model:BALB/c (female, ~20 g, subcutaneous xenograft model via 4T1 murine mammary carcinoma cell injection)[8]
-
Dosage:15 mg/kg; 30 mg/kg; 60 mg/kg
-
Administration:i.p.; once every other day; 15 days
-
Result:Significantly inhibited 4T1 tumor growth at 60 mg/kg compared to control (p < 0.05).
Reduced tumor volume and tumor weight in a dose-dependent manner across all treatment groups.
Significantly reduced expression of proliferation marker Ki67 and metastasis marker Vimentin in tumor tissue at 60 mg/kg compared to control.


Chemical Information
-
CAS No. 5835-26-7
-
Appearance Solid
-
Molecular Weight 302.45
-
Formula C20H30O2
-
Color White to off-white
-
SMILES
C[C@@]12[C@](CC=C3[C@]2([H])CC[C@@](C=C)(C)C3)([H])[C@@](C)(CCC1)C(O)=O
-
Structure Classification
-
Initial Source
-
Shipping
Room temperature in continental US; may vary elsewhere.
-
Storage
Powder -20°C 3 years In solvent -80°C 6 months -20°C 1 month


Solvent & Solubility
In Vitro:
DMSO : ≥ 25 mg/mL (82.66 mM; Hygroscopic DMSO has a significant impact on the solubility of product, please use newly opened DMSO)
* "≥" means soluble, but saturation unknown.
Please refer to the solubility information to select the appropriate solvent. Once prepared, please aliquot and store the solution to prevent product inactivation from repeated freeze-thaw cycles.
Storage method and period of stock solution: -80°C, 6 months; -20°C, 1 month. When stored at -80°C, please use it within 6 months. When stored at -20°C, please use it within 1 month.
Please refer to the solubility information to select the appropriate solvent. Once prepared, please aliquot and store the solution to prevent product inactivation from repeated freeze-thaw cycles.
Storage method and period of stock solution: -80°C, 6 months; -20°C, 1 month. When stored at -80°C, please use it within 6 months. When stored at -20°C, please use it within 1 month.
Concentration (start) × Volume (start) = Concentration (final) × Volume (final)
In Vivo:
Select the appropriate dissolution method based on your experimental animal and administration route.
- For the following dissolution methods, please ensure to first prepare a clear stock solution using an In Vitro approach and then sequentially add co-solvents:
- To ensure reliable experimental results, the clarified stock solution can be appropriately stored based on storage conditions. As for the working solution for In Vivo experiments, it is recommended to prepare freshly and use it on the same day.
- The percentages shown for the solvents indicate their volumetric ratio in the final prepared solution. If precipitation or phase separation occurs during preparation, heat and/or sonication can be used to aid dissolution.
Add each solvent one by one: 10% DMSO 40% PEG300 5% Tween-80 45% Saline
Solubility: ≥ 2.5 mg/mL (8.27 mM); Clear solution
This protocol yields a clear solution of ≥ 2.5 mg/mL (saturation unknown).
Taking 1 mL working solution as an example, add 100 μL DMSO stock solution (25.0 mg/mL) to 400 μL PEG300, and mix evenly; then add 50 μL Tween-80 and mix evenly; then add 450 μL Saline to adjust the volume to 1 mL.
Preparation of Saline: Dissolve 0.9 g sodium chloride in ddH₂O and dilute to 100 mL to obtain a clear Saline solution.
In Vivo Dissolution Calculator
Please enter the basic information of animal experiments:
-
-
-
-
Recommended: Prepare an additional quantity of animals to account for potential losses during experiments.
Please enter your animal formula composition:
-
%DMSO +
Recommended: Keep the proportion of DMSO in working solution below 2% if your animal is weak.
-
%+
-
+%Tween-80 + +
-
%Saline +
The co-solvents required include: DMSO, . All of co-solvents are available by MedChemExpress (MCE). , Tween 80. All of co-solvents are available by MedChemExpress (MCE).
Working solution concentration: 0.22 mg/mL
Method for preparing stock solution: mg drug dissolved in μL DMSO. Stock solution concentration: mg/mL.
1. Take μL DMSO stock solution;
2. Add μL .
μL , mix evenly;
3. Then add μL Tween 80, mix evenly;
4. Then add μL
Please ensure that the stock solution in the first step is dissolved to a clear state, and add co-solvents in sequence. You can use ultrasonic heating (ultrasonic cleaner, recommended frequency 20-40 kHz), vortexing, etc. to assist dissolution.

Protocols
-
Western Blot
Western blotting (WB) is a commonly used experimental method in molecular biology, biochemistry, and immunogenetics for identifying and quantifying target proteins. It combines gel electrophoresis with immunoassay, enabling researchers to analyze protein expression, post-translational modifications, and molecular weight.
-
Annexin V plus membrane-impermeant dye apoptosis staining
Annexin V-based apoptosis assays rely on the detection of phosphatidylserine (PS) externalization from the inner leaflet of the plasma membrane to the outer leaflet, an early biochemical hallmark of apoptosis. Fluorescently labeled Annexin V binds PS in a calcium-dependent manner, enabling identification of early apoptotic cells by flow cytometry or fluorescence microscopy. When combined with a membrane-impermeant DNA-binding dye (e. g. , propidium iodide), this approach allows discrimination between viable (Annexin V−/dye−), early apoptotic (Annexin V+/dye−), and late apoptotic or necrotic (Annexin V+/dye+) cell populations by assessing membrane integrity and PS exposure.
-
ROS/oxidative-stress fluorescent staining
ROS/oxidative-stress fluorescent staining uses cell-permeant fluorogenic probes that become fluorescent after oxidation inside cells or tissues; commonly used examples include DCFH-DA/DCFDA for broad cellular oxidant detection, DHE for superoxide-related signal detection, MitoSOX for mitochondrial superoxide-related signal detection, and CellROX probes for oxidative-stress-associated fluorescence readouts. The assay detects probe oxidation rather than a single ROS species unless the probe and analysis method have been chemically validated for that species. DCFH-DA enters cells, is deacetylated by intracellular esterases to DCFH, and produces fluorescent DCF after oxidation, so the readout is used as an operational measure of total cellular oxidative stress rather than a species-specific ROS measurement. DHE and MitoSOX can report superoxide-related oxidation, but red fluorescence alone can include non-specific ethidium-like oxidation products; HPLC or optimized spectral approaches are
-
Cell migration
Cell migration is a method that plays an important role in wound healing, cell differentiation, embryonic development, etc.
-
BrdU Incorporation Assay
Bromodeoxyuridine (BrdU) incorporation assay is based on the principle that BrdU, a thymidine analog, is incorporated into newly synthesized DNA during the S phase of the cell cycle, thereby serving as a marker of DNA replication and cellular proliferation. Incorporated BrdU can be detected using anti-BrdU antibodies following DNA denaturation, enabling visualization or quantification of proliferating cells through immunochemical detection methods such as immunofluorescence or immunohistochemistry.
-
Protocol for Cell Cycle
Cell-cycle analysis by flow cytometry measures DNA content in single cells to estimate the fraction of cells in G0/G1, S, and G2/M phases. Propidium iodide intercalates into DNA, and after RNA removal with RNase, fluorescence intensity reflects cellular DNA content: 2N cells are assigned to G0/G1, cells between 2N and 4N to S phase, and 4N cells to G2/M. DNA-content analysis alone cannot reliably separate G0 from G1 or G2 from M. Ki-67 can distinguish quiescent G0 cells from cycling cells, EdU or BrdU incorporation marks active DNA synthesis in S phase, and phospho-histone H3 staining identifies mitotic cells within the 4N population.
-
Research Protocol for Cardiovascular Diseases
Cardiovascular disease can be modeled as maladaptive cardiac remodeling, where ischemic injury or pressure overload activates inflammatory signaling, fibroblast activation, extracellular-matrix deposition, cardiomyocyte hypertrophy, vascular remodeling, and progressive ventricular dysfunction. The TGF-β/SMAD axis is a central profibrotic pathway after myocardial injury and pressure overload, while innate immune and cytokine pathways regulate leukocyte recruitment, scar formation, and adverse remodeling. Key unresolved questions include which inflammatory signals are reparative versus harmful, when fibrosis is protective versus maladaptive, and whether pathway inhibition improves function without weakening necessary infarct healing or compensatory remodeling.
-
Research Protocol for Inflammation-related Diseases
The NLRP3 inflammasome is a cytosolic innate immune signaling platform that integrates priming signals and danger-signal activation to promote caspase-1 activation, maturation of IL-1β and IL-18, and gasdermin D-mediated pyroptotic cell death. The core experimental logic is to determine whether inflammatory disease phenotypes are driven by increased NLRP3 expression, ASC-containing inflammasome assembly, caspase-1 cleavage, GSDMD cleavage, and extracellular release of IL-1β/IL-18 rather than by nonspecific cell injury alone. The pathway is strongly linked to inflammation-related disease phenotypes because monosodium urate crystals activate NALP3/NLRP3 inflammasome signaling in gout-like crystal inflammation, cholesterol crystals activate NLRP3 inflammasomes in atherogenesis models, and DSS-induced intestinal inflammation has been reported to involve NLRP3 inflammasome activity. However, experimental colitis studies also show context-dependent protective effects of NLRP3 inflammasome co
-
Breast Cancer Modeling
Breast cancer is a heterogeneous cancer, and it has been distinguished into four subtypes: luminal A, luminal B, HER2-positive and basal-like. Molecular mutations, epigenetic alterations, hormone exposure and immune microenvironment are related to the progression of breast cancer.
-
Cell Viability Determination by MTT Colorimetric Assay
The following protocol uses the MTT colorimetric assay as a classic literature-established method for assessing cell viability/metabolic activity in cultured mammalian cells. MTT[3-(4,5-dimethylthiazol-2-yl)-2,5-diphenyltetrazolium bromide] is reduced by metabolically active cells to a colored formazan product; the amount of formazan is quantified spectrophotometrically and provides an indirect measure of metabolically active viable cells. Importantly, MTT reduction reflects cellular oxidoreductase/metabolic activity rather than an absolute direct count of living cells, so changes in cellular metabolism can alter the signal independently of cell number.
-
Kinase activity and phosphorylation assays
Kinase activity assays measure the ability of kinases to transfer phosphate groups from ATP to specific substrates, while phosphorylation assays detect the presence and levels of phosphorylated proteins. Common methods include radiolabeled ATP incorporation (e. g. ,), ADP release detection via bioluminescence (e. g. ,[3]), enzyme-linked immunosorbent assays (ELISA) for phospho-specific epitopes (e. g. ,[6]), and microtiter-based formats for high-throughput screening (e. g. ,[8]). The ADP-Glo assay quantifies kinase activity by measuring ADP produced during phosphorylation using a luciferase-based system. Radiometric assays involve autoradiography or scintillation counting after incorporation of 32P-labeled ATP into substrate proteins. ELISA-based approaches rely on phospho-specific antibodies to detect activated kinases in cell lysates or purified samples.
-
Apoptosis
Apoptosis, also called programmed cell death, is generally characterized by distinct morphological characteristics.
-
TUNEL staining for apoptotic DNA fragmentation
TUNEL staining detects DNA strand breaks by using terminal deoxynucleotidyl transferase to add labeled nucleotides to exposed 3′-OH DNA termini, generating either microscopic staining in fixed cells or tissue sections, or fluorescence/cytometric signal in cell suspensions. TUNEL positivity reflects DNA fragmentation but should not be interpreted alone as definitive apoptosis, because TUNEL can also label necrotic, autolytic, mechanically damaged, or DNA-repair-associated DNA breaks.
-
Flow cytometric DNA-content cell-cycle staining
Flow cytometric DNA-content cell-cycle staining measures the fluorescence intensity of DNA-bound fluorochromes in single cells or nuclei to estimate DNA content distributions, allowing assignment of populations to G0/G1, S, and G2/M phases by DNA histogram deconvolution. Propidium iodide (PI) intercalates into DNA, and PI fluorescence is proportional to cellular DNA content when staining is performed under conditions that make DNA accessible and minimize non-DNA signal. Cells with G2/M DNA content are expected to show approximately twice the fluorescence intensity of G0/G1 cells, while S-phase cells occupy intermediate fluorescence values. PI-based DNA-content analysis can also detect cells with fractional DNA content, often reported as sub-G1, when DNA fragmentation and extraction during staining reduce retained DNA signal in apoptotic cells. DAPI is an alternative DNA fluorochrome for univariate DNA-content analysis, while bivariate approaches combining DNA content with proliferation
-
Cardiac voltage-sensitive optical mapping
Cardiac voltage-sensitive optical mapping records changes in transmembrane potential from cardiac tissue by staining the preparation with a voltage-sensitive dye and imaging fluorescence changes during electrical activation; the resulting optical action potentials can be used to map activation time, action potential duration, conduction velocity, wavefront propagation, and arrhythmia dynamics. The optical signal represents a relative fluorescence change from a tissue volume rather than a single-cell intracellular recording, so spatial resolution, sampling rate, voltage resolution, optical magnification, light penetration, and motion control must be considered together when interpreting optical action potentials.
-
Autophagy
Autophagy is a process in which eukaryotic cells use lysosomes to degrade their own cytoplasmic proteins and damaged organelles under the regulation of autophagy related gene (Atg). Microtubule-associated proteins light chain 3 (LC3) is recognized as autophagy marker, which transfers from cytoplasmic LC3 (LC3-I) to membrane type (LC3-II). LC3-II/I ratio could be detected by Western Blot and fluorescence microscopy.
-
Apoptosis Solutions
Apoptosis is a regulated, generally non-lytic cell-death pathway that removes unwanted, damaged, infected, or abnormal cells through coordinated morphological changes, caspase activation, DNA fragmentation, and membrane remodeling. The intrinsic apoptosis pathway is controlled mainly by mitochondrial outer membrane permeabilization, BCL-2 family proteins, cytochrome c release, apoptosome formation, caspase-9 activation, and downstream executioner caspase-3/7 activation. The extrinsic apoptosis pathway is initiated by death receptors such as Fas, TNFR, and TRAIL receptors, which recruit adaptor proteins and activate caspase-8 before engaging executioner caspases or mitochondrial amplification through BID cleavage. Apoptosis is linked to many phenotypes, including cancer cell killing, tissue homeostasis, immune regulation, neurodegeneration, infection response, and treatment-induced cytotoxicity; unresolved questions include how apoptosis interacts with necroptosis, pyroptosis, ferroptos
-
Protocol for Kinase activity and phosphorylation assays
Kinase activity assays measure transfer of phosphate from ATP to a protein or peptide substrate, generating phosphorylated substrate, ADP, or incorporated radiolabeled phosphate as the readout; phosphorylation assays measure site-specific phosphorylation in cells or tissues as a proxy for kinase-pathway activation, inhibition, or substrate regulation. Phosphorylation can be detected by phospho-specific Western blot, immunoprecipitation kinase assay, phospho-immunofluorescence, phospho-flow cytometry, luminescent ADP detection, radiolabeled ATP incorporation, or reporter-based pathway assays, and these readouts can be applied to cancer cells, primary neurons, mouse tumors, organoids, inflammatory macrophages, ferroptosis studies, and mitophagy studies when the kinase target is biologically relevant.
-
Mitophagy Solutions
Mitophagy is the selective autophagic degradation of mitochondria and functions as a mitochondrial quality-control pathway that removes damaged, depolarized, excess, or developmentally programmed mitochondria. The pathway links mitochondrial damage recognition, autophagosome recruitment, lysosomal delivery, and mitochondrial turnover to phenotypes such as mitochondrial homeostasis, oxidative-stress control, metabolic remodeling, differentiation, and neurodegeneration-related mitochondrial fidelity. The best-characterized damage-induced pathway is the PINK1-Parkin axis. Parkin is recruited selectively to impaired mitochondria and promotes their autophagic elimination, while mitochondrial depolarization stabilizes PINK1 on damaged mitochondria, recruits Parkin, and activates Parkin-dependent mitophagy. PINK1 also phosphorylates ubiquitin to activate Parkin E3 ubiquitin ligase activity, and PINK1-driven ubiquitin phosphorylation creates a feed-forward signal for recruiting autophagy machi
-
Macroautophagy Solutions
Macroautophagy is a conserved lysosome-dependent degradation pathway in which cytoplasmic material is sequestered into double-membrane autophagosomes and delivered to lysosomes for degradation and recycling. The pathway supports cellular homeostasis during nutrient limitation, organelle stress, protein-aggregate accumulation, infection, differentiation, and tissue remodeling by coupling cargo sequestration, autophagosome maturation, lysosomal fusion, and degradation of cargo-derived macromolecules. The core molecular sequence includes initiation by nutrient- and stress-regulated autophagy machinery, autophagosome nucleation, LC3/ATG8-family conjugation to autophagosomal membranes, cargo selection through receptors such as SQSTM1/p62, autophagosome-lysosome fusion, and lysosomal degradation. LC3 was identified as a mammalian homolog of yeast Atg8 that localizes to autophagosomal membranes after processing, and p62/SQSTM1 was shown to connect ubiquitinated cargo with autophagic degradati
-
Orthotopic Cell-Line Xenograft
Orthotopic cell-line xenograft models involve implantation of human cancer cell lines into the anatomically corresponding organ of immunodeficient mice to reproduce tumor growth within a native microenvironment, enabling more clinically relevant tumor behavior compared with subcutaneous models. These models are widely used because orthotopic placement better recapitulates tumor progression, including invasion and metastatic spread, which are often underrepresented in heterotopic implantation systems. Compared with conventional xenografts, orthotopic implantation is described as more technically complex but provides improved simulation of tumor-microenvironment interactions and metastatic behavior, making it particularly valuable for translational oncology research. Surgical orthotopic implantation approaches have been emphasized as enabling faithful reproduction of clinical cancer features, including metastasis and disease progression patterns that align with the tumor’s organ of origi


Purity & Documentation
-
Data Sheet (316 KB)
-
SDS (398 KB)
- English - EN (398 KB)
- Français - FR (398 KB)
- Deutsch - DE (398 KB)
- Norwegian - NO (398 KB)
- Español - ES (398 KB)
- Swedish - SV (398 KB)
- Italian - IT (398 KB)
- Korean - KR (398 KB)
- Portuguese - PT (398 KB)
-
Handling Instructions (2659 KB)
References
[1]. Wang Y, et al. Anti‑epileptic mechanism of isopimaric acid from Platycladi cacumen based on network pharmacology, molecular docking and biological validation. Exp Ther Med. 2024 Jul 3;28(3):348. [Content Brief]
[2]. Chiu CC, et al. Functions of mountain pine beetle cytochromes P450 CYP6DJ1, CYP6BW1 and CYP6BW3 in the oxidation of pine monoterpenes and diterpene resin acids. PloS one. 2019;14(5):e0216753. [Content Brief]
[3]. Smith E, et al. Isopimaric acid from Pinus nigra shows activity against multidrug-resistant and EMRSA strains of Staphylococcus aureus. Phytotherapy research : PTR. 2005 Jun;19(6):538-42. [Content Brief]
[4]. Perera RMTD, et al. Isopimaric acid derived from Torreya nucifera blocks autophagy and mitophagy to sensitize colon cancer cells to nutrient starvation. Cell stress & chaperones. 2026 Mar;31(2):100151. [Content Brief]
[5]. Salari S, et al. Isopimaric acid - a multi-targeting ion channel modulator reducing excitability and arrhythmicity in a spontaneously beating mouse atrial cell line. Acta physiologica (Oxford, England). 2018 Jan;222(1). [Content Brief]
[6]. Gnanasekaran T, et al. Heterologous expression of the isopimaric acid pathway in Nicotiana benthamiana and the effect of N-terminal modifications of the involved cytochrome P450 enzyme. Journal of biological engineering. 2015;9:24. [Content Brief]
[7]. Huang J, et al. The Diterpene Isopimaric Acid Modulates the Phytohormone Pathway to Promote Oryza sativa L. Rice Seedling Growth. Curr Issues Mol Biol. 2024 Sep 2;46(9):9772-9784. [Content Brief]
[8]. Li J, et al. Isopimaric acid, an ion channel regulator, regulates calcium and oxidative phosphorylation pathways to inhibit breast cancer proliferation and metastasis. Toxicology and applied pharmacology. 2023 Mar 01;462:116415. [Content Brief]
[9]. Huang D, et al. The LC-MS/MS-Based Measurement of Isopimaric Acid in Rat Plasma and Application of Pharmacokinetics. BioMed research international. 2021;2021:2310422. [Content Brief]


Complete Stock Solution Preparation Table
Please refer to the solubility information to select the appropriate solvent. Once prepared, please aliquot and store the solution to prevent product inactivation from repeated freeze-thaw cycles.
Storage method and period of stock solution: -80°C, 6 months; -20°C, 1 month. When stored at -80°C, please use it within 6 months. When stored at -20°C, please use it within 1 month.
| Optional Solvent | Concentration Solvent Mass | 1 mg | 5 mg | 10 mg | 25 mg |
|---|---|---|---|---|---|
| DMSO | 1 mM | 3.3063 mL | 16.5317 mL | 33.0633 mL | 82.6583 mL |
| 5 mM | 0.6613 mL | 3.3063 mL | 6.6127 mL | 16.5317 mL | |
| 10 mM | 0.3306 mL | 1.6532 mL | 3.3063 mL | 8.2658 mL | |
| 15 mM | 0.2204 mL | 1.1021 mL | 2.2042 mL | 5.5106 mL | |
| 20 mM | 0.1653 mL | 0.8266 mL | 1.6532 mL | 4.1329 mL | |
| 25 mM | 0.1323 mL | 0.6613 mL | 1.3225 mL | 3.3063 mL | |
| 30 mM | 0.1102 mL | 0.5511 mL | 1.1021 mL | 2.7553 mL | |
| 40 mM | 0.0827 mL | 0.4133 mL | 0.8266 mL | 2.0665 mL | |
| 50 mM | 0.0661 mL | 0.3306 mL | 0.6613 mL | 1.6532 mL | |
| 60 mM | 0.0551 mL | 0.2755 mL | 0.5511 mL | 1.3776 mL | |
| 80 mM | 0.0413 mL | 0.2066 mL | 0.4133 mL | 1.0332 mL |


Isopimaric acid Related Classifications
HY-N3463 Related Classifications
 Powered by Bioz
Keywords
- Isopimaric acid
- 5835-26-7
- Akt
- mTOR
- Apoptosis
- Autophagy
- Reactive Oxygen Species (ROS)
- Potassium Channel
- Sodium Channel
- Calcium Channel
- PINK1/Parkin
- Oxidative Phosphorylation
- Wnt
- Bacterial
- MCF-7 breast cancer cells
- AKT
- Oryza sativa L.
- 4T1 breast cancer cells
- murine microglial BV2 cells
- mouse atrial HL-1 cells
- MDA-MB-231 breast cancer cells
- AKT/mTOR pathway
- Staphylococcus aureus
- Inhibitor
- inhibitor
- inhibit