



Arjunolic acid

Based on 1 Customer Validation
Arjunolic acid is an orally active, multifunctional bioactive compound. Arjunolic acid exhibits free radical scavenging activity, as well as fungal and bacterial activities. Arjunolic acid induces apoptosis (Apoptosis) in various cancer cells. Arjunolic acid protects hepatocytes against induced oxidative stress and apoptosis by reducing reactive oxygen species and inhibiting NF-κB activation. Arjunolic acid regulates pancreatic dysfunction in type 2 diabetic rats by blocking the activation of the TLR-4/MyD88 and canonical Wnt pathways. Arjunolic acid inhibits neuroinflammation and ameliorates depressive behaviors via the SIRT1/AMPK/Notch1 signaling pathway in microglia. Arjunolic acid improves Crohn's disease-like colitis by restoring gut microbiota composition and inhibiting TLR4 signaling. Arjunolic acid suppresses osteosarcoma progression by inhibiting Wnt3a-mediated M2 polarization of macrophages. Arjunolic acid ameliorates diabetic retinopathy via the autophagy pathway regulated by AMPK/mTOR/HO-1. Arjunolic acid is applicable to research related to type 2 diabetes, organ toxicity, depression, Crohn's disease, osteosarcoma, diabetic retinopathy, and testicular dysfunction.
For research use only. We do not sell to patients.
- Purity : 98.17%
- CAS No.: 465-00-9
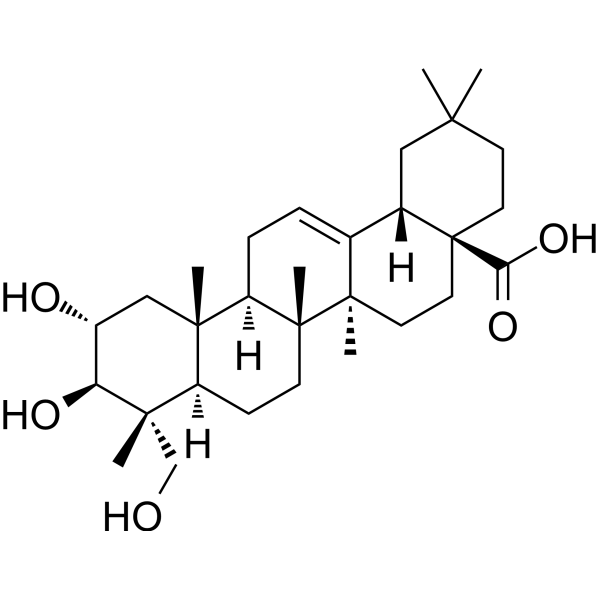
- Formula: C30H48O5
- Molecular Weight:488.70
-
Storage:Powder -20°C, 3 years ; In solvent -80°C, 6 months , -20°C, 1 month

To place orders, for customer services and technical support, please contact: MedChemExpress USA
Tel: 609-228-6898 E-mail: [email protected] [email protected]


-
 Biological Activity
-
Chemical Information
-
Solvent & Solubility
- Protocols
- Purity & Documentation
- References
-
 Help & FAQs


-
HY-115644
BMS-470539 dihydrochlorideMC-1 Receptor Agonist -
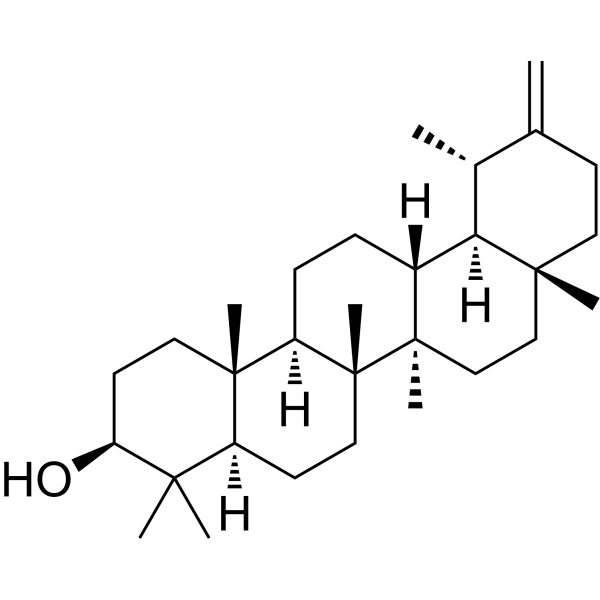
HY-N1178
TaraxasterolAnti-Inflammatory Agent; LXRα Activator -
HY-N4323
14-DeoxyandrographolideCalcium Channel Blocker -
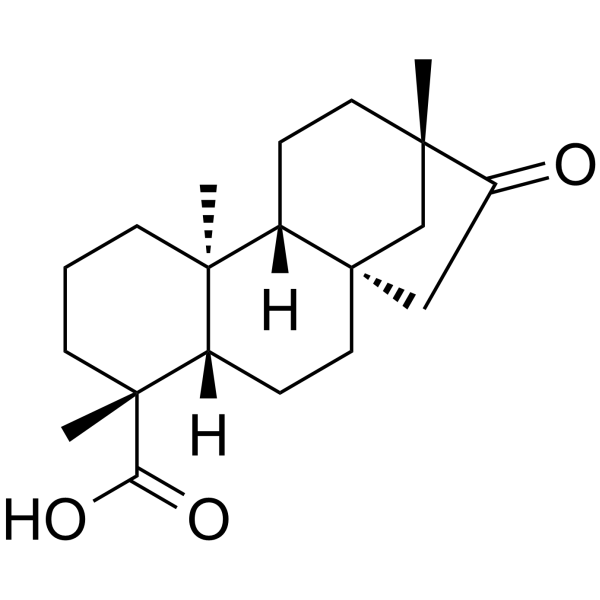
HY-N0872
IsosteviolDNA Inhibitor -
HY-N1178R
Taraxasterol (Standard)Anti-Inflammatory Agent; LXRα Activator -

HY-N4323R
14-Deoxyandrographolide (Standard)Calcium Channel Blocker -

HY-N0872R
Isosteviol (Standard)DNA Inhibitor
All AMPK Isoforms
More

Biological Activity
Description
Cellular Effect
|
Cell Line

|
Type | Value | Description | References |
|---|---|---|---|---|
| CHO | EC50 |
>10 μM
Compound: Arjunolic acid
|
Agonist activity at TGR5 expressed in CHO cells by CRE-driven luciferase reporter gene assay
Agonist activity at TGR5 expressed in CHO cells by CRE-driven luciferase reporter gene assay
|
[PMID: 19911773] |
| COS-1 | EC50 |
0 μM
Compound: Arjunolic acid
|
Agonist activity at human FXR expressed in COS1 cells by luciferase reporter gene assay
Agonist activity at human FXR expressed in COS1 cells by luciferase reporter gene assay
|
[PMID: 19911773] |
| H9 | EC50 |
15 μg/mL
Compound: 3
|
Cytotoxicity against mock-infected human H9 cells after 4 days
Cytotoxicity against mock-infected human H9 cells after 4 days
|
[PMID: 9748372] |
| Hepatocyte | IC50 |
58.4 μM
Compound: 6
|
Hepatoprotective activity against D-galactosamine/TNFalpha-induced cell death in primary cultured mouse hepatocytes treated for 30 mins before TNFalpha challenge measured after 18 hrs by MTT assay
Hepatoprotective activity against D-galactosamine/TNFalpha-induced cell death in primary cultured mouse hepatocytes treated for 30 mins before TNFalpha challenge measured after 18 hrs by MTT assay
|
[PMID: 11277757] |
| HepG2 | IC50 |
>10 μM
Compound: 18
|
Cytotoxicity against human HepG2 cells after 72 hrs by MTT assay
Cytotoxicity against human HepG2 cells after 72 hrs by MTT assay
|
[PMID: 27797185] |
| HT-29 | IC50 |
36.42 μM
Compound: 1, AA1
|
Cytotoxicity against human HT-29 cells assessed as inhibition of cell growth incubated for 72 hrs by MTT assay
Cytotoxicity against human HT-29 cells assessed as inhibition of cell growth incubated for 72 hrs by MTT assay
|
[PMID: 36846362] |
| MCF7 | IC50 |
>10 μM
Compound: 18
|
Cytotoxicity against human MCF7 cells after 72 hrs by MTT assay
Cytotoxicity against human MCF7 cells after 72 hrs by MTT assay
|
[PMID: 27797185] |
| NCI-N87 | IC50 |
>10 μM
Compound: 18
|
Cytotoxicity against human NCI-N87 cells after 72 hrs by MTT assay
Cytotoxicity against human NCI-N87 cells after 72 hrs by MTT assay
|
[PMID: 27797185] |
| PANC-1 | IC50 |
56.31 μM
Compound: 1, AA1
|
Cytotoxicity against human PANC-1 cells assessed as inhibition of cell growth incubated for 72 hrs by MTT assay
Cytotoxicity against human PANC-1 cells assessed as inhibition of cell growth incubated for 72 hrs by MTT assay
|
[PMID: 36846362] |
| RAW264.7 | IC50 |
15.17 μM
Compound: 17
|
Antiinflammatory activity in mouse RAW264.7 cells assessed as inhibition of LPS-induced nitirc oxide production preincubated for 1 hr followed by LPS-stimulation and measured after 18 hrs by Griess assay
Antiinflammatory activity in mouse RAW264.7 cells assessed as inhibition of LPS-induced nitirc oxide production preincubated for 1 hr followed by LPS-stimulation and measured after 18 hrs by Griess assay
|
[PMID: 31301930] |
| Sf21 | IC50 |
>40 μM
Compound: 12
|
Inhibition of human recombinant COX2 expressed in baculovirus infected sf21 cells assessed as decrease in PGE2 formation using arachidonic acid as substrate preincubated for 10 mins followed by substrate addition measured after 45 mins by LC-MS analysis
Inhibition of human recombinant COX2 expressed in baculovirus infected sf21 cells assessed as decrease in PGE2 formation using arachidonic acid as substrate preincubated for 10 mins followed by substrate addition measured after 45 mins by LC-MS analysis
|
[PMID: 31774676] |
In Vitro
Arjunolic acid acts as a free radical scavenger in cell-free systems by scavenging superoxide radicals, hydroxyl radicals, hydrogen peroxide, and nitric oxide radicals[2].
Arjunolic acid (0.5-30 μg/spot) inhibits the growth of *Bacillus subtilis*, *Escherichia coli* and *Shigella sonnei* in an in vitro spot assay[2].
Arjunolic acid (20 μg/mL) inhibits the growth of *Cryptococcus neoformans* with an IC50 of 20 μg/mL in in vitro antifungal assays[2].
Arjunolic acid induces 66% cell death in Dalton cells and 70% cell death in Ehrlich cells via membrane damage[2].
Arjunolic acid inhibits 12-O-tetradecanoylphorbol-13-acetate-induced Epstein-Barr virus-EA activation in Raji cells[2].
Arjunolic acid (200 μM) protects mouse hepatocytes against cadmium-induced oxidative stress and apoptotic death by reducing reactive oxygen species, inhibiting NF-κB activation, and blocking both endogenous and exogenous apoptotic signaling pathways; it also prevents sodium fluoride-induced oxidative stress and necrotic death in mouse hepatocytes[2].
Arjunolic acid (5-20 μM; 1 h) promotes the polarization of LPS (HY-D1056)-stimulated BV2 cells from the pro-inflammatory M1 phenotype to the anti-inflammatory M2 phenotype, upregulates the expression and activity of SIRT1 in cells, activates AMPK and inhibits the expression of Notch1[3].
Arjunolic acid (20-200 μM; 2-24 h) directly binds to and stabilizes the SIRT1 protein in BV2 mouse microglial cell lysates[3].
Arjunolic acid (5-40 μM; 48 h) protects LPS-induced colonic organoids from wild-type mice by reducing epithelial cell apoptosis and enhancing organoid viability[4].
Arjunolic acid (1-100 μg/mL; 24 h) reduces the viability of Saos-2 and U-2OS osteosarcoma cells in a concentration-dependent manner[5].
M2/M0 macrophages pretreated with arjunolic acid (50 μg/mL; 24 h pre-treatment of M2/M0 macrophages) inhibit the proliferation, migration and invasion of Saos-2 and U-2OS osteosarcoma cells, induce G1-phase cell cycle arrest, and promote apoptosis of these cells[5].
Arjunolic acid (50 μg/mL) promotes the polarization of M0 macrophages toward the pro-inflammatory M1 phenotype[5].
Arjunolic acid (50 μg/mL; 24 h) inhibits osteosarcoma cell-induced polarization of M0 macrophages toward the M2 phenotype and promotes their polarization toward the M1 phenotype[5].
Arjunolic acid (50 μg/mL; 24 h) inhibits Wnt3a-mediated polarization of M0 macrophages toward the M2 phenotype and promotes their polarization toward the M1 phenotype[5].
Arjunolic acid (5-10 μM; 24 h, co-treated with H2O2) significantly enhances the viability of ARPE-19 cells damaged by H2O2[6].
Arjunolic acid (5-10 μM; 24 h, co-treated with H2O2) dose-dependently reduces H2O2-induced early and total apoptosis levels in ARPE-19 cells, and restores the expression of apoptosis-related proteins to normal levels[6].
Arjunolic acid (5-10 μM; 24 h, co-treated with H2O2) alleviates oxidative stress in ARPE-19 cells by reducing reactive oxygen species (ROS) and malondialdehyde (MDA) levels, increasing superoxide dismutase (SOD) levels, and upregulating heme oxygenase-1 (HO-1) at the dose of 10 μM[6].
Arjunolic acid (5-10 μM; 24 h, co-treated with H2O2) inhibits H2O2-induced autophagy in ARPE-19 cells via activation of the AMPK/mTOR pathway[6].
MedChemExpress (MCE) has not independently confirmed the accuracy of these methods. They are for reference only. Further protocols information, click here.
-
Cell Line:BV2 mouse microglial cells (LPS-stimulated, pretreated with EX-527 SIRT1 inhibitor)
-
Concentration:20 μM
-
Incubation Time:1 h pretreatment (after EX-527); 24 h LPS co-exposure
-
Result:Reversed the arjunolic acid-mediated downregulation of M1 marker (IL-1β, TNF-α, CXCL10, IL-6, iNOS) mRNA expression when SIRT1 was inhibited.
Reversed the arjunolic acid-mediated upregulation of M2 marker (IL-10, Arg1, PPARγ) mRNA expression when SIRT1 was inhibited.
-
Cell Line:Saos-2 cells, U-2OS cells
-
Concentration:0, 1, 5, 10, 25, 50,
and 100 μg/mL -
Incubation Time:24 h
-
Result:Reduced viability of Saos-2 cells in a concentration-dependent manner, reaching a plateau at 50 μg/mL.
Reduced viability of U-2OS cells in a concentration-dependent manner, reaching a plateau at 50 μg/mL.
-
Cell Line:H2O2-induced ARPE-19 cells
-
Concentration:5 μM, 10 μM
-
Incubation Time:24 h (co-treated with H2O2)
-
Result:Significantly increased the viability of H2O2-injured ARPE-19 cells, reversing the ~70% viability reduction caused by H2O2 alone.
-
Cell Line:H2O2-induced ARPE-19 cells
-
Concentration:5 μM, 10 μM
-
Incubation Time:24 h (co-treated with H2O2)
-
Result:Reduced early apoptotic cells to 11.63% and total apoptotic cells to 13.43% at 5 μM.
Reduced early apoptotic cells to 9.03% and total apoptotic cells to 10.80% at 10 μM, compared to 21.53% early and 25.87% total apoptotic cells in H2O2-only cells.
Reduced the Bax/Bcl-2 ratio and cleaved-caspase-3 expression in H2O2-induced cells.
-
Cell Line:H2O2-induced ARPE-19 cells
-
Concentration:5 μM, 10 μM
-
Incubation Time:24 h (co-treated with H2O2)
-
Result:Significantly increased LC3-II/I protein ratio and LC3 immunofluorescence intensity at 5 μM and 10 μM.
Significantly reduced p62 protein expression at 5 μM and 10 μM.
Significantly increased p-AMPK protein levels to 1.01±0.09 and reduced p-mTOR protein levels to 0.254±0.05 at 10 μM compared to H2O2-only cells.
Pretreatment with AMPK inhibitor compound C reversed the arjunolic acid-induced increases in LC3 and HO-1, and blocked its anti-apoptotic effect.
In Vivo
Arjunolic acid (80 mg/kg; p.o.; single dose) provides complete pre-treatment protection against Acetaminophen (HY-66005)-induced hepatic necrosis, and also offers significant post-treatment protection even when administered 8 h later[2].
Arjunolic acid (50 mg/kg; two doses) exerts a protective effect against Acetaminophen-induced renal injury by maintaining antioxidant defense capacity, reducing the production of inflammatory mediators, and blocking the caspase-dependent cell death pathway[2].
Arjunolic acid (25 mg/kg; once every 2 days; 3 doses) protects against Doxorubicin (HY-15142A)-induced cardiomyocyte apoptosis by scavenging reactive oxygen species and inhibiting the MAPK-mediated pro-apoptotic signaling pathway[2].
Arjunolic acid antagonizes isoproterenol-induced myocardial necrosis, corrects abnormalities in cardiac biomarkers and electrocardiograms, and inhibits platelet aggregation and coagulation function[2].
Arjunolic acid (20 mg/kg; daily; 4 days) inhibits sodium arsenite-induced hepatic oxidative damage and necrotic liver injury by maintaining the antioxidant defense system[2].
Arjunolic acid exerts a protective effect against Streptozotocin-induced diabetic cardiomyopathy by reducing hyperglycemia and hyperlipidemia, alleviating vascular inflammation, inhibiting pro-apoptotic signaling pathways, and preserving myocardial mitochondrial function[2].
Arjunolic acid (10-100 mg/kg; single dose) exerts dose-dependent anti-inflammatory activity. At a dose of 100 mg/kg, it inhibits carrageenan-induced paw edema in rats by 80.8% (accompanied by gastrointestinal toxicity), while at 10 mg/kg, the inhibition rate is 37.6% (no toxicity)[2].
Arjunolic acid (10 mg/kg; single dose) exhibits antinociceptive activity and reduces acetic acid-induced abdominal constriction in mice by 30.3%[2].
Arjunolic acid inhibits arachidonic acid (HY-109590)-induced ear edema in mice with an inhibition rate of 55.5%, indicating that it possesses activity targeting cyclooxygenase-mediated arachidonic acid metabolism[2].
Arjunolic acid (50-100 mg/kg; single dose) exerts dose-dependent mast cell-stabilizing activity, reducing compound 48/80-induced rat mast cell degranulation to 42% at a dose of 50 mg/kg and to 33% at 100 mg/kg[2].
Arjunolic acid (50-100 mg/kg; single dose) exhibits dose-dependent anti-asthmatic activity. At the dose of 100 mg/kg, it protects guinea pigs against histamine-induced bronchospasm with a maximum protection rate of 64%, and against acetylcholine-induced bronchospasm with a maximum protection rate of 51%[2].
Arjunolic acid (1% topical ointment) promotes skin wound healing in rats and achieves complete epithelialization on day 20[2].
Arjunolic acid (10-40 mg/kg; i.g.; daily; 7 days) significantly ameliorates LPS-induced depressive-like behaviors in male C57BL/6 mice by promoting M2 polarization of microglia, increasing BDNF and 5-HT levels in the hippocampus, and activating the SIRT1/AMPK/Notch1 signaling pathway[3].
Arjunolic acid (15-60 mg/kg; p.o.; daily; 28 days) alleviates spontaneous Crohn's disease-like colitis in Il-10-/- mice by improving intestinal barrier function, inhibiting intestinal epithelial cell apoptosis (via downregulating the TLR4/MyD88 pathway), and restoring the composition of beneficial intestinal flora and the production of short-chain fatty acids[4].
Arjunolic acid (100 mg/kg; p.o.; once daily; 21 days) inhibits the progression and metastasis of osteosarcoma in nude mice by downregulating Wnt3a, reducing tumor proliferation, promoting tumor cell apoptosis, and shifting the polarization of tumor-associated macrophages from the pro-tumor M2 phenotype to the anti-tumor M1 phenotype[5].
Oral administration of arjunolic acid (10-30 mg/kg; p.o.; once daily for 10 weeks) improves Streptozotocin (HY-13753)-induced diabetic retinopathy in rats by reducing fasting blood glucose, increasing body weight, preserving retinal structure, inhibiting retinal cell apoptosis and inflammatory responses, upregulating HO-1, and activating the AMPK/mTOR-regulated autophagy pathway[6].
Arjunolic acid (1.0-2.0 mg/kg; p.o.; daily; 4 weeks) reverses Fluoxetine (HY-B0102)-induced testicular dysfunction in male Wistar rats by inhibiting oxidative inflammatory stress and apoptosis, with the anti-inflammatory efficacy of the 2.0 mg/kg oral dose being superior to that of the 1.0 mg/kg dose[7].
MedChemExpress (MCE) has not independently confirmed the accuracy of these methods. They are for reference only.
-
Animal Model:Sprague Dawley (male, 8-10 weeks old, 250-300 g, streptozotocin-nicotinamide induced T2DM)[1]
-
Dosage:25 mg/kg; 50 mg/kg
-
Administration:p.o.; daily; 28 days
-
Result:Alleviated islet degeneration at a dose of 25 mg/kg; at a dose of 50 mg/kg, it significantly ameliorated islet atrophy, apoptosis, necrosis, karyolysis, and vacuolization, restored the typical arrangement of pancreatic acinar cells, completely eliminated the collagen matrix, and restored a nearly normal islet morphology.
It improved islet size and number, and downregulated the expression of NF-κB, p-JNK1/2, Wnt3a, and β-catenin proteins; notably, the expression of MyD88 protein was significantly downregulated only at the 50 mg/kg dose.
Reduced the localization of TLR-4, NF-κB, and p-JNK1/2; significantly reduced the localization of Wnt3a and β-catenin; and, only at the 50 mg/kg dose, significantly increased the localization of IRS-1.
Significantly downregulated the mRNA expression of MyD88 and NF-κB; significantly downregulated the mRNA expression of β-catenin; and, only at the 50 mg/kg dose, significantly downregulated the mRNA expression of TNF-α, IL-1β, and Wnt3a.
-
Animal Model:Rats (acetaminophen-induced liver toxicity model)[2]
-
Dosage:80 mg/kg
-
Administration:p.o.; single dose
-
Result:Prevented acetaminophen-induced hepatic glutathione depletion, formation of the reactive acetaminophen metabolite NAPQI, centrilobular liver necrosis, and maintained liver histology near normal.
Reduced JNK activation, phosphorylation of antiapoptotic Bcl-2 and Bcl-xL, mitochondrial permeabilization, loss of mitochondrial membrane potential, and cytochrome c release when administered 4 hours after acetaminophen exposure.
Attenuated liver injury to a degree similar to the 4-hour post-treatment group when administered 8 hours after acetaminophen exposure.
-
Animal Model:C57BL/6 (male, 20-23 g, LPS-induced depressive behavior)[3]
-
Dosage:10 mg/kg; 20 mg/kg; 40 mg/kg
-
Administration:i.g.; daily; 7 days
-
Result:Significantly reduced the immobility time in both the tail suspension test and the forced swim test, and significantly increased sucrose preference.
Inhibited LPS-induced nuclear shrinkage of hippocampal neurons and elevated hippocampal BDNF protein levels; compared to the LPS + vehicle group, the 40 mg/kg dose group significantly increased hippocampal 5-HT levels.
Reduced the number of iNOS+IBA1+ (M1-type) microglia in the mouse hippocampus and increased the number of Arg1+IBA1+ (M2-type) microglia.
Significantly enhanced the expression levels and activity of hippocampal SIRT1 protein, significantly increased phosphorylated AMPK (p-AMPK) protein levels, and significantly reduced the expression levels of Notch1 protein.
-
Animal Model:C57BL/6J Il-10-/- (male, 15 weeks old, spontaneous colitis); C57BL/6J wild-type (male, 15 weeks old)[4]
-
Dosage:15 mg/kg; 30 mg/kg; 60 mg/kg
-
Administration:p.o.; daily; 28 days
-
Result:Reduced weight loss.
Decreased disease activity index scores.
Increased colon length.
Lowered colonic inflammation scores.
Reduced colonic tissue levels of IL-1β, IL-6, and TNF-α.
Decreased serum FITC-dextran levels.
Increased colonic transepithelial electric resistance values.
Reduced bacterial translocation rates in liver, mesentery lymph nodes, and spleen of Il-10-/- mice.
Increased intestinal expression of tight junction proteins ZO-1 and Claudin-1.
Reduced the percentage of TUNEL-positive colonic epithelial cells.
Upregulated colonic Bcl2 protein levels.
Downregulated colonic Bax and C-caspase-3 protein levels.
Suppressed colonic TLR4 and MyD88 protein expression.
Increased fecal levels of acetate, propionate, and butyrat.
Reduced serum LPS levels.
Elevated fecal Ruminococcus abundance.
Decreased fecal Bacteroidetes, Bacteroidia, and Bacteroidales abundance.
Reduced weight loss in recipient Il-10-/- mice via fecal microbial transplantation from treated mice.
Decreased disease activity index scores in recipient Il-10-/- mice via fecal microbial transplantation from treated mice.
Increased colon length in recipient Il-10-/- mice via fecal microbial transplantation from treated mice.
Lowered colonic IL-1β, IL-6, and TNF-α levels in recipient Il-10-/- mice via fecal microbial transplantation from treated mice.
Decreased serum FITC-dextran levels in recipient Il-10-/- mice via fecal microbial transplantation from treated mice.
Increased colonic transepithelial electric resistance values in recipient Il-10-/- mice via fecal microbial transplantation from treated mice.
Reduced serum 16S rDNA levels in recipient Il-10-/- mice via fecal microbial transplantation from treated mice.
-
Animal Model:nude mice (5-week-old, male)[5]
-
Dosage:100 mg/kg
-
Administration:p.o.; once daily; 21 consecutive days
-
Result:Reduced tumor volume and tumor mass significantly.
Decreased Ki67 positive rate from ~20% to ~12%.
Decreased expression of cell cycle proteins CDK2, CDK4, and Cyclin D1.
Increased tumor cell apoptosis rate from ~10% to ~20%.
Reduced number of lung metastatic nodules from ~10 to ~4.
Decreased M2 macrophage markers: reduced CD163 positive cells from ~51% to ~21%; significantly decreased Arg-1, IL-10, TGF-β1, MMP-9 mRNA and serum protein levels.
Increased M1 macrophage markers: increased CD86 positive cells from ~30% to ~61%; significantly increased IL-6, IL-1β, TNF-α, iNOS mRNA and serum protein levels.
Reduced tumor Wnt3a mRNA expression significantly.\nIn combination with Wnt3a knockdown, further reduced tumor volume and mass, enhanced tumor tissue damage, decreased Ki67, CDK2, CDK4, and Cyclin D1 expression, increased tumor cell apoptosis, reduced lung metastatic nodules, further suppressed M2 macrophage markers, and further increased M1 macrophage markers compared to arjunolic acid alone.
In combination with Wnt3a overexpression, reversed anti-tumor effects: increased tumor volume and mass, exacerbated tumor tissue pathology, increased Ki67, CDK2, CDK4, and Cyclin D1 expression, decreased tumor cell apoptosis, increased lung metastatic nodules, upregulated M2 macrophage markers, and downregulated M1 macrophage markers.
-
Animal Model:Sprague-Dawley (male, 180-200 g, diabetic retinopathy induced by 65 mg/kg STZ i.p. injection)[6]
-
Dosage:10 mg/kg; 30 mg/kg
-
Administration:p.o.; once daily; 10 weeks
-
Result:Reduced fast blood glucose to 17.5 mmol/L (10 mg/kg) and 14.7 mmol/L (30 mg/kg) from 30.4 mmol/L in the STZ-only group.
Significantly increased final body weight compared to the STZ-only group for both doses.
Increased retinal outer nuclear layer (ONL) thickness to ~28 μm (10 mg/kg) and ~35 μm (30 mg/kg) from ~18 μm in the STZ-only group; significantly elevated ONL nuclei counts.
Reduced TUNEL-positive retinal cell area by 32% (10 mg/kg) and 70% (30 mg/kg) compared to the STZ-only group.
Decreased Bax/Bcl-2 protein ratio to ~2.8 (10 mg/kg) and ~2.0 (30 mg/kg) from ~4.0 in the STZ-only group; significantly reduced cleaved caspase-3 protein levels.
Significantly reduced retinal levels of pro-inflammatory cytokines IL-1β, IL-6, and TNF-α for both doses; 30 mg/kg dose showed for IL-6 and TNF-α, and for IL-1β compared to the STZ-only group.
Significantly upregulated retinal HO-1 protein expression in the 30 mg/kg dose group.
Significantly increased LC3-II/I protein ratio, significantly reduced p62 protein levels, upregulated AMPK phosphorylation, and downregulated mTOR phosphorylation in treated groups compared to the STZ-only group.
-
Animal Model:Wistar rats (male, 6-8 weeks old, 150-250 g, testicular dysfunction induced by oral fluoxetine 10 mg/kg daily for 4 weeks)[7]
-
Dosage:1.0 mg/kg; 2.0 mg/kg; 1.0 mg/kg (co-administered with fluoxetine); 2.0 mg/kg (co-administered with fluoxetine)
-
Administration:p.o.; daily; 4 weeks
-
Result:Significantly reversed fluoxetine-induced alterations when co-administered at 1.0 mg/kg and 2.0 mg/kg, including reduced testicular MDA levels, increased SOD, CAT, and GSH activities, decreased TNF-α, IL-1ß, and MPO levels, normalized Bcl-2, p53, and caspase-3 levels, restored 3ß-HSD and 17ß-HSD activities, and recovered Na+/K+ ATPase, Ca2+ ATPase, and H+ ATPase activities.
Showed more significant inflammatory marker reduction effects at 2.0 mg/kg than at 1.0 mg/kg when co-administered with fluoxetine.
Repaired fluoxetine-induced testicular histopathological damage, including degenerated seminiferous tubules, necrosis, atrophy, pyknotic cells, vascular congestion, and disrupted spermatogenesis, restoring near-normal testicular architecture when co-administered at 1.0 mg/kg and 2.0 mg/kg.


Chemical Information
-
CAS No. 465-00-9
-
Appearance Solid
-
Molecular Weight 488.70
-
Formula C30H48O5
-
Color White to off-white
-
SMILES
C[C@]([C@@]1([H])[C@]2(C[C@H]3O)C)(CC[C@@]2([H])[C@@](C)([C@H]3O)CO)[C@@](C([C@]4([H])CC5(C)C)=CC1)(CC[C@]4(CC5)C(O)=O)C
-
Structure Classification
-
Initial Source
-
Shipping
Room temperature in continental US; may vary elsewhere.
-
Storage
Powder -20°C 3 years In solvent -80°C 6 months -20°C 1 month


Solvent & Solubility
In Vitro:
DMSO : 100 mg/mL (204.62 mM; Need ultrasonic; Hygroscopic DMSO has a significant impact on the solubility of product, please use newly opened DMSO)
Please refer to the solubility information to select the appropriate solvent. Once prepared, please aliquot and store the solution to prevent product inactivation from repeated freeze-thaw cycles.
Storage method and period of stock solution: -80°C, 6 months; -20°C, 1 month. When stored at -80°C, please use it within 6 months. When stored at -20°C, please use it within 1 month.
Please refer to the solubility information to select the appropriate solvent. Once prepared, please aliquot and store the solution to prevent product inactivation from repeated freeze-thaw cycles.
Storage method and period of stock solution: -80°C, 6 months; -20°C, 1 month. When stored at -80°C, please use it within 6 months. When stored at -20°C, please use it within 1 month.
Concentration (start) × Volume (start) = Concentration (final) × Volume (final)
In Vivo:
Select the appropriate dissolution method based on your experimental animal and administration route.
- For the following dissolution methods, please ensure to first prepare a clear stock solution using an In Vitro approach and then sequentially add co-solvents:
- To ensure reliable experimental results, the clarified stock solution can be appropriately stored based on storage conditions. As for the working solution for In Vivo experiments, it is recommended to prepare freshly and use it on the same day.
- The percentages shown for the solvents indicate their volumetric ratio in the final prepared solution. If precipitation or phase separation occurs during preparation, heat and/or sonication can be used to aid dissolution.
Add each solvent one by one: 10% DMSO 40% PEG300 5% Tween-80 45% Saline
Solubility: ≥ 2.5 mg/mL (5.12 mM); Clear solution
This protocol yields a clear solution of ≥ 2.5 mg/mL (saturation unknown).
Taking 1 mL working solution as an example, add 100 μL DMSO stock solution (25.0 mg/mL) to 400 μL PEG300, and mix evenly; then add 50 μL Tween-80 and mix evenly; then add 450 μL Saline to adjust the volume to 1 mL.
Preparation of Saline: Dissolve 0.9 g sodium chloride in ddH₂O and dilute to 100 mL to obtain a clear Saline solution.
Add each solvent one by one: 10% DMSO 90% (20% SBE-β-CD in Saline)
Solubility: ≥ 2.5 mg/mL (5.12 mM); Clear solution
This protocol yields a clear solution of ≥ 2.5 mg/mL (saturation unknown).
Taking 1 mL working solution as an example, add 100 μL DMSO stock solution (25.0 mg/mL) to 900 μL 20% SBE-β-CD in Saline, and mix evenly.
Preparation of 20% SBE-β-CD in Saline (4°C, storage for one week): 2 g SBE-β-CD powder is dissolved in 10 mL Saline, completely dissolve until clear.
In Vivo Dissolution Calculator
Please enter the basic information of animal experiments:
-
-
-
-
Recommended: Prepare an additional quantity of animals to account for potential losses during experiments.
Please enter your animal formula composition:
-
%DMSO +
Recommended: Keep the proportion of DMSO in working solution below 2% if your animal is weak.
-
%+
-
+%Tween-80 + +
-
%Saline +
The co-solvents required include: DMSO, . All of co-solvents are available by MedChemExpress (MCE). , Tween 80. All of co-solvents are available by MedChemExpress (MCE).
Working solution concentration: 0.22 mg/mL
Method for preparing stock solution: mg drug dissolved in μL DMSO. Stock solution concentration: mg/mL.
1. Take μL DMSO stock solution;
2. Add μL .
μL , mix evenly;
3. Then add μL Tween 80, mix evenly;
4. Then add μL
Please ensure that the stock solution in the first step is dissolved to a clear state, and add co-solvents in sequence. You can use ultrasonic heating (ultrasonic cleaner, recommended frequency 20-40 kHz), vortexing, etc. to assist dissolution.

Protocols
-
Annexin V plus membrane-impermeant dye apoptosis staining
Annexin V-based apoptosis assays rely on the detection of phosphatidylserine (PS) externalization from the inner leaflet of the plasma membrane to the outer leaflet, an early biochemical hallmark of apoptosis. Fluorescently labeled Annexin V binds PS in a calcium-dependent manner, enabling identification of early apoptotic cells by flow cytometry or fluorescence microscopy. When combined with a membrane-impermeant DNA-binding dye (e. g. , propidium iodide), this approach allows discrimination between viable (Annexin V−/dye−), early apoptotic (Annexin V+/dye−), and late apoptotic or necrotic (Annexin V+/dye+) cell populations by assessing membrane integrity and PS exposure.
-
ROS/oxidative-stress fluorescent staining
ROS/oxidative-stress fluorescent staining uses cell-permeant fluorogenic probes that become fluorescent after oxidation inside cells or tissues; commonly used examples include DCFH-DA/DCFDA for broad cellular oxidant detection, DHE for superoxide-related signal detection, MitoSOX for mitochondrial superoxide-related signal detection, and CellROX probes for oxidative-stress-associated fluorescence readouts. The assay detects probe oxidation rather than a single ROS species unless the probe and analysis method have been chemically validated for that species. DCFH-DA enters cells, is deacetylated by intracellular esterases to DCFH, and produces fluorescent DCF after oxidation, so the readout is used as an operational measure of total cellular oxidative stress rather than a species-specific ROS measurement. DHE and MitoSOX can report superoxide-related oxidation, but red fluorescence alone can include non-specific ethidium-like oxidation products; HPLC or optimized spectral approaches are
-
Research Protocol for Microbiome Analysis
Microbiome analysis characterizes microbial communities in biological or environmental samples by measuring community composition, diversity, taxonomic structure, functional potential, and associations with host or environmental phenotypes. 16S rRNA gene amplicon sequencing is commonly used for bacterial and archaeal taxonomic profiling, while shotgun metagenomics provides higher taxonomic resolution and direct functional information, including microbial genes, pathways, viruses, fungi, and antimicrobial-resistance genes when sequencing depth and host-DNA contamination are adequately controlled. Microbiome results are strongly affected by sample collection, storage, DNA extraction, contamination, sequencing method, reference database, and bioinformatic pipeline; therefore, standardized protocols, negative controls, mock communities, and transparent analysis workflows are required. Unresolved issues include low-biomass contamination, compositional-data bias, inconsistent species-level c
-
Research Protocol for Inflammation-related Diseases
The NLRP3 inflammasome is a cytosolic innate immune signaling platform that integrates priming signals and danger-signal activation to promote caspase-1 activation, maturation of IL-1β and IL-18, and gasdermin D-mediated pyroptotic cell death. The core experimental logic is to determine whether inflammatory disease phenotypes are driven by increased NLRP3 expression, ASC-containing inflammasome assembly, caspase-1 cleavage, GSDMD cleavage, and extracellular release of IL-1β/IL-18 rather than by nonspecific cell injury alone. The pathway is strongly linked to inflammation-related disease phenotypes because monosodium urate crystals activate NALP3/NLRP3 inflammasome signaling in gout-like crystal inflammation, cholesterol crystals activate NLRP3 inflammasomes in atherogenesis models, and DSS-induced intestinal inflammation has been reported to involve NLRP3 inflammasome activity. However, experimental colitis studies also show context-dependent protective effects of NLRP3 inflammasome co
-
Research Protocol for Neurological Diseases
PINK1/Parkin-mediated mitophagy pathway is a mitochondrial quality-control signaling axis in which mitochondrial depolarization stabilizes PINK1 on damaged mitochondria, activates Parkin recruitment and E3 ubiquitin ligase activity, promotes ubiquitination of outer mitochondrial membrane proteins, recruits selective autophagy adaptors, and drives lysosomal degradation of damaged mitochondria. In neurological disease research, this pathway is experimentally important because neurons, especially dopaminergic neurons, are highly dependent on mitochondrial integrity, and defective mitochondrial turnover can lead to mitochondrial dysfunction, oxidative stress, impaired neuronal survival, α-synuclein accumulation, and neuroinflammatory damage-associated signals. The genetic disease link is strongest in Parkinson’s disease because mutations in PRKN/parkin cause autosomal recessive juvenile parkinsonism, mutations in PINK1 cause hereditary early-onset Parkinson’s disease, and Drosophila studie
-
Research Protocol for Metabolic Diseases
AMP-activated protein kinase, AMPK, is a conserved cellular energy sensor that responds to reduced cellular energy status and coordinates metabolism by increasing ATP-generating catabolic pathways while suppressing ATP-consuming anabolic processes. In metabolic disease research, the AMPK pathway is experimentally relevant because it regulates hepatic lipid synthesis, fatty acid oxidation, glucose production, skeletal-muscle glucose disposal, mTORC1-linked biosynthesis, autophagy, mitochondrial homeostasis, and whole-body energy balance. The central pathway logic is that energy stress, metformin, exercise-like stimulation, or direct AMPK activators increase AMPKα Thr172 phosphorylation and downstream substrate phosphorylation, including ACC and RAPTOR. Phosphorylation of ACC suppresses lipogenesis and supports fatty acid oxidation, whereas phosphorylation of RAPTOR suppresses mTORC1 signaling and links cellular energy status to growth and protein synthesis control. The pathway is linked
-
Apoptosis
Apoptosis, also called programmed cell death, is generally characterized by distinct morphological characteristics.
-
TUNEL staining for apoptotic DNA fragmentation
TUNEL staining detects DNA strand breaks by using terminal deoxynucleotidyl transferase to add labeled nucleotides to exposed 3′-OH DNA termini, generating either microscopic staining in fixed cells or tissue sections, or fluorescence/cytometric signal in cell suspensions. TUNEL positivity reflects DNA fragmentation but should not be interpreted alone as definitive apoptosis, because TUNEL can also label necrotic, autolytic, mechanically damaged, or DNA-repair-associated DNA breaks.
-
DSS-Induced Colitis
Dextran sulfate sodium (DSS)-induced colitis is generated by administering DSS in mouse drinking water, producing epithelial injury, barrier disruption, weight loss, diarrhea, fecal blood, colon shortening, histologic mucosal damage, and inflammatory mediator changes; the model is mainly used to study acute or chronic intestinal inflammation resembling selected features of ulcerative colitis. DSS injury is interpreted through clinical and tissue readouts rather than a single molecular endpoint: daily body weight, stool consistency, and bleeding are combined into a disease activity index, while colon length, histology, cytokines, myeloperoxidase activity, intestinal permeability, and tight-junction markers provide complementary measures of inflammation and barrier damage.
-
TNBS-Induced Colitis
TNBS-induced colitis is produced by intrarectal delivery of 2,4,6-trinitrobenzene sulfonic acid in ethanol, where ethanol disrupts the mucosal barrier and TNBS haptenates colonic proteins, generating immune-mediated colonic inflammation with weight loss, diarrhea, ulceration, transmural injury, inflammatory-cell infiltration, and cytokine responses. The model is used as an experimental intestinal inflammation model with Crohn’s disease–like features, especially when Th1-type responses, IL-12–dependent inflammation, chronic relapsing inflammation, or fibrosis-related endpoints are studied.
-
Autophagy
Autophagy is a process in which eukaryotic cells use lysosomes to degrade their own cytoplasmic proteins and damaged organelles under the regulation of autophagy related gene (Atg). Microtubule-associated proteins light chain 3 (LC3) is recognized as autophagy marker, which transfers from cytoplasmic LC3 (LC3-I) to membrane type (LC3-II). LC3-II/I ratio could be detected by Western Blot and fluorescence microscopy.
-
Apoptosis Solutions
Apoptosis is a regulated, generally non-lytic cell-death pathway that removes unwanted, damaged, infected, or abnormal cells through coordinated morphological changes, caspase activation, DNA fragmentation, and membrane remodeling. The intrinsic apoptosis pathway is controlled mainly by mitochondrial outer membrane permeabilization, BCL-2 family proteins, cytochrome c release, apoptosome formation, caspase-9 activation, and downstream executioner caspase-3/7 activation. The extrinsic apoptosis pathway is initiated by death receptors such as Fas, TNFR, and TRAIL receptors, which recruit adaptor proteins and activate caspase-8 before engaging executioner caspases or mitochondrial amplification through BID cleavage. Apoptosis is linked to many phenotypes, including cancer cell killing, tissue homeostasis, immune regulation, neurodegeneration, infection response, and treatment-induced cytotoxicity; unresolved questions include how apoptosis interacts with necroptosis, pyroptosis, ferroptos
-
Notch Pathway Solutions
The Notch pathway is a contact-dependent signaling pathway that controls cell-fate decisions, differentiation, proliferation, and tissue patterning through interactions between membrane-bound Notch receptors and membrane-bound ligands on neighboring cells. Canonical Notch signaling is activated when ligand engagement triggers proteolytic release of the Notch intracellular domain, which enters the nucleus and regulates transcription together with DNA-binding transcriptional complexes. In the canonical mechanism, ligand-dependent Notch activation leads to release of the intracellular Notch domain, and presenilin-dependent γ-secretase activity is required for production of the active intracellular signaling fragment. The released intracellular domain functions as a nuclear signal that converts Notch receptor activation at the membrane into transcriptional regulation of target programs such as HES/HEY-family genes and other context-dependent downstream targets. The literature links Notch p
-
Lysosome and acidic-vesicle live-cell staining
Lysosome and acidic-vesicle live-cell staining detects acidic intracellular compartments by using membrane-permeant acidotropic probes that accumulate in low-pH vesicles, including lysosomes, late endosomes, autolysosomes, and acidic phagosomes. LysoTracker staining is commonly used as an intensity-based readout of acidic lysosomal compartment abundance or enlargement, while acridine orange produces green fluorescence in less concentrated compartments and red fluorescence after concentration-dependent accumulation in acidic vesicular organelles. Loss or reduction of acridine-orange red signal can be used as a readout of lysosomal membrane permeabilization or reduced acidic-vesicle integrity. This protocol is designed for live cultured cells and can be adapted for fluorescence microscopy, high-content imaging, plate-reader readout, or flow cytometry when the selected literature supports the readout. Because these dyes report acidotropic accumulation rather than lysosome identity alone,
-
Macroautophagy Solutions
Macroautophagy is a conserved lysosome-dependent degradation pathway in which cytoplasmic material is sequestered into double-membrane autophagosomes and delivered to lysosomes for degradation and recycling. The pathway supports cellular homeostasis during nutrient limitation, organelle stress, protein-aggregate accumulation, infection, differentiation, and tissue remodeling by coupling cargo sequestration, autophagosome maturation, lysosomal fusion, and degradation of cargo-derived macromolecules. The core molecular sequence includes initiation by nutrient- and stress-regulated autophagy machinery, autophagosome nucleation, LC3/ATG8-family conjugation to autophagosomal membranes, cargo selection through receptors such as SQSTM1/p62, autophagosome-lysosome fusion, and lysosomal degradation. LC3 was identified as a mammalian homolog of yeast Atg8 that localizes to autophagosomal membranes after processing, and p62/SQSTM1 was shown to connect ubiquitinated cargo with autophagic degradati


Purity & Documentation
-
Data Sheet (311 KB)
-
SDS (252 KB)
- English - EN (252 KB)
- Français - FR (252 KB)
- Deutsch - DE (252 KB)
- Norwegian - NO (252 KB)
- Español - ES (252 KB)
- Swedish - SV (252 KB)
- Italian - IT (252 KB)
- Korean - KR (252 KB)
- Portuguese - PT (252 KB)
-
Handling Instructions (2659 KB)
References
[1]. Aamir K, et al. Arjunolic acid modulate pancreatic dysfunction by ameliorating pattern recognition receptor and canonical Wnt pathway activation in type 2 diabetic rats. Life Sci. 2023;327:121856. [Content Brief]
[2]. Ghosh J, et al. Arjunolic acid: a new multifunctional therapeutic promise of alternative medicine. Biochimie. 2013;95(6):1098-1109. [Content Brief]
[3]. Yang Y, et al. Arjunolic acid ameliorates lipopolysaccharide-induced depressive behavior by inhibiting neuroinflammation via microglial SIRT1/AMPK/Notch1 signaling pathway. J Ethnopharmacol. 2024;330:118225. [Content Brief]
[4]. Zhang Z, et al. Arjunolic acid protects the intestinal epithelial barrier, ameliorating Crohn's disease-like colitis by restoring gut microbiota composition and inactivating TLR4 signalling. Phytomedicine. 2024;123:155223. [Content Brief]
[5]. Li J, et al. Arjunolic acid inhibits Wnt3a-mediated macrophage M2 polarization to suppress osteosarcoma progression. Genes Nutr. 2025;20(1):11. Published 2025 May 21. [Content Brief]
[6]. Zhang XX, et al. Arjunolic acid from Cyclocarya paliurus ameliorates diabetic retinopathy through AMPK/mTOR/HO-1 regulated autophagy pathway. J Ethnopharmacol. 2022;284:114772. [Content Brief]
[7]. Lynda EO, et al. Arjunolic acid reverses fluoxetine-induced alterations in testicular steroidogenic enzymes and membrane bound ionic pump imbalance through suppression of oxido-inflammatory stress and apoptosis. JBRA Assist Reprod. 2024;28(1):66-77. Published 2024 Feb 26. [Content Brief]


Complete Stock Solution Preparation Table
Please refer to the solubility information to select the appropriate solvent. Once prepared, please aliquot and store the solution to prevent product inactivation from repeated freeze-thaw cycles.
Storage method and period of stock solution: -80°C, 6 months; -20°C, 1 month. When stored at -80°C, please use it within 6 months. When stored at -20°C, please use it within 1 month.
| Optional Solvent | Concentration Solvent Mass | 1 mg | 5 mg | 10 mg | 25 mg |
|---|---|---|---|---|---|
| DMSO | 1 mM | 2.0462 mL | 10.2312 mL | 20.4625 mL | 51.1561 mL |
| 5 mM | 0.4092 mL | 2.0462 mL | 4.0925 mL | 10.2312 mL | |
| 10 mM | 0.2046 mL | 1.0231 mL | 2.0462 mL | 5.1156 mL | |
| 15 mM | 0.1364 mL | 0.6821 mL | 1.3642 mL | 3.4104 mL | |
| 20 mM | 0.1023 mL | 0.5116 mL | 1.0231 mL | 2.5578 mL | |
| 25 mM | 0.0818 mL | 0.4092 mL | 0.8185 mL | 2.0462 mL | |
| 30 mM | 0.0682 mL | 0.3410 mL | 0.6821 mL | 1.7052 mL | |
| 40 mM | 0.0512 mL | 0.2558 mL | 0.5116 mL | 1.2789 mL | |
| 50 mM | 0.0409 mL | 0.2046 mL | 0.4092 mL | 1.0231 mL | |
| 60 mM | 0.0341 mL | 0.1705 mL | 0.3410 mL | 0.8526 mL | |
| 80 mM | 0.0256 mL | 0.1279 mL | 0.2558 mL | 0.6395 mL | |
| 100 mM | 0.0205 mL | 0.1023 mL | 0.2046 mL | 0.5116 mL |


Arjunolic acid Related Classifications
HY-N2896 Related Classifications
 Powered by Bioz
Keywords
- Arjunolic acid
- 465-00-9
- Free Radical Scavengers
- Reactive Oxygen Species (ROS)
- Apoptosis
- Fungal
- Bacterial
- NF-κB
- SOD
- AMPK
- mTOR
- Notch
- Toll-like Receptor (TLR)
- Wnt
- MyD88
- Sirtuin
- bioactive compound
- fungal
- bacterial
- type 2 diabetes
- organ toxicity
- depression
- Crohn's disease
- osteosarcoma
- diabetic retinopathy
- and testicular dysfunction
- ARPE-19 cells
- Saos-2 cells
- U-2OS cells
- BV2cells
- Sprague Dawley Rat
- C57BL/6 mice
- Inhibitor
- inhibitor
- inhibit