



IGF2BP1-IN-1

Based on 1 Customer Validation
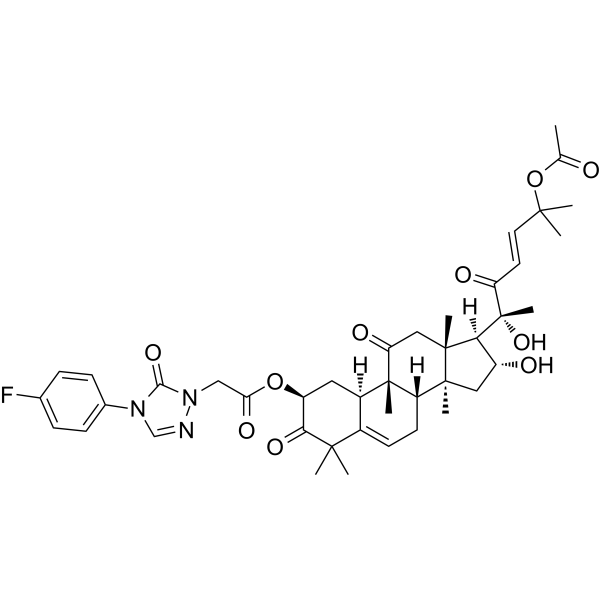
IGF2BP1-IN-1, a Cucurbitacin B (HY-N0416) derivative, is a potent IGF2BP1 inhibitor (KD = 2.88 nM). IGF2BP1-IN-1 binds directly to IGF2BP1, thereby inducing tumor cell cycle arrest, increasing apoptosis, and reducing autophagy. IGF2BP1-IN-1 can be used in research on NSLSC, colon, breast, liver, ovarian, pancreatic, and cervical cancers.
For research use only. We do not sell to patients.
- Purity : 99.94%
- CAS No.: 3029447-08-0
- Formula: C42H52FN3O10
- Molecular Weight:777.87
-
Storage:
-20°C, protect from light, stored under nitrogen
* In solvent : -80°C, 6 months; -20°C, 1 month (protect from light, stored under nitrogen)

To place orders, for customer services and technical support, please contact: MedChemExpress USA
Tel: 609-228-6898 E-mail: [email protected] [email protected]


-
 Biological Activity
-
Chemical Information
-
Solvent & Solubility
- Protocols
- Purity & Documentation
- References
-
 Help & FAQs




Biological Activity
Description
IC50 & Target
|
Bcl-xL |
Bcl-2 |
Cellular Effect
|
Cell Line

|
Type | Value | Description | References |
|---|---|---|---|---|
| A549 | IC50 |
0.009 μM
Compound: A11
|
Antiproliferative activity against human A549 cells assessed as cell growth inhibition incubated for 72 hrs by SRB assay
Antiproliferative activity against human A549 cells assessed as cell growth inhibition incubated for 72 hrs by SRB assay
|
[PMID: 37681508] |
| A549 | IC50 |
5 nM
Compound: A11
|
Antiproliferative activity against wild type human A549 cells assessed as cell growth inhibition incubated for 72 hrs by SRB assay
Antiproliferative activity against wild type human A549 cells assessed as cell growth inhibition incubated for 72 hrs by SRB assay
|
[PMID: 37681508] |
| A549 | IC50 |
92 nM
Compound: A11
|
Antiproliferative activity against human A549 cells with IGF2BP1 knockdown assessed as cell growth inhibition incubated for 72 hrs by SRB assay
Antiproliferative activity against human A549 cells with IGF2BP1 knockdown assessed as cell growth inhibition incubated for 72 hrs by SRB assay
|
[PMID: 37681508] |
| BXPC-3 | IC50 |
0.018 μM
Compound: A11
|
Antiproliferative activity against human BXPC-3 cells assessed as cell growth inhibition incubated for 72 hrs by SRB assay
Antiproliferative activity against human BXPC-3 cells assessed as cell growth inhibition incubated for 72 hrs by SRB assay
|
[PMID: 37681508] |
| CFPAC-1 | IC50 |
0.037 μM
Compound: A11
|
Antiproliferative activity against human CFPAC-1 cells assessed as cell growth inhibition incubated for 72 hrs by SRB assay
Antiproliferative activity against human CFPAC-1 cells assessed as cell growth inhibition incubated for 72 hrs by SRB assay
|
[PMID: 37681508] |
| HCT-116 | IC50 |
0.034 μM
Compound: A11
|
Antiproliferative activity against human HCT-116 cells assessed as cell growth inhibition incubated for 72 hrs by SRB assay
Antiproliferative activity against human HCT-116 cells assessed as cell growth inhibition incubated for 72 hrs by SRB assay
|
[PMID: 37681508] |
| HeLa | IC50 |
0.015 μM
Compound: A11
|
Antiproliferative activity against human HeLa cells assessed as cell growth inhibition incubated for 72 hrs by SRB assay
Antiproliferative activity against human HeLa cells assessed as cell growth inhibition incubated for 72 hrs by SRB assay
|
[PMID: 37681508] |
| HepG2 | IC50 |
0.08 μM
Compound: A11
|
Antiproliferative activity against human HepG2 cells assessed as cell growth inhibition incubated for 72 hrs by SRB assay
Antiproliferative activity against human HepG2 cells assessed as cell growth inhibition incubated for 72 hrs by SRB assay
|
[PMID: 37681508] |
| L02 | IC50 |
0.1 μM
Compound: A11
|
Antiproliferative activity against human L02 cells assessed as cell growth inhibition incubated for 72 hrs by SRB assay
Antiproliferative activity against human L02 cells assessed as cell growth inhibition incubated for 72 hrs by SRB assay
|
[PMID: 37681508] |
| MCF7 | IC50 |
0.056 μM
Compound: A11
|
Antiproliferative activity against human MCF7 cells assessed as cell growth inhibition incubated for 72 hrs by SRB assay
Antiproliferative activity against human MCF7 cells assessed as cell growth inhibition incubated for 72 hrs by SRB assay
|
[PMID: 37681508] |
| MDA-MB-231 | IC50 |
0.049 μM
Compound: A11
|
Antiproliferative activity against human MDA-MB-231 cells assessed as cell growth inhibition incubated for 72 hrs by SRB assay
Antiproliferative activity against human MDA-MB-231 cells assessed as cell growth inhibition incubated for 72 hrs by SRB assay
|
[PMID: 37681508] |
| PANC-1 | IC50 |
0.088 μM
Compound: A11
|
Antiproliferative activity against human PANC-1 cells assessed as cell growth inhibition incubated for 72 hrs by SRB assay
Antiproliferative activity against human PANC-1 cells assessed as cell growth inhibition incubated for 72 hrs by SRB assay
|
[PMID: 37681508] |
| SK-OV-3 | IC50 |
0.054 μM
Compound: A11
|
Antiproliferative activity against human SK-OV-3 cells assessed as cell growth inhibition incubated for 72 hrs by SRB assay
Antiproliferative activity against human SK-OV-3 cells assessed as cell growth inhibition incubated for 72 hrs by SRB assay
|
[PMID: 37681508] |
In Vitro
IGF2BP1-IN-1 (compound A11) (72 h) exhibits potent and selective inhibition of cell proliferation in human non-small cell lung cancer cells (A549) (IC50 = 0.009 μM; SI = 11.11). IGF2BP1-IN-1 significantly inhibits the proliferation of various cancer cell lines, including HCT-116 (IC50 = 0.080 μM), MDA-MB-231 (IC50 = 0.049 μM), MCF-7 (IC50 = 0.056 μM), SK-OC-3 (IC50 = 0.054 μM), HeLa (IC50 = 0.015 μM), HepG-2 (IC50 = 0.080 μM), BXPC-3 (IC50 = 0.018 μM), PANC-1 (IC50 = 0.088 μM), and CFPAC-1 (IC50 = 0.037 μM). IGF2BP1-IN-1 shows weaker inhibitory activity against the L02 cell line (IC50 = 0.100 μM)[1].
IGF2BP1-IN-1 (0.1-0.5 μM; 48 h) significantly induces apoptosis in human non-small cell lung cancer cells (A549) in a dose-dependent manner. IGF2BP1-IN-1 significantly inhibits autophagy in human non-small cell lung cancer cells (A549) in a dose-dependent manner[1].
IGF2BP1-IN-1 (0.1-0.5 μM; 24 h) induces cell cycle arrest at the G2/M phase in human non-small cell lung cancer cells (A549)[1].
IGF2BP1-IN-1 (0.625-10 μM) binds directly and irreversibly to recombinant IGF2BP1 in vitro with extremely high affinity (KD = 2.88 nM)[1].
IGF2BP1-IN-1 (1 μM; 2 h) binds directly to endogenous IGF2BP1 and increases its thermal stability in human non-small cell lung cancer (A549) cells[1].
IGF2BP1-IN-1 (0.1-1.0 μM; 48 h) dose-dependently inhibits the expression of the downstream protein c-MYC, anti-apoptotic proteins Bcl-2 and Bcl-xl, and cell cycle proteins CDK4 and Cyclin D1, while inducing PARP cleavage in human non-small cell lung cancer (A549) cells[1].
The antiproliferative activity of IGF2BP1-IN-1 (72 h) is significantly reduced in human non-small cell lung cancer (A549) cells where IGF2BP1 expression has been knocked down via siRNA (IC50 value increased from 0.005 μM to 0.092 μM)[1].
MedChemExpress (MCE) has not independently confirmed the accuracy of these methods. They are for reference only.
-
Cell Line:A549 cells
-
Concentration:0.1 μM, 0.2 μM, 0.5 μM
-
Incubation Time:24 h
-
Result:Led to a significant accumulation of A549 cells in the G2/M phase, inducing cell cycle arrest.
-
Cell Line:A549 cells
-
Concentration:0.1 μM, 0.2 μM, 0.5 μM
-
Incubation Time:48 h
-
Result:Significantly and dose-dependently induced apoptosis in A549 cells, especially remarkably increasing the proportion of late apoptotic cells.
-
Cell Line:A549 cells
-
Concentration:0.1 μM, 0.2 μM, 0.5 μM
-
Incubation Time:48 h
-
Result:Significantly elevated the LC3II to LC3I ratio and dose-dependently increased the expression level of p62 protein without notably affecting Beclin-1 expression, indicating the blockade of the autophagic degradation phase.
-
Cell Line:A549 cells
-
Concentration:0.1 μM, 0.2 μM, 0.5 μM, 1 μM
-
Incubation Time:48 h
-
Result:Dose-dependently inhibited the expression of c-MYC, Bcl-2, Bcl-xl, CDK4, and Cyclin D1 proteins, and promoted the cleavage of PARP, without altering the total level of IGF2BP1 protein itself.
In Vivo
IGF2BP1-IN-1 (0.5 mg/kg; i.p.; once daily for the first 6 days, followed by every other day; for 21-23 days) significantly inhibits tumor growth in a BALB/c male nude mouse xenograft model subcutaneously inoculated with A549 cells, without inducing significant changes in body weight or toxic side effects such as ascites. IGF2BP1-IN-1 significantly improves immunohistochemistry (IHC) and H&E staining scores and increased the expression level of the apoptosis-related marker TUNEL[1].
MedChemExpress (MCE) has not independently confirmed the accuracy of these methods. They are for reference only.
-
Animal Model:Naive female C57BL/6J mice, without tumor induction[1]
-
Dosage:0.75 mg/kg
-
Administration:i.p., once daily, for 14 days
-
Result:Demonstrated good biosafety, showing no induction of weight loss or mortality in mice.
-
Animal Model:BALB/c nude mice (male, 14-17 g) were subcutaneously injected of 1 × 10⁷ A549 cells[1]
-
Dosage:0.5 mg/kg
-
Administration:i.p., once daily for the first 6 days, followed by every other day; for 21-23 days
-
Result:Extremely significantly suppressed the volumetric expansion and weight gain of the A549 xenograft tumors in nude mice.
Achieved a remarkably high tumor growth inhibition (TGI) rate of 80%.
Demonstrated good biosafety, showing no induction of weight loss in mice and no toxic side effects.
Markedly increased proportion of cells exhibiting nuclear pyknosis and vacuolation in the treated tumor tissues.
Downregulated the expression level of Ki-67, a marker reflecting cellular proliferative activity in the tumor tissues.
Elevated the positive expression level of TUNEL, an indicator of DNA fragmentation and cell apoptosis in the tumor tissues.
- Detection of Apoptosis
- TUNEL staining for apoptotic DNA fragmentation
- Flow cytometric DNA-content cell-cycle staining
- Annexin V plus membrane-impermeant dye apoptosis staining
- BrdU Incorporation Assay
- Autophagy
- Apoptosis Solutions
- Protocol for Cell Cycle
- Lysosome and acidic-vesicle live-cell staining
- Macroautophagy Solutions


Chemical Information
-
CAS No. 3029447-08-0
-
Appearance Solid
-
Molecular Weight 777.87
-
Formula C42H52FN3O10
-
Color White to off-white
-
SMILES
C[C@]12[C@@]3([H])[C@]([C@@]4([H])C(C(C)(C([C@H](C4)OC(CN5C(N(C6=CC=C(C=C6)F)C=N5)=O)=O)=O)C)=CC3)(C(C[C@@]1([C@@]([C@@H](C2)O)([H])[C@@](C)(O)C(/C=C/C(C)(C)OC(C)=O)=O)C)=O)C
-
Shipping
Room temperature in continental US; may vary elsewhere.
-
Storage
-20°C, protect from light, stored under nitrogen
* In solvent : -80°C, 6 months; -20°C, 1 month (protect from light, stored under nitrogen)


Solvent & Solubility
In Vitro:
DMSO : 100 mg/mL (128.56 mM; Need ultrasonic; Hygroscopic DMSO has a significant impact on the solubility of product, please use newly opened DMSO)
Please refer to the solubility information to select the appropriate solvent. Once prepared, please aliquot and store the solution to prevent product inactivation from repeated freeze-thaw cycles.
Storage method and period of stock solution: -80°C, 6 months; -20°C, 1 month (protect from light, stored under nitrogen). When stored at -80°C, please use it within 6 months. When stored at -20°C, please use it within 1 month.
Please refer to the solubility information to select the appropriate solvent. Once prepared, please aliquot and store the solution to prevent product inactivation from repeated freeze-thaw cycles.
Storage method and period of stock solution: -80°C, 6 months; -20°C, 1 month (protect from light, stored under nitrogen). When stored at -80°C, please use it within 6 months. When stored at -20°C, please use it within 1 month.
Concentration (start) × Volume (start) = Concentration (final) × Volume (final)


Purity & Documentation
-
Data Sheet (282 KB)
-
SDS (252 KB)
- English - EN (252 KB)
- Français - FR (252 KB)
- Deutsch - DE (252 KB)
- Norwegian - NO (252 KB)
- Español - ES (252 KB)
- Swedish - SV (252 KB)
- Italian - IT (252 KB)
- Korean - KR (252 KB)
- Portuguese - PT (252 KB)
-
Handling Instructions (2659 KB)
References


Complete Stock Solution Preparation Table
Please refer to the solubility information to select the appropriate solvent. Once prepared, please aliquot and store the solution to prevent product inactivation from repeated freeze-thaw cycles.
Storage method and period of stock solution: -80°C, 6 months; -20°C, 1 month (protect from light, stored under nitrogen). When stored at -80°C, please use it within 6 months. When stored at -20°C, please use it within 1 month.
| Optional Solvent | Concentration Solvent Mass | 1 mg | 5 mg | 10 mg | 25 mg |
|---|---|---|---|---|---|
| DMSO | 1 mM | 1.2856 mL | 6.4278 mL | 12.8556 mL | 32.1390 mL |
| 5 mM | 0.2571 mL | 1.2856 mL | 2.5711 mL | 6.4278 mL | |
| 10 mM | 0.1286 mL | 0.6428 mL | 1.2856 mL | 3.2139 mL | |
| 15 mM | 0.0857 mL | 0.4285 mL | 0.8570 mL | 2.1426 mL | |
| 20 mM | 0.0643 mL | 0.3214 mL | 0.6428 mL | 1.6070 mL | |
| 25 mM | 0.0514 mL | 0.2571 mL | 0.5142 mL | 1.2856 mL | |
| 30 mM | 0.0429 mL | 0.2143 mL | 0.4285 mL | 1.0713 mL | |
| 40 mM | 0.0321 mL | 0.1607 mL | 0.3214 mL | 0.8035 mL | |
| 50 mM | 0.0257 mL | 0.1286 mL | 0.2571 mL | 0.6428 mL | |
| 60 mM | 0.0214 mL | 0.1071 mL | 0.2143 mL | 0.5357 mL | |
| 80 mM | 0.0161 mL | 0.0803 mL | 0.1607 mL | 0.4017 mL | |
| 100 mM | 0.0129 mL | 0.0643 mL | 0.1286 mL | 0.3214 mL |


IGF2BP1-IN-1 Related Classifications
HY-156110 Related Classifications
 Powered by Bioz