



Vitisin A

Based on 1 Customer Validation
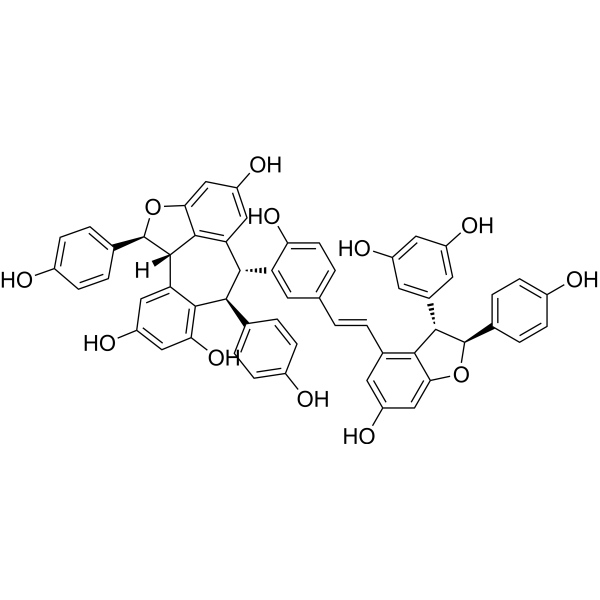
Vitisin A ((+)-Vitisin A) is an orally active natural product with multiple pharmacological activities including anti-inflammatory, anti-tumor, anti-oxidant, anti-pathogenic microorganism, hypoglycemic and lipid-regulating, anti-osteoporotic, neuroprotective and cardiovascular protective effects. Vitisin A exhibits inhibitory effects on human AChE and MAO-B with IC50 values of 1.29 µM and 4.94 µM, respectively. Vitisin A inhibits the ERK, MAPK, NF-κB, STAT1, HMGCR and TRAF6 pathways, downregulates the related phosphorylation and protein expression, while activates the Nrf2/HO-1 pathway and upregulates p21 expression. Vitisin A induces tumor cell apoptosis and cell cycle arrest, inhibits adipogenesis and lipid accumulation, while alleviates oxidative stress, suppresses inflammatory responses, blocks hepatic fibrosis, Cuproptosis and cholesterol synthesis, and increases the expression levels of central BDNF and TrkB. Vitisin A can be used in the research of tumors, infectious diseases, metabolic diseases, bone and joint diseases, liver diseases, skin injuries, as well as neurodegenerative and cognitive dysfunction-related diseases.
For research use only. We do not sell to patients.
- Purity : 97%
- CAS No.: 142449-89-6
- Formula: C56H42O12
- Molecular Weight:906.93
-
Storage:
-20°C, protect from light
* In solvent : -80°C, 6 months; -20°C, 1 month (protect from light)

To place orders, for customer services and technical support, please contact: MedChemExpress USA
Tel: 609-228-6898 E-mail: [email protected] [email protected]


-
 Biological Activity
-
Chemical Information
- Protocols
- Purity & Documentation
- References
-
 Help & FAQs


All Caspase Isoforms
More

Biological Activity
Description
|
Caspase 3 |
ERK1 |
ERK2 |
NF-κB |
PPAR-γ |
MAO-B |
Cellular Effect
|
Cell Line

|
Type | Value | Description | References |
|---|---|---|---|---|
| A549 | CC50 |
22.4 μM
Compound: (+)-Vitisin A
|
Cytotoxicity against human A549 cells assessed as reduction in cell viability by Alamar blue assay
Cytotoxicity against human A549 cells assessed as reduction in cell viability by Alamar blue assay
|
[PMID: 32652408] |
| Huh-7.5 | CC50 |
>10 μM
Compound: (+)-Vitisin A
|
Cytotoxicity against human Huh7.5 cells infected with Hepatitis C virus assessed as reduction in cell viability
Cytotoxicity against human Huh7.5 cells infected with Hepatitis C virus assessed as reduction in cell viability
|
[PMID: 32652408] |
| Platelet | IC50 |
10.3 μM
Compound: (+)-vitisin A
|
Antiplatelet activity against citreated rabbit platelet assessed as arachidonic acid-induced platelet aggregation
Antiplatelet activity against citreated rabbit platelet assessed as arachidonic acid-induced platelet aggregation
|
[PMID: 15730246] |
| Platelet | IC50 |
13.3 μM
Compound: (+)-vitisin A
|
Antiplatelet activity against citreated rabbit platelet assessed as inhibition of 9,11-dideoxy-11 alpha, 9 alpha epoxy-methanoprostaglandin F2alpha-induced platelet aggregation
Antiplatelet activity against citreated rabbit platelet assessed as inhibition of 9,11-dideoxy-11 alpha, 9 alpha epoxy-methanoprostaglandin F2alpha-induced platelet aggregation
|
[PMID: 15730246] |
In Vitro
Vitisin A exhibits antioxidant activity via free radical scavenging and iron reduction, with FRAP and DPPH values of 2.38 mM Trolox/g phenol and 1.24 mM Trolox/g phenol, respectively[1].
Vitisin A is highly cytotoxic to human cancer cell lines, with an IC50 of 1.11 μM against MES-SA cells, and induces apoptosis via sub-G1 cell cycle arrest[1].
Vitisin A induces G2/M phase cell cycle arrest and apoptosis in HepG2 human hepatocellular carcinoma cells via increased ROS, caspase 3 activity, and modified Bax/Bcl-2 ratios, but has no effect on Hep3B cells[1].
Vitisin A (4, 8 μM; 24 h) acts as a TRAIL sensitizer in PC-3, DU145, and LNCaP human prostate cancer cells by upregulating DR5 expression and inducing ROS generation, enhancing TRAIL-mediated apoptosis[1].
Vitisin A inhibits influenza A virus-induced RANTES production in A549 human alveolar epithelial cells by modulating Akt and STAT1 phosphorylation[1].
Vitisin A inhibits preadipocyte proliferation and differentiation by inducing G1 phase arrest and regulating p21, PPARγ, and C/EBPα expression, supporting anti-obesity activity[1].
Vitisin A exerts hypocholesterolemic effects by regulating LDLR, HMG-CoA reductase, and PCSK9, and reduces triglyceride levels in HepG2 cells via modulation of lipogenesis and fatty acid oxidation pathways[1].
Vitisin A inhibits osteoclast differentiation in RAW264.7 mouse macrophage cells and primary mouse bone marrow cells by targeting TRAF6-TAK1-NFATc1 signaling, supporting antiosteoporotic activity[1].
Vitisin A enhances viability of H2O2-exposed SH-SY5Y human neuronal cells and provides partial protection against glutamate-induced neurotoxicity in primary rat cortical cells at 10 μM[1].
Vitisin A inhibits androgen receptor activity and protects human dermal papilla cells from DHT-induced damage, supporting potential use in treating androgenetic alopecia[1].
Vitisin A exhibits antifungal activity against Plasmopara viticola[1].
Vitisin A (0-10 nM; 0-24 h) dose-dependently and time-dependently restores cell viability in TGF-β1-activated LX-2 cells[2].
Vitisin A attenuates ES-Cu-induced cytotoxicity in TGF-β1-activated LX-2 cells[2].
Vitisin A can inhibit fibrosis, copper death, lipid synthesis, and oxidative stress in TGF-β1-activated LX-2 cells in a dose-dependent manner by upregulating the Nrf2/HO-1 signaling pathway; and these effects can be eliminated by knocking down Nrf2 with siRNA, confirming that the Nrf2/HO-1 pathway is a key mediator[2].
Vitisin A (1-10 μM; 8 days) potently inhibits 3T3-L1 preadipocyte differentiation with an IC50 of 5.0 μM, reducing lipid accumulation in a dose-dependent manner[3].
Vitisin A (1-10 μM; 8 days) dose-dependently reduces PPARγ and C/EBPα protein expression in differentiated 3T3-L1 cells[3].
Vitisin A (1-10 μM; 24 h) weakly but significantly inhibits Rosiglitazone (HY-17386)-induced PPARγ transcriptional activity in transiently transfected COS-7 cells[3].
Vitisin A (5-10 μM; 24-48 h) significantly inhibits differentiation medium-induced proliferation of 3T3-L1 preadipocytes, reducing proliferation to near growth-arrested levels[3].
Vitisin A (1-50 μM; 24 h) is non-cytotoxic to 3T3-L1 preadipocytes at concentrations up to 25 μM, with cytotoxicity only detected at 50 μM[3].
Vitisin A (10 μM; 0-2 days, 2-5 days, 5-8 days, or 0-8 days) primarily inhibits 3T3-L1 adipocyte differentiation by targeting the preadipocyte proliferation stage during the first 2 days of adipogenic induction, with minimal effect when administered after this period[3].
Vitisin A (5-10 μM; 24 hours) blocks 3T3-L1 preadipocyte cell cycle progression at the G1-S transition, maintaining cells in the G0/G1 phase similar to non-differentiated growth-arrested cells[3].
Vitisin A (1-10 μM; 6-24 hours) dose-dependently reduces cyclin A and cyclin B expression, delays CDK2 expression, and does not affect cyclin E expression in differentiation-induced 3T3-L1 preadipocytes, supporting G1 phase cell cycle arrest[3].
Vitisin A (1-10 μM; 0.25-3 hours, 24 hours) modulates mitotic regulation in differentiation-induced 3T3-L1 preadipocytes by restoring p21 expression and reducing Rb phosphorylation[3].
Vitisin A (1-10 μM; 24 h) dose-dependently inhibits LPS-induced NO production in RAW 264.7 macrophage cells[4].
Vitisin A (1-10 μM; 8 h) dose-dependently inhibits LPS-induced iNOS expression in RAW 264.7 macrophage cells[4].
Vitisin A (1-10 μM; 20 min) dose-dependently inhibits LPS-induced ERK1/2 and p38 phosphorylation in RAW 264.7 macrophage cells[4].
Vitisin A (10 μM; 15 min) inhibits LPS-induced NF-κB activation in RAW 264.7 macrophage cells by suppressing IκB-α phosphorylation and degradation[4].
Vitisin A potently inhibits recombinant human AChE with an IC50 of 1.29 μM[5].
Vitisin A potently inhibits recombinant human MAO-B with an IC50 of 4.94 μM[5].
Vitisin A (2.5-20 μM; 24 h pre-treatment) significantly protects human SH-SY5Y neuroblastoma cells against MGO-induced cell death[5].
MedChemExpress (MCE) has not independently confirmed the accuracy of these methods. They are for reference only. Further protocols information, click here.
-
Cell Line:Human prostate cancer cell lines (PC-3, DU145, LNCaP)
-
Concentration:4, 8 μM (combined with 20, 40 ng/mL TRAIL)
-
Incubation Time:24 h
-
Result:Enhanced cytotoxicity and sub-G1 accumulation in PC-3, DU145, and LNCaP cells with TRAIL, most potently in PC-3 cells.
Upregulated caspase 3, FADD, DR4, and DR5 expression when combined with TRAIL.
Downregulated pro-caspase 7/8, DcR1, Bcl-XL, and Bcl-2 expression with TRAIL combination.
Elevated DR5 promoter activity, cell-surface DR5, and ROS production with TRAIL.
Induced PARP cleavage when combined with TRAIL.
-
Cell Line:TGF-β1-activated human hepatic stellate cell line LX-2
-
Concentration:0, 2.5, 5.0, 7.5, 10 nM
-
Incubation Time:0, 2, 4, 6, 8, 12, 24 h
-
Result:Restored cell viability in a dose-dependent manner with increasing viability from 0 to 10 nM.
Restored cell viability in a time-dependent manner with increasing viability from 0 to 24 h incubation.
-
Cell Line:3T3-L1 preadipocytes
-
Concentration:1, 5, 10 μM
-
Incubation Time:8 days
-
Result:Inhibited 3T3-L1 adipocyte differentiation in a dose-dependent manner.
Reduced relative lipid content to ~70% at 1 μM, ~35% at 5 μM, and nearly 0% at 10 μM relative to untreated control.
Almost completely suppressed differentiation at 10 μM.
Showed an IC50 of 5.0 μM for adipocyte differentiation inhibition.
-
Cell Line:differentiated 3T3-L1 cells
-
Concentration:1, 5, 10 μM
-
Incubation Time:8 days
-
Result:Reduced the expression of PPARγ and C/EBPα, key adipogenic transcription factors.
Lowered protein levels of both factors at 1 μM.
-
Cell Line:3T3-L1 preadipocytes
-
Concentration:5, 10 μM
-
Incubation Time:24, 48 hours
-
Result:Significantly inhibited differentiation medium-induced mitosis of 3T3-L1 preadipocytes, reducing proliferation nearly to the level of normal growth-arrested cells.
Suppressed proliferation at both 5 and 10 μM, with no significant difference between the two concentrations at 24 and 48 hours.
-
Cell Line:3T3-L1 preadipocytes
-
Concentration:1, 5, 10, 25, 50 μM
-
Incubation Time:24 hours
-
Result:Showed no cytotoxicity at concentrations up to 25 μM, as released LDH remained at control levels.
Increased released LDH to ~140% of the control at 50 μM, indicating cytotoxicity.
-
Cell Line:3T3-L1 preadipocytes
-
Concentration:10 μM
-
Incubation Time:0-2 days, 2-5 days, 5-8 days, or 0-8 days
-
Result:Reduced relative lipid content to 2.7% of the control when applied during days 0-2, nearly equivalent to the effect of continuous treatment over 8 days (1.6% of control).
Resulted in much weaker inhibition when applied from days 2-5 or 5-8, with relative lipid contents of 70.4% and 72.8% of the control, respectively.
-
Cell Line:differentiation-induced 3T3-L1 preadipocytes
-
Concentration:5, 10 μM
-
Incubation Time:24 hours
-
Result:Blocked differentiation medium-induced cell cycle progression at the G1-S transition.
Maintained 84.0% of cells in G0/G1 phase at 5 μM, with 7.7% in S phase and 7.9% in G2/M phase.
Maintained 89.6% of cells in G0/G1 phase at 10 μM, with 6.6% in S phase and 3.8% in G2/M phase.
-
Cell Line:differentiation-induced 3T3-L1 preadipocytes
-
Concentration:1, 5, 10 μM
-
Incubation Time:6, 12, 18, 24 hours
-
Result:Dose-dependently repressed the differentiation medium-induced increase in cyclin A and cyclin B expression.
Significantly reduced cyclin A and B levels at 10 μM starting at 12-18 hours post-induction.
Delayed CDK2 expression, while cyclin E expression was unaffected.
-
Cell Line:differentiation-induced 3T3-L1 preadipocytes
-
Concentration:1, 5, 10 μM
-
Incubation Time:0.25, 0.5, 1, 2, 3 hours; 24 hours
-
Result:Did not affect ERK or Akt phosphorylation at any tested time point.
Restored the differentiation-induced decrease in p21 expression in a dose-dependent manner.
Reduced differentiation-induced phosphorylation of retinoblastoma protein (Rb) at Ser780 in a dose-dependent manner.
-
Cell Line:RAW 264.7 macrophage cells
-
Concentration:1, 5, 10 μM (8 h incubation after LPS stimulation); 10 μM (non-LPS-treated cells)
-
Incubation Time:8 h (after LPS stimulation); 30 min (pre-incubation with vitisin A prior to LPS treatment)
-
Result:Dose-dependently inhibited LPS-induced iNOS expression, with significant suppression observed at all tested concentrations relative to LPS-only treated cells.
-
Cell Line:RAW 264.7 macrophage cells
-
Concentration:1, 5, 10 μM (20 min incubation after LPS stimulation); 10 μM (non-LPS-treated cells)
-
Incubation Time:20 min (after LPS stimulation); 30 min (pre-incubation with vitisin A prior to LPS treatment)
-
Result:Dose-dependently inhibited LPS-induced ERK1/2 and p38 phosphorylation.
Completely blocked LPS-induced ERK1/2 and p38 phosphorylation at 10 µM.
-
Cell Line:RAW 264.7 macrophage cells
-
Concentration:10 μM (15 min incubation after LPS stimulation); 10 μM (non-LPS-treated cells)
-
Incubation Time:15 min (after LPS stimulation); 30 min (pre-incubation with vitisin A prior to LPS treatment)
-
Result:Significantly suppressed LPS-induced IκB-α degradation and reduced LPS-induced IκB-α phosphorylation, relative to LPS-only treated cells.
-
Cell Line:human SH-SY5Y neuroblastoma cells
-
Concentration:2.5, 5, 10, 20 μM
-
Incubation Time:24 h (pre-treatment)
-
Result:Significantly elevated cell viability compared to the MGO-only control , showing robust neuroprotective effects.
In Vivo
Vitisin A (central administration) restores cognitive function and hippocampal synaptic plasticity in scopolamine-treated C57BL/6 mice via activation of BDNF-CREB signaling[1].
Vitisin A (topical application) protects against DHT-induced androgenetic alopecia in mice by preserving hair follicle structure and regulating Wnt/β-catenin signaling[1].
Vitisin A (100 mg/kg; dietary intake) reduces body weight gain and plasma triglycerides in high-fat diet-fed mice by modulating hepatic lipid metabolism pathways[1].
Vitisin A reduces body weight and improves plasma lipid profiles[1].
Vitisin A (i.p.) dose-dependently inhibits liver fibrosis in CCl4-induced mice by activating the Nrf2/HO-1 pathway and suppressing cuproptosis, lipid peroxidation, and hepatic stellate cell activation[2].
Vitisin A (40 mg/kg; p.o.; daily; 13 days) significantly improves scopolamine-induced amnesia in male ICR mice, as shown by increased retention trial step-through latency, reduced brain AChE activity and oxidative stress, and restored BDNF/TrkB protein expression[5].
Vitisin A (10 mg/kg; p.o.; single dose) significantly reduces systolic and diastolic blood pressure in spontaneously hypertensive rats, with peak effects observed at 8 hours post-treatment[5].
Vitisin A (25 mg/kg; p.o.; daily; 36 days) reduces weight gain and improves obesity-related plasma lipid parameters in high-fat diet-fed C57BL/6 mice[5].
MedChemExpress (MCE) has not independently confirmed the accuracy of these methods. They are for reference only.
-
Animal Model:ICR mice (scopolamine-induced amnesia)[1]
-
Dosage:40 mg/kg
-
Administration:single administration
-
Result:Significantly improved impaired learning behaviors in scopolamine-treated mice.
Decreased acetylcholinesterase activity and malondialdehyde levels in brain extracts.
Increased expression of brain-derived neurotrophic factor and its receptor tropomyosin receptor kinase B.
Enhanced expression of synaptic plasticity proteins synapsin I, calcium/calmodulin-dependent protein kinase II, and Akt.
-
Animal Model:ICR (6-week-old male, scopolamine-induced amnesia)[5]
-
Dosage:40 mg/kg
-
Administration:p.o.; daily; 13 days
-
Result:Increased step-through latency in the retention trial of the passive avoidance test compared with scopolamine-treated control mice.
Reduced acetylcholinesterase (AChE) activity and malondialdehyde (MDA) levels in brain tissue extracts compared with the control group.
Restored protein expressions of brain-derived neurotrophic factor (BDNF; BDNF/β-actin = 1.25) and its receptor tropomyosin receptor kinase B (TrkB; TrkB/β-actin = 1.16) from scopolamine-induced decreases.
-
Animal Model:C57BL/6 (high-fat diet-induced obesity)[5]
-
Dosage:25 mg/kg
-
Administration:p.o.; daily; 36 days
-
Result:Reduced weight gain in high-fat diet-fed mice.
Improved plasma cardiovascular risk parameters, including reduced total cholesterol, total triglycerides, low-density lipoproteins, and free fatty acids.


Chemical Information
-
CAS No. 142449-89-6
-
Appearance Solid
-
Molecular Weight 906.93
-
Formula C56H42O12
-
Color Brown to black
-
SMILES
OC1=CC2=C(C3=C1)[C@]([C@@H](C(C=C4)=CC=C4O)O3)([H])C5=CC(O)=CC(O)=C5[C@H](C(C=C6)=CC=C6O)[C@H]2C7=CC(/C=C/C8=C9[C@H](C%10=CC(O)=CC(O)=C%10)[C@@H](C(C=C%11)=CC=C%11O)OC9=CC(O)=C8)=CC=C7O
-
Synonyms
(+)-Vitisin A
-
Structure Classification
-
Initial Source
-
Shipping
Room temperature in continental US; may vary elsewhere.
-
Storage
-20°C, protect from light
* In solvent : -80°C, 6 months; -20°C, 1 month (protect from light)

Protocols
-
Western Blot
Western blotting (WB) is a commonly used experimental method in molecular biology, biochemistry, and immunogenetics for identifying and quantifying target proteins. It combines gel electrophoresis with immunoassay, enabling researchers to analyze protein expression, post-translational modifications, and molecular weight.
-
RNA extraction experimental
By lysing cells, releasing RNA, and removing impurities such as proteins and DNA, high-purity RNA products are finally obtained. The commonly used traditional method is the guanidine isothiocyanate/phenol/chloroform method (Trizol), which is suitable for a variety of animal materials including animal tissues, microorganisms, cultured cells, etc., and most plant materials.
-
Collagen: Sirius Red Staining
Sirius Red or picrosirius red staining is a histochemical method for visualizing collagen-rich extracellular matrix in tissue sections, and collagen fibers are detected as red-stained structures under bright-field microscopy with enhanced birefringence under polarized light. Picrosirius red is useful for assessing total collagen organization, distribution, and fibrosis burden, but polarized color should not be interpreted as a definitive collagen type I versus type III readout because color is affected by fiber orientation, thickness, and packing.
-
Annexin V plus membrane-impermeant dye apoptosis staining
Annexin V-based apoptosis assays rely on the detection of phosphatidylserine (PS) externalization from the inner leaflet of the plasma membrane to the outer leaflet, an early biochemical hallmark of apoptosis. Fluorescently labeled Annexin V binds PS in a calcium-dependent manner, enabling identification of early apoptotic cells by flow cytometry or fluorescence microscopy. When combined with a membrane-impermeant DNA-binding dye (e. g. , propidium iodide), this approach allows discrimination between viable (Annexin V−/dye−), early apoptotic (Annexin V+/dye−), and late apoptotic or necrotic (Annexin V+/dye+) cell populations by assessing membrane integrity and PS exposure.
-
BrdU Incorporation Assay
Bromodeoxyuridine (BrdU) incorporation assay is based on the principle that BrdU, a thymidine analog, is incorporated into newly synthesized DNA during the S phase of the cell cycle, thereby serving as a marker of DNA replication and cellular proliferation. Incorporated BrdU can be detected using anti-BrdU antibodies following DNA denaturation, enabling visualization or quantification of proliferating cells through immunochemical detection methods such as immunofluorescence or immunohistochemistry.
-
ROS/oxidative-stress fluorescent staining
ROS/oxidative-stress fluorescent staining uses cell-permeant fluorogenic probes that become fluorescent after oxidation inside cells or tissues; commonly used examples include DCFH-DA/DCFDA for broad cellular oxidant detection, DHE for superoxide-related signal detection, MitoSOX for mitochondrial superoxide-related signal detection, and CellROX probes for oxidative-stress-associated fluorescence readouts. The assay detects probe oxidation rather than a single ROS species unless the probe and analysis method have been chemically validated for that species. DCFH-DA enters cells, is deacetylated by intracellular esterases to DCFH, and produces fluorescent DCF after oxidation, so the readout is used as an operational measure of total cellular oxidative stress rather than a species-specific ROS measurement. DHE and MitoSOX can report superoxide-related oxidation, but red fluorescence alone can include non-specific ethidium-like oxidation products; HPLC or optimized spectral approaches are
-
Connective Tissue: Masson's Trichrome/Collagen Trichrome Staining
Masson’s Trichrome (collagen/trichrome staining) is a histological technique that differentially stains tissue compartments using sequential acidic dyes to distinguish collagen from muscle and cytoplasmic components based on dye affinity and tissue permeability differences, enabling visualization of fibrosis and connective tissue architecture in histological sections. The classical formulation typically uses Weigert's iron hematoxylin for nuclear staining, Biebrich scarlet-acid fuchsin for cytoplasm and muscle, and aniline blue (or light green variants) for collagen, producing a characteristic blue/green collagen signal contrasted against red cytoplasm and dark nuclei. The staining principle relies on selective displacement of smaller dye molecules by larger anionic dyes in collagen-rich regions under controlled acidified conditions, which enhances collagen-specific dye retention. This property makes the method widely used for fibrosis assessment in organs such as heart, liver, lung, a
-
Protocol for Cell Cycle
Cell-cycle analysis by flow cytometry measures DNA content in single cells to estimate the fraction of cells in G0/G1, S, and G2/M phases. Propidium iodide intercalates into DNA, and after RNA removal with RNase, fluorescence intensity reflects cellular DNA content: 2N cells are assigned to G0/G1, cells between 2N and 4N to S phase, and 4N cells to G2/M. DNA-content analysis alone cannot reliably separate G0 from G1 or G2 from M. Ki-67 can distinguish quiescent G0 cells from cycling cells, EdU or BrdU incorporation marks active DNA synthesis in S phase, and phospho-histone H3 staining identifies mitotic cells within the 4N population.
-
Research Protocol for Inflammation-related Diseases
The NLRP3 inflammasome is a cytosolic innate immune signaling platform that integrates priming signals and danger-signal activation to promote caspase-1 activation, maturation of IL-1β and IL-18, and gasdermin D-mediated pyroptotic cell death. The core experimental logic is to determine whether inflammatory disease phenotypes are driven by increased NLRP3 expression, ASC-containing inflammasome assembly, caspase-1 cleavage, GSDMD cleavage, and extracellular release of IL-1β/IL-18 rather than by nonspecific cell injury alone. The pathway is strongly linked to inflammation-related disease phenotypes because monosodium urate crystals activate NALP3/NLRP3 inflammasome signaling in gout-like crystal inflammation, cholesterol crystals activate NLRP3 inflammasomes in atherogenesis models, and DSS-induced intestinal inflammation has been reported to involve NLRP3 inflammasome activity. However, experimental colitis studies also show context-dependent protective effects of NLRP3 inflammasome co
-
Protocol For Protein Expression And Purification
Recombinant protein expression in Escherichia coli followed by purification of a His-tagged soluble protein by immobilized metal affinity chromatography (IMAC), with optional MBP fusion and TEV tag removal when the construct includes these elements. The biological readout is production of the encoded target protein, detected as an inducible band at the expected molecular mass by SDS-PAGE and quantified by total protein assay or chromatographic absorbance; the purification readout is enrichment of the target protein in elution fractions after selective binding of polyhistidine residues to immobilized Ni2+/metal-chelate resin and elution by imidazole-containing buffer. Expression is driven by an inducible bacterial expression system, commonly T7/lac-based, in which IPTG or lactose/auto-induction activates transcription and translation of the cloned gene; lower induction temperature, lower inducer concentration, induction timing, and solubility-enhancing fusion tags can influence the frac
-
Kinase activity and phosphorylation assays
Kinase activity assays measure the ability of kinases to transfer phosphate groups from ATP to specific substrates, while phosphorylation assays detect the presence and levels of phosphorylated proteins. Common methods include radiolabeled ATP incorporation (e. g. ,), ADP release detection via bioluminescence (e. g. ,[3]), enzyme-linked immunosorbent assays (ELISA) for phospho-specific epitopes (e. g. ,[6]), and microtiter-based formats for high-throughput screening (e. g. ,[8]). The ADP-Glo assay quantifies kinase activity by measuring ADP produced during phosphorylation using a luciferase-based system. Radiometric assays involve autoradiography or scintillation counting after incorporation of 32P-labeled ATP into substrate proteins. ELISA-based approaches rely on phospho-specific antibodies to detect activated kinases in cell lysates or purified samples.
-
Fibrosis/Collagen Morphometry
Fibrosis and collagen morphometry is based on the quantitative visualization of fibrillar collagen deposition in tissue sections using histochemical stains such as Sirius Red (Picrosirius Red) or Masson's trichrome, followed by image-based or polarization-enhanced analysis to estimate collagen proportional area as a surrogate of extracellular matrix accumulation during fibrotic remodeling. Sirius Red combined with polarized light microscopy enhances detection of collagen fibers due to birefringence properties, enabling more specific visualization of collagen type I and III fibrils compared to conventional bright-field histology, while whole-section or region-restricted digital morphometry reduces field-selection bias in fibrosis assessment. Alternative quantitative approaches include second harmonic generation (SHG) and two-photon excited fluorescence microscopy, which enable label-free detection of fibrillar collagen and have been validated against histological staining and biochemica
-
3T3-L1 preadipocyte-to-adipocyte differentiation
3T3-L1 preadipocytes are induced to differentiate after growth arrest using adipogenic media containing insulin, dexamethasone, and IBMX; differentiation is assessed by lipid-droplet accumulation, triglyceride increase, Oil Red O staining, and adipocyte-marker induction such as PPARγ and C/EBPα.
-
Apoptosis
Apoptosis, also called programmed cell death, is generally characterized by distinct morphological characteristics.
-
TUNEL staining for apoptotic DNA fragmentation
TUNEL staining detects DNA strand breaks by using terminal deoxynucleotidyl transferase to add labeled nucleotides to exposed 3′-OH DNA termini, generating either microscopic staining in fixed cells or tissue sections, or fluorescence/cytometric signal in cell suspensions. TUNEL positivity reflects DNA fragmentation but should not be interpreted alone as definitive apoptosis, because TUNEL can also label necrotic, autolytic, mechanically damaged, or DNA-repair-associated DNA breaks.
-
Cell Cytotoxicity Assay
Cytotoxicity assays are usually based on the assessment of cell membrane damage, which can also be indirectly detected by measuring cell viability. Detection methods include MTT assay, CKK-8 assay, LDH assay and ATP assay, etc.
-
Flow cytometric DNA-content cell-cycle staining
Flow cytometric DNA-content cell-cycle staining measures the fluorescence intensity of DNA-bound fluorochromes in single cells or nuclei to estimate DNA content distributions, allowing assignment of populations to G0/G1, S, and G2/M phases by DNA histogram deconvolution. Propidium iodide (PI) intercalates into DNA, and PI fluorescence is proportional to cellular DNA content when staining is performed under conditions that make DNA accessible and minimize non-DNA signal. Cells with G2/M DNA content are expected to show approximately twice the fluorescence intensity of G0/G1 cells, while S-phase cells occupy intermediate fluorescence values. PI-based DNA-content analysis can also detect cells with fractional DNA content, often reported as sub-G1, when DNA fragmentation and extraction during staining reduce retained DNA signal in apoptotic cells. DAPI is an alternative DNA fluorochrome for univariate DNA-content analysis, while bivariate approaches combining DNA content with proliferation
-
Apoptosis Solutions
Apoptosis is a regulated, generally non-lytic cell-death pathway that removes unwanted, damaged, infected, or abnormal cells through coordinated morphological changes, caspase activation, DNA fragmentation, and membrane remodeling. The intrinsic apoptosis pathway is controlled mainly by mitochondrial outer membrane permeabilization, BCL-2 family proteins, cytochrome c release, apoptosome formation, caspase-9 activation, and downstream executioner caspase-3/7 activation. The extrinsic apoptosis pathway is initiated by death receptors such as Fas, TNFR, and TRAIL receptors, which recruit adaptor proteins and activate caspase-8 before engaging executioner caspases or mitochondrial amplification through BID cleavage. Apoptosis is linked to many phenotypes, including cancer cell killing, tissue homeostasis, immune regulation, neurodegeneration, infection response, and treatment-induced cytotoxicity; unresolved questions include how apoptosis interacts with necroptosis, pyroptosis, ferroptos
-
Protocol for Kinase activity and phosphorylation assays
Kinase activity assays measure transfer of phosphate from ATP to a protein or peptide substrate, generating phosphorylated substrate, ADP, or incorporated radiolabeled phosphate as the readout; phosphorylation assays measure site-specific phosphorylation in cells or tissues as a proxy for kinase-pathway activation, inhibition, or substrate regulation. Phosphorylation can be detected by phospho-specific Western blot, immunoprecipitation kinase assay, phospho-immunofluorescence, phospho-flow cytometry, luminescent ADP detection, radiolabeled ATP incorporation, or reporter-based pathway assays, and these readouts can be applied to cancer cells, primary neurons, mouse tumors, organoids, inflammatory macrophages, ferroptosis studies, and mitophagy studies when the kinase target is biologically relevant.
-
Cuproptosis Solutions
Cuproptosis is a copper-dependent regulated cell-death pathway in which intracellular copper binds lipoylated tricarboxylic acid cycle proteins, especially DLAT-containing pyruvate dehydrogenase complex components, causing lipoylated protein aggregation, iron-sulfur cluster protein loss, proteotoxic stress, and cell death. The pathway is functionally linked to mitochondrial respiration because copper-ionophore sensitivity is higher in cells dependent on oxidative phosphorylation, and FDX1 and protein lipoylation machinery are required for copper-ionophore-induced death. Elesclomol-Cu and related copper-loading strategies are widely used experimental tools to induce cuproptosis, whereas copper chelation with tetrathiomolybdate or genetic suppression of FDX1, LIAS, LIPT1, or DLAT can test pathway dependence. The major unresolved questions are how disease context determines cuproptosis sensitivity, how copper transporters such as SLC31A1/CTR1 and ATP7A/ATP7B regulate the pathway, and whic
-
Lipid Droplets: Oil Red O/Sudan Dye Lipid Staining
Lipid droplets are intracellular organelles with a neutral-lipid core that stores triacylglycerols and sterol esters, and Oil Red O or Sudan dyes detect these hydrophobic lipid deposits by partitioning into retained lipids in fresh or frozen specimens. Oil Red O stains neutral triglycerides and lipids in frozen tissue sections or air-dried cytologic preparations, while Sudan Black B has also been used as a histochemical fat stain for lipid-rich tissue structures.


Purity & Documentation
-
Data Sheet (304 KB)
-
SDS (252 KB)
- English - EN (252 KB)
- Français - FR (252 KB)
- Deutsch - DE (252 KB)
- Norwegian - NO (252 KB)
- Español - ES (252 KB)
- Swedish - SV (252 KB)
- Italian - IT (252 KB)
- Korean - KR (252 KB)
- Portuguese - PT (252 KB)
-
Handling Instructions (2659 KB)
References
[2]. Ding S, et al. Vitisin A inhibits liver fibrosis by promoting Nrf2/HO-1 pathway and inhibiting Cuproptosis. Sci Rep. 2025;15(1):44186. Published 2025 Dec 19. [Content Brief]
[4]. Mi Jeong Sung, et al. Vitisin A suppresses LPS-induced NO production by inhibiting ERK, p38, and NF-kappaB activation in RAW 264.7 cells. Int Immunopharmacol. 2009;9(3):319-323. [Content Brief]
[5]. Chen LG, et al. Vitisin A, a Resveratrol Tetramer, Improves Scopolamine-Induced Impaired Learning and Memory Functions in Amnesiac ICR Mice. Biomedicines. 2022;10(2):273. Published 2022 Jan 26. [Content Brief]

Calculators
Concentration (start) × Volume (start) = Concentration (final) × Volume (final)


Vitisin A Related Classifications
HY-142026 Related Classifications
 Powered by Bioz
Keywords
- Vitisin A
- 142449-89-6
- (+)-Vitisin A
- Caspase
- ERK
- NF-κB
- Influenza Virus
- PAK
- LDLR
- PPAR
- PCSK9
- Androgen Receptor
- Keap1-Nrf2
- Monoamine Oxidase
- Cholinesterase (ChE)
- IKK
- Wnt
- β-catenin
- Reactive Oxygen Species (ROS)
- Apoptosis
- Cuproptosis
- AChE
- HMGCR
- MAO-B
- Vitis thunbergii Sieb. & Zucc.
- STAT1
- Vitis thunbergii var. taiwaniana
- TRAF6
- Nrf2/HO-1
- MAPK
- Inhibitor
- inhibitor
- inhibit