



Pectolinarigenin
Based on 2 publication(s) in Google Scholar
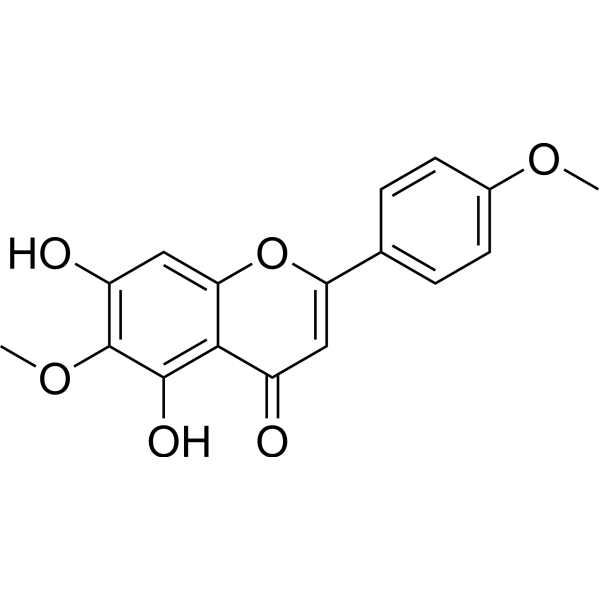
Pectolinarigenin is an orally active dual inhibitor of COX-2/5-LOX with anti-inflammatory, antioxidant, antitumor and neuroprotective activities. Pectolinarigenin exerts neuroprotective and anti-inflammatory effects on astrocyte inflammation via the NFκB and MAPK pathways. Pectolinarigenin inhibits LPS-induced phosphorylation of ERK1/2, N-FκB and p38MAPK, directly inhibits the enzymatic activity or binding of COX-2, 5-LOX and HIF-1α, and reduces the level of XIAP. Pectolinarigenin modifies Keap1 to promote nuclear accumulation of Nrf2, induces ARE-mediated antioxidant enzyme expression, and possesses direct free radical scavenging activity. Pectolinarigenin reduces the release of NO, proinflammatory mediators and leukotrienes, and increases the level of IL-10. Pectolinarigenin induces G2/M cell cycle arrest, apoptosis (Apoptosis) and autophagy (Autophagy) via the PI3K/AKT/mTOR signaling pathway. Pectolinarigenin reduces renal crystal deposition and inhibits melanin synthesis. Pectolinarigenin inhibits inflammation and alleviates allergy in mouse models of inflammation. Pectolinarigenin alleviates renal injury, inflammation and oxidative stress in mice by inhibiting HIF-1α activity. Pectolinarigenin can be used for the research of neurodegenerative diseases, inflammatory/allergic diseases, calcium oxalate nephrocalcinosis, gastric cancer, melasma, post-inflammatory diseases and chloasma.
For research use only. We do not sell to patients.
- Purity : 99.98%
- CAS No.: 520-12-7
- Formula: C17H14O6
- Molecular Weight:314.29
-
Storage:
4°C, protect from light
* In solvent : -80°C, 6 months; -20°C, 1 month (protect from light)

To place orders, for customer services and technical support, please contact: MedChemExpress USA
Tel: 609-228-6898 E-mail: [email protected] [email protected]


-
 Biological Activity
-
Chemical Information
-
Solvent & Solubility
- Protocols
- Purity & Documentation
- References
-
 Help & FAQs



Publications Citing Use of MedChemExpress (MCE) Pectolinarigenin
More Customer Validation & Images

-
Histological Imaging/Staining
-
IF
-
WB
-
Cell Proliferation/Viability Assay
-
Apoptosis Analysis


Biological Activity
Description
IC50 & Target
|
COX-2 |
5-LOX |
Cellular Effect
|
Cell Line

|
Type | Value | Description | References |
|---|---|---|---|---|
| A-375 | IC50 |
8.2 μM
Compound: 2
|
Antiproliferative activity against human A375 cells after 48 hrs by sulforhodamine B assay
Antiproliferative activity against human A375 cells after 48 hrs by sulforhodamine B assay
|
[PMID: 18818071] |
| A549 | IC50 |
5.6 μM
Compound: 2
|
Antiproliferative activity against human A549 cells after 48 hrs by sulforhodamine B assay
Antiproliferative activity against human A549 cells after 48 hrs by sulforhodamine B assay
|
[PMID: 18818071] |
| ACHN | IC50 |
15.2 μM
Compound: 2
|
Antiproliferative activity against human ACHN cells after 48 hrs by sulforhodamine B assay
Antiproliferative activity against human ACHN cells after 48 hrs by sulforhodamine B assay
|
[PMID: 18818071] |
| ACHN | IC50 |
15.23 μM
Compound: Pectolinarigenin
|
In vitro inhibitory concentration against renal adenocarcinoma cell line (ACHN) in the presence of taxol
In vitro inhibitory concentration against renal adenocarcinoma cell line (ACHN) in the presence of taxol
|
[PMID: 16125932] |
| C32 | IC50 |
7 μM
Compound: 2
|
Antiproliferative activity against human C32 cells after 48 hrs by sulforhodamine B assay
Antiproliferative activity against human C32 cells after 48 hrs by sulforhodamine B assay
|
[PMID: 18818071] |
| Caco-2 | IC50 |
5.3 μM
Compound: 2
|
Antiproliferative activity against human Caco-2 cells after 48 hrs by sulforhodamine B assay
Antiproliferative activity against human Caco-2 cells after 48 hrs by sulforhodamine B assay
|
[PMID: 18818071] |
| COR-L23 | IC50 |
4.07 μM
Compound: Pectolinarigenin
|
In vitro inhibitory concentration against human carcinoma COR-L23 cells in the presence of vinblastine sulfate salt
In vitro inhibitory concentration against human carcinoma COR-L23 cells in the presence of vinblastine sulfate salt
|
[PMID: 16125932] |
| COR-L23 | IC50 |
4.1 μM
Compound: 2
|
Antiproliferative activity against human COR-L23 cells after 48 hrs by sulforhodamine B assay
Antiproliferative activity against human COR-L23 cells after 48 hrs by sulforhodamine B assay
|
[PMID: 18818071] |
| HepG2 | IC50 |
18.1 μM
Compound: 2
|
Cytotoxicity against human HepG2 cells after 72 hrs by MTT assay
Cytotoxicity against human HepG2 cells after 72 hrs by MTT assay
|
[PMID: 30579802] |
| Jurkat | IC50 |
>20 μM
Compound: 2
|
Immunosuppressive activity in human Jurkat cells assessed as reduction in PHA + PMA-induced IL-2 production after 48 hrs by ELISA
Immunosuppressive activity in human Jurkat cells assessed as reduction in PHA + PMA-induced IL-2 production after 48 hrs by ELISA
|
[PMID: 30579802] |
| KB | ED50 |
3 μg/mL
Compound: NSC-106403
|
Cytotoxicity against human KB cells
Cytotoxicity against human KB cells
|
[PMID: 469554] |
| L6 | IC50 |
20.2 μM
Compound: 24
|
Cytotoxicity against rat L6 cells after 72 hrs by alamar blue staining based fluorescence assay
Cytotoxicity against rat L6 cells after 72 hrs by alamar blue staining based fluorescence assay
|
[PMID: 29244495] |
| MOLM-13 | IC50 |
5.9 μM
Compound: 32
|
Cytotoxicity against human MOLM-13 cells assessed as reduction in cell viability measured after 72 hrs by MTT assay
Cytotoxicity against human MOLM-13 cells assessed as reduction in cell viability measured after 72 hrs by MTT assay
|
[PMID: 33393294] |
| MRC5 | IC50 |
>159.2 μM
Compound: Pectolinarigenin
|
In vitro inhibitory concentration against human fetal lung MRC-5 cell line in the presence of vinblastine sulfate salt
In vitro inhibitory concentration against human fetal lung MRC-5 cell line in the presence of vinblastine sulfate salt
|
[PMID: 16125932] |
| MV4-11 | IC50 |
7.9 μM
Compound: 32
|
Cytotoxicity against human MV4-11 cells assessed as reduction in cell viability measured after 72 hrs by MTT assay
Cytotoxicity against human MV4-11 cells assessed as reduction in cell viability measured after 72 hrs by MTT assay
|
[PMID: 33393294] |
| NCI-H1975 | IC50 |
76.6 μM
Compound: 2
|
Cytotoxicity against human NCI-H1975 cells after 72 hrs by MTT assay
Cytotoxicity against human NCI-H1975 cells after 72 hrs by MTT assay
|
[PMID: 30579802] |
| PC-9 | IC50 |
>80 μM
Compound: 2
|
Cytotoxicity against human PC9 cells after 72 hrs by MTT assay
Cytotoxicity against human PC9 cells after 72 hrs by MTT assay
|
[PMID: 30579802] |
| RAW264.7 | IC50 |
>20 μM
Compound: 2
|
Anti-inflammatory activity in mouse RAW264.7 cells assessed as reduction in LPS-induced IL-6 production after 48 hrs by ELISA
Anti-inflammatory activity in mouse RAW264.7 cells assessed as reduction in LPS-induced IL-6 production after 48 hrs by ELISA
|
[PMID: 30579802] |
| RAW264.7 | IC50 |
>20 μM
Compound: 2
|
Anti-inflammatory activity in mouse RAW264.7 cells assessed as reduction in LPS-induced TNF-alpha production after 48 hrs by ELISA
Anti-inflammatory activity in mouse RAW264.7 cells assessed as reduction in LPS-induced TNF-alpha production after 48 hrs by ELISA
|
[PMID: 30579802] |
| Sf9 | IC50 |
0.6 μM
Compound: 1
|
Inhibition of N-terminal GST-His-tagged c-KIT (544 to 976 amino acids) D816V mutant (unknown origin) expressed in Sf9 insect cells using poly[Glu:Tyr] (4:1) as substrate preincubated for 20 mins followed by [33P-gamma]ATP addition and subsequent inhibitio
Inhibition of N-terminal GST-His-tagged c-KIT (544 to 976 amino acids) D816V mutant (unknown origin) expressed in Sf9 insect cells using poly[Glu:Tyr] (4:1) as substrate preincubated for 20 mins followed by [33P-gamma]ATP addition and subsequent inhibitio
|
[PMID: 26807861] |
In Vitro
Pectolinarigenin (5-160 μM; 24 h) reduces the viability of J774A.1 murine macrophages at the concentration of 160 μM, and inhibits LPS (HY-D1056)-induced NO release in J774A.1 murine macrophages[1].
Pectolinarigenin (1-5 μM; 1 h pre-incubation plus 24 h incubation) inhibits LPS-induced activation of primary mouse cortical astrocytes, suppresses the release of IL-1β and IL-6 in cells, elevates basal IL-10 levels, and restores IL-10 levels reduced by lipopolysaccharide[1].
Pectolinarigenin (5 μM; 1 h pre-incubation followed by 0.5-1 h incubation) inhibits the activation of NF-κB, ERK1/2 and p38MAPK in lipopolysaccharide-induced primary mouse cortical astrocytes[1].
Pectolinarigenin (1-50 μM; 24 h, 15 min) inhibits COX-2-mediated PGE2 production in LPS-stimulated RAW 264.7 cells in a concentration-dependent manner, with an inhibition rate of 99.0% at 50 μM for 24 h, and directly inhibits the enzymatic activity of COX-2 (with an inhibition rate of 44.8% at 50 μM for 15 min)[2].
Pectolinarigenin (1-50 μM; 10 min pre-incubation + 15 min A23187 (HY-N6687) incubation) dose-dependently inhibits 5-LOX-mediated cysteinyl leukotriene production in A23187-stimulated RBL-1 cells, with an inhibition rate of 97.0% at the concentration of 50 μM (10 min pre-incubation + 15 min A23187 incubation)[2].
Pectolinarigenin (0.1-10 μM; 24 h) significantly inhibits AAPH (HY-Y0525)-induced Nrf2 pathway-dependent ROS accumulation in HepG2 cells[3].
Pectolinarigenin (0.1-10 μM; 24 h) induces the expression of antioxidant enzymes in HepG2 cells: it upregulates the expression of heme oxygenase-1, while the 10 μM concentration upregulates the expression of NAD (P) H:quinone oxidoreductase 1 and aldo-keto reductase family 1 member B10[3].
Pectolinarigenin (0.1-10 μM; 3-24 h) significantly promotes the nuclear accumulation of Nrf2 and enhances ARE-mediated transcriptional activity in HepG2 cells[3].
Pectolinarigenin (2-8 μM; 12 h pretreatment followed by COM stimulation) concentration-dependently inhibits the COM-induced upregulation of KIM-1 mRNA and protein expression in HK-2 cells, and suppresses cellular inflammatory responses[4].
Pectolinarigenin (8 μM; 12 h pretreatment followed by COM stimulation) alleviates COM-induced oxidative stress injury in HK-2 cells by restoring the levels of antioxidant markers (GSH, HO-1, GPX4) and reducing the levels of pro-oxidant markers (MDA, iron, ROS)[4].
Pectolinarigenin (8 μM; 12 h incubation) inhibits HIF-1α activity in HK-2 cells[4].
Pectolinarigenin (8 μM; 12 h pretreatment followed by COM stimulation) alleviates COM-induced renal injury, inflammation and oxidative stress in HK-2 cells in vitro in a HIF-1α-dependent manner, as its protective effects are abolished when HIF-1α is knocked down[4].
Pectolinarigenin (25-150 μM; 24 h) dose-dependently inhibits the viability of AGS and MKN28 human gastric cancer cells, with IC50 values of 124.79 μM and 96.88 μM, respectively[5].
Pectolinarigenin (50-100 μM; 24 h) induces G2/M cell cycle arrest in human gastric cancer cell lines AGS and MKN28, accompanied by sub-G1 phase cell accumulation (indicating apoptosis) in AGS cells. Its mechanism of action involves downregulating the protein expression levels of CDK1 and CDC25C, and upregulating the mRNA expression levels of p53 and p21[5].
Pectolinarigenin (50-100 μM; 24 h) induces dose-dependent apoptosis in human gastric cancer cell lines AGS and MKN28 by downregulating XIAP and activating the caspase-PARP apoptotic pathway[5].
Pectolinarigenin (50-100 μM; 24 h) induces Beclin-1-independent autophagy in human gastric cancer cell lines AGS and MKN28[5].
Pectolinarigenin (50-100 μM; 24 h) dose-dependently inhibits the PI3K/AKT/mTOR signaling pathway in human gastric cancer cell lines AGS and MKN28, thereby reducing the phosphorylation levels of downstream pathway targets p70S6K, 4EBP1 and eIF4E[5].
Pectolinarigenin (30 μM; 72 h) significantly reduces melanin content and tyrosinase activity in melan-a cells, decreases the protein expression levels of tyrosinase, TRP-1, TRP-2 and MITF, and lowers the mRNA expression levels of tyrosinase, TRP-1 and MITF in the cells[6].
Pectolinarigenin (30 μM; 2 days) significantly reduces the melanin content in a recombinant human skin model to 20.8% of that in the control group, and decreases the L-DOPA content[6].
MedChemExpress (MCE) has not independently confirmed the accuracy of these methods. They are for reference only.
-
Cell Line:J774A.1 murine macrophages
-
Concentration:5, 10, 20, 40, 80, 160 μM
-
Incubation Time:24 h
-
Result:Decreased cell viability at 160 μM.
Did not reduce cell viability relative to controls at concentrations below 80 μM.
-
Cell Line:astrocytes primary culture
-
Concentration:5 μM
-
Incubation Time:1 h pre-incubation plus 24 h incubation
-
Result:Restored the structure of damaged filamentous collagen acidic protein (GFAP)
-
Cell Line:human hepatoma HepG2 cells
-
Concentration:0.1, 1.0, 10 μM
-
Incubation Time:24 h
-
Result:Significantly increased protein expression of heme oxygenase-1 at all tested concentrations.
Significantly increased protein expression of NAD(P)H:quinone oxidoreductase 1 and aldo-keto reductase family 1 member B10 at 10 μM.
-
Cell Line:human hepatoma HepG2 cells
-
Concentration:0.1, 1.0, 10 μM
-
Incubation Time:3 h
-
Result:Significantly increased nuclear accumulation of Nrf2 at all tested concentrations, with levels normalized to Lamin B.
-
Cell Line:AGS , MKN28 cells
-
Concentration:25, 50, 75, 100, 125, 150 μM
-
Incubation Time:24 h
-
Result:Inhibited cell growth in a dose-dependent manner in both cell lines.
Reached IC50 values of 124.79 μM for AGS cells and 96.88 μM for MKN28 cells after 24 h of treatment.
Caused massive cell rounding, shrinkage, and detachment from culture plates at 50 and 100 μM after 24 h of treatment.
-
Cell Line:AGS , MKN28 cells
-
Concentration:50, 100 μM
-
Incubation Time:24 h
-
Result:Caused significant accumulation of cells in the G2/M phase in both AGS and MKN28 cells.
Induced a significant increase in sub-G1 phase cells (indicative of apoptotic death) in AGS cells, while inducing a slight increase in sub-G1 phase cells in MKN28 cells.
Downregulated CDK1 and CDC25C protein expression in a dose-dependent manner at 50 and 100 μM.
Increased p53 and p21 mRNA levels in a significant dose-dependent manner in both cell lines, with no significant changes in p53 and p21 protein levels.
-
Cell Line:AGS , MKN28 cells
-
Concentration:50, 100 μM
-
Incubation Time:24 h
-
Result:Induced dose-dependent apoptosis in both cell lines.
Increased total apoptotic cells by over 6-fold in AGS cells (with early apoptosis as the major population) and over 5-fold in MKN28 cells (with late apoptosis as the major population) at 100 μM after 24 h.
Showed fragmented or condensed nuclei in treated cells via Hoechst 33342 staining, confirming apoptotic death.
Downregulated XIAP, procaspase-8, procaspase-7, and procaspase-3 in a dose-dependent manner, with concurrent upregulation of cleaved caspase-3, cleaved caspase-7, and cleaved PARP in both cell lines.
-
Cell Line:AGS , MKN28 cells
-
Concentration:50, 100 μM
-
Incubation Time:24 h
-
Result:Induced dose-dependent formation of acidic vesicular organelles (AVOs) in both cell lines.
Increased the LC3-II/LC3-I ratio and p62 expression in a dose-dependent manner, with concurrent dose-dependent downregulation of Beclin-1 expression in both cell lines.
-
Cell Line:melan-a cells
-
Concentration:30 μM
-
Incubation Time:72 h
-
Result:Reduced protein expression of tyrosinase to 37.9% .
Reduced protein expression of TRP-1 to 42.0% .
Reduced protein expression of TRP-2 to 38.3% .
Reduced protein expression of MITF to 51.5% .
-
Cell Line:melan-a cells
-
Concentration:30 μM
-
Incubation Time:72 h
-
Result:Reduced mRNA expression of tyrosinase to 55.0%.
Reduced mRNA expression of TRP-1 to 10.7 %.
Reduced mRNA expression of MITF to 32.3 %.
In Vivo
Pectolinarigenin (4-100 mg/kg; p.o.; single dose) produces a 21.1% inhibitory effect on carrageenan-induced paw edema in mice when administered orally at 100 mg/kg[2].
Pectolinarigenin (20 mg/kg; p.o.; two doses), administered orally at a dose of 20 mg/kg twice, exerts a 30.8% inhibitory effect on passive cutaneous anaphylaxis in rats[2].
When pectolinarigenin (1.0-10 mg/kg; p.o.; daily; 7 days) is administered orally at a dose of 10 mg/kg once daily for 7 days, it activates the Nrf2/ARE pathway in the liver of male ICR mice, significantly induces the expression of antioxidant enzymes, and promotes Nrf2 nuclear translocation[3].
Pectolinarigenin (7.25-25 mg/kg; i.g.; daily) alleviates calcium oxalate-induced renal injury, inflammation and oxidative stress in mice in a dose-dependent manner by inhibiting HIF-1α activity[4].
MedChemExpress (MCE) has not independently confirmed the accuracy of these methods. They are for reference only.
-
Animal Model:ICR (male, 4 weeks old, specific pathogen-free)[2]
-
Dosage:4 mg/kg; 20 mg/kg; 100 mg/kg
-
Administration:p.o.; single dose
-
Result:Reduced increased ear thickness by 18.7% at 20 mg/kg.
Produced a statistically significant 34.7% inhibition of increased ear thickness at 100 mg/kg.\n
Reduced increased paw volume by 2.6% at 4 mg/kg.
Reduced increased paw volume by 13.2% at 20 mg/kg.
Reduced increased paw volume by 21.1% at 100 mg/kg.
-
Animal Model:Sprague-Dawley (male, 4 weeks old, specific pathogen-free)[2]
-
Dosage:20 mg/kg
-
Administration:p.o.; two doses (1 hour before IgE injection and 1 hour before antigen challenge)
-
Result:Produced a 30.8% inhibition of the allergic response.
-
Animal Model:ICR mice (male, 6-week-old)[3]
-
Dosage:1.0 mg/kg; 10 mg/kg
-
Administration:p.o.; daily; 7 days
-
Result:Significantly increased liver protein expression of heme oxygenase-1 (HO-1) and aldo-keto reductase family 1 member B10 (AKR1B10), and significantly promoted nuclear translocation of nuclear factor-erythroid-2-related factor 2 (Nrf2) in the liver at 10 mg/kg.
Did not produce statistically significant increases in HO-1, AKR1B10 expression, or Nrf2 nuclear translocation at 1.0 mg/kg.
Reached plasma concentrations of 0.92 μM (1.0 mg/kg group) and 1.09 μM (10 mg/kg group) 2 hours after the final dose.
-
Animal Model:C57BL/6J mice (male, 6-8 weeks old, 22-24 g)[4]
-
Dosage:7.25 mg/kg; 12.5 mg/kg; 25 mg/kg
-
Administration:i.g.; daily
-
Result:Reduced serum creatinine and blood urea nitrogen (BUN) levels in a concentration-dependent manner.
Attenuated renal tubular damage (assessed via PAS staining) and reduced renal calcium oxalate crystal deposition in a concentration-dependent manner.
Inhibited the glyoxylate-induced increase in KIM-1 protein and mRNA expression.
Impeded the glyoxylate-induced elevation of inflammatory factors (IL-6, MCP-1, TNF-α) at the mRNA level, and inhibited phosphorylation of P65.
Reduced renal malondialdehyde (MDA) and iron levels, and increased reduced glutathione (GSH) levels, in a concentration-dependent manner.
Upregulated renal expression of HO-1 and GPX4 proteins.
Inhibited the activity of HIF-1α (assessed via luciferase reporter assay) without reducing HIF-1α protein or mRNA expression.
- Western Blot
- RNA extraction experimental
- Nephrotoxicity Study
- Annexin V plus membrane-impermeant dye apoptosis staining
- BrdU Incorporation Assay
- ROS/oxidative-stress fluorescent staining
- Protocol for Cell Cycle
- Research Protocol for Inflammation-related Diseases
- Kinase activity and phosphorylation assays
- Detection of Apoptosis
- TUNEL staining for apoptotic DNA fragmentation
- Flow cytometric DNA-content cell-cycle staining
- Autophagy
- Apoptosis Solutions
- Protocol for Kinase activity and phosphorylation assays
- Lysosome and acidic-vesicle live-cell staining
- Macroautophagy Solutions


Chemical Information
-
CAS No. 520-12-7
-
Appearance Solid
-
Molecular Weight 314.29
-
Formula C17H14O6
-
Color Light yellow to yellow
-
SMILES
O=C1C=C(C2=CC=C(OC)C=C2)OC3=CC(O)=C(OC)C(O)=C13
-
Structure Classification
-
Shipping
Room temperature in continental US; may vary elsewhere.
-
Storage
4°C, protect from light
* In solvent : -80°C, 6 months; -20°C, 1 month (protect from light)


Publications (2)
-
Journal Impact Factor
-
Most Recent
-
Autophagy
XIAP-ULK1-Mediated mitophagy modulates carnitine metabolism to mitigate diabetic kidney disease. [Abstract]2025 Oct 25. PMID: 41139215 -
Chem Biol Interact
Pectolinarigenin attenuates hepatic ischemia/reperfusion injury via activation of the PI3K/AKT/Nrf2 signaling pathway. [Abstract]2023 Dec 1:386:110763. PMID: 37832626
Pectolinarigenin purchased from MedChemExpress. Usage Cited in: Chem Biol Interact. 2023 Dec 1:386:110763. [Abstract]
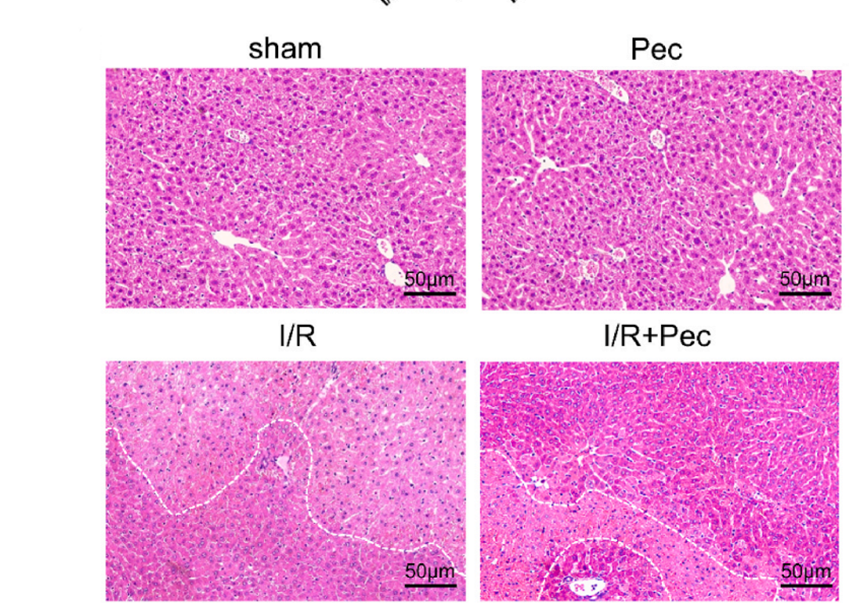
H&E staining and quantification of necrotic area of liver tissue treated with Pectolinarigenin (Pec) (10 mg/kg, i.p.).
Pectolinarigenin purchased from MedChemExpress. Usage Cited in: Chem Biol Interact. 2023 Dec 1:386:110763. [Abstract]
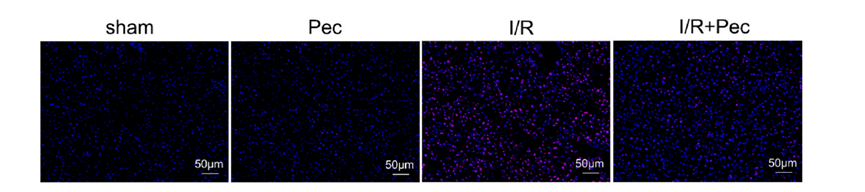
DHE stained sections of fluorescence intensity of liver tissue treated with Pectolinarigenin (Pec) (10 mg/kg, i.p.).
Pectolinarigenin purchased from MedChemExpress. Usage Cited in: Chem Biol Interact. 2023 Dec 1:386:110763. [Abstract]
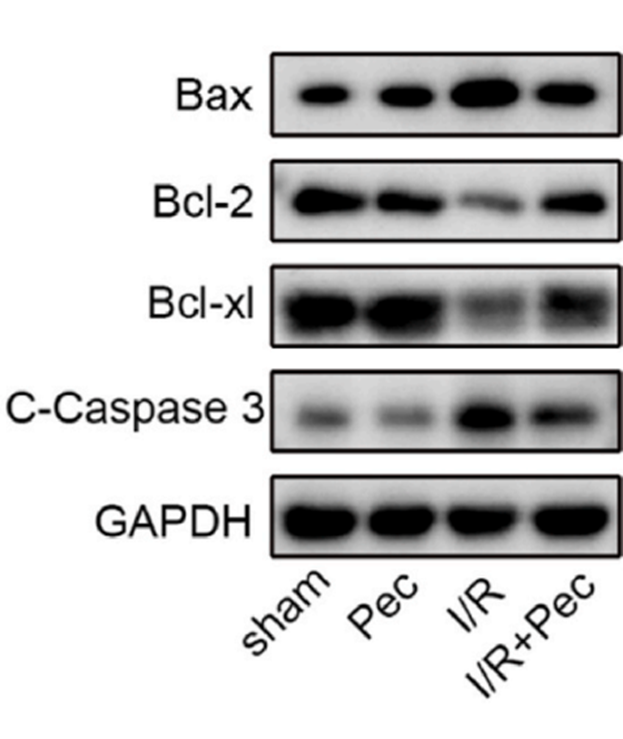
Protein levels and relative quantification analysis of Bax, Bcl-2, Bcl-xl, and cleaved caspase-3 in liver tissue treated with Pectolinarigenin (Pec) (10 mg/kg, i.p.).
Pectolinarigenin purchased from MedChemExpress. Usage Cited in: Chem Biol Interact. 2023 Dec 1:386:110763. [Abstract]
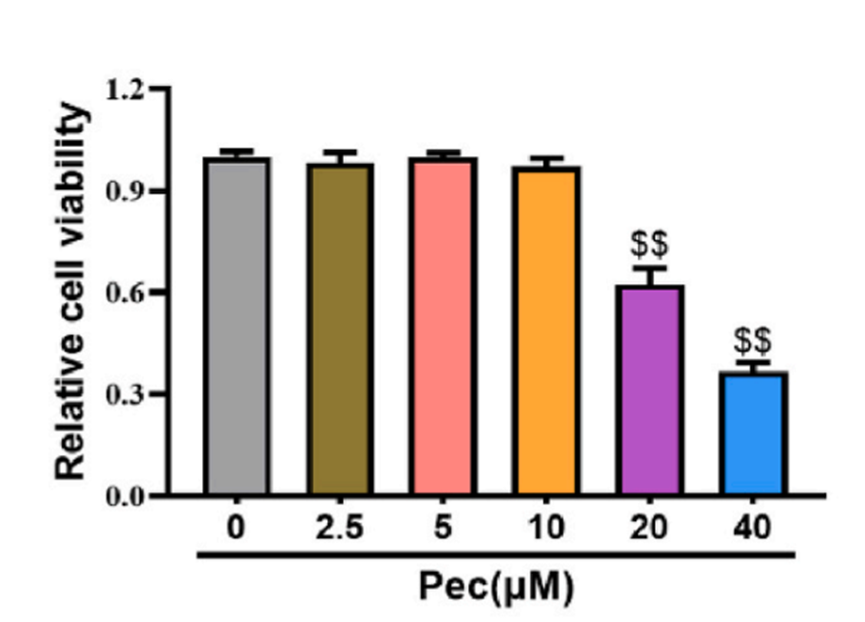
Cell viability after receiving discrepant Pectolinarigenin (Pec) (0, 2.5, 5. 10, 20, 40 μM) concentrations.
Pectolinarigenin purchased from MedChemExpress. Usage Cited in: Chem Biol Interact. 2023 Dec 1:386:110763. [Abstract]
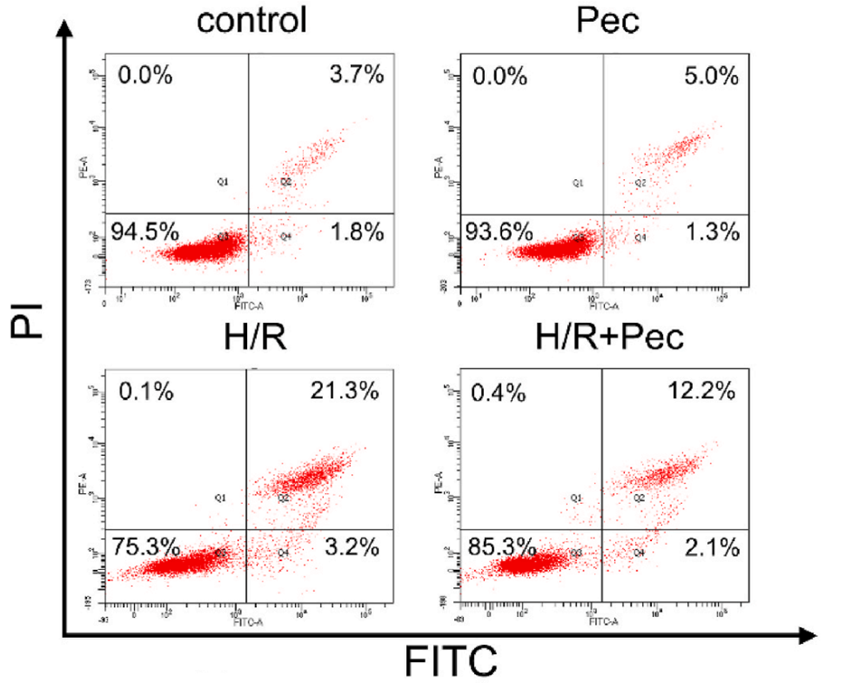
Flow cytometry detection of apoptosis treated with Pectolinarigenin (Pec) (10 μM).


Solvent & Solubility
In Vitro:
DMSO : 33.33 mg/mL (106.05 mM; Need ultrasonic; Hygroscopic DMSO has a significant impact on the solubility of product, please use newly opened DMSO)
Please refer to the solubility information to select the appropriate solvent. Once prepared, please aliquot and store the solution to prevent product inactivation from repeated freeze-thaw cycles.
Storage method and period of stock solution: -80°C, 6 months; -20°C, 1 month (protect from light). When stored at -80°C, please use it within 6 months. When stored at -20°C, please use it within 1 month.
Please refer to the solubility information to select the appropriate solvent. Once prepared, please aliquot and store the solution to prevent product inactivation from repeated freeze-thaw cycles.
Storage method and period of stock solution: -80°C, 6 months; -20°C, 1 month (protect from light). When stored at -80°C, please use it within 6 months. When stored at -20°C, please use it within 1 month.
Concentration (start) × Volume (start) = Concentration (final) × Volume (final)
In Vivo:
Select the appropriate dissolution method based on your experimental animal and administration route.
- For the following dissolution methods, please ensure to first prepare a clear stock solution using an In Vitro approach and then sequentially add co-solvents:
- To ensure reliable experimental results, the clarified stock solution can be appropriately stored based on storage conditions. As for the working solution for In Vivo experiments, it is recommended to prepare freshly and use it on the same day.
- The percentages shown for the solvents indicate their volumetric ratio in the final prepared solution. If precipitation or phase separation occurs during preparation, heat and/or sonication can be used to aid dissolution.
For the following dissolution methods, please prepare the working solution directly:
It is recommended to prepare fresh solutions and use them promptly within a short period of time.
The percentages shown for the solvents indicate their volumetric ratio in the final prepared solution. If precipitation or phase separation occurs during preparation, heat and/or sonication can be used to aid dissolution.
Add each solvent one by one: 50% PEG300 50% Saline
Solubility: 1 mg/mL (3.18 mM); Suspended solution; Need ultrasonic and warming and heat to 60°C
In Vivo Dissolution Calculator
Please enter the basic information of animal experiments:
-
-
-
-
Recommended: Prepare an additional quantity of animals to account for potential losses during experiments.
Please enter your animal formula composition:
-
%DMSO +
Recommended: Keep the proportion of DMSO in working solution below 2% if your animal is weak.
-
%+
-
+%Tween-80 + +
-
%Saline +
The co-solvents required include: DMSO, . All of co-solvents are available by MedChemExpress (MCE). , Tween 80. All of co-solvents are available by MedChemExpress (MCE).
Working solution concentration: 0.22 mg/mL
Method for preparing stock solution: mg drug dissolved in μL DMSO. Stock solution concentration: mg/mL. * In solvent : -80°C, 6 months; -20°C, 1 month (protect from light)
1. Take μL DMSO stock solution;
2. Add μL .
μL , mix evenly;
3. Then add μL Tween 80, mix evenly;
4. Then add μL
Please ensure that the stock solution in the first step is dissolved to a clear state, and add co-solvents in sequence. You can use ultrasonic heating (ultrasonic cleaner, recommended frequency 20-40 kHz), vortexing, etc. to assist dissolution.


Purity & Documentation
-
Data Sheet (299 KB)
-
SDS (394 KB)
- English - EN (394 KB)
- Français - FR (394 KB)
- Deutsch - DE (394 KB)
- Norwegian - NO (394 KB)
- Español - ES (394 KB)
- Swedish - SV (394 KB)
- Italian - IT (394 KB)
- Korean - KR (394 KB)
- Portuguese - PT (394 KB)
-
Handling Instructions (2659 KB)
References
[1]. Heimfarth L, et al. Neuroprotective and anti-inflammatory effect of pectolinarigenin, a flavonoid from Amazonian Aegiphila integrifolia (Jacq.), against lipopolysaccharide-induced inflammation in astrocytes via NFκB and MAPK pathways. Food Chem Toxicol. 2021;157:112538. [Content Brief]
[2]. Lim H, et al. Anti-inflammatory activity of pectolinarigenin and pectolinarin isolated from Cirsium chanroenicum. Biol Pharm Bull. 2008;31(11):2063-2067. [Content Brief]
[3]. Shiraiwa M, et al. Pectolinarigenin Induces Antioxidant Enzymes through Nrf2/ARE Pathway in HepG2 Cells. Antioxidants (Basel). 2022;11(4):675. Published 2022 Mar 30. [Content Brief]
[4]. Yao R, et al. Pectolinarigenin alleviates calcium oxalate-induced renal inflammation and oxidative stress by binding to HIF-1α. Int Immunopharmacol. 2024;143(Pt 1):113284. [Content Brief]
[5]. Lee HJ, et al. Pectolinarigenin Induced Cell Cycle Arrest, Autophagy, and Apoptosis in Gastric Cancer Cell via PI3K/AKT/mTOR Signaling Pathway. Nutrients. 2018;10(8):1043. Published 2018 Aug 8. [Content Brief]
[6]. Lee S, et al. Pectolinarigenin, an aglycone of pectolinarin, has more potent inhibitory activities on melanogenesis than pectolinarin. Biochem Biophys Res Commun. 2017;493(1):765-772. [Content Brief]


Complete Stock Solution Preparation Table
Please refer to the solubility information to select the appropriate solvent. Once prepared, please aliquot and store the solution to prevent product inactivation from repeated freeze-thaw cycles.
Storage method and period of stock solution: -80°C, 6 months; -20°C, 1 month (protect from light). When stored at -80°C, please use it within 6 months. When stored at -20°C, please use it within 1 month.
| Optional Solvent | Concentration Solvent Mass | 1 mg | 5 mg | 10 mg | 25 mg |
|---|---|---|---|---|---|
| DMSO | 1 mM | 3.1818 mL | 15.9089 mL | 31.8177 mL | 79.5444 mL |
| 5 mM | 0.6364 mL | 3.1818 mL | 6.3635 mL | 15.9089 mL | |
| 10 mM | 0.3182 mL | 1.5909 mL | 3.1818 mL | 7.9544 mL | |
| 15 mM | 0.2121 mL | 1.0606 mL | 2.1212 mL | 5.3030 mL | |
| 20 mM | 0.1591 mL | 0.7954 mL | 1.5909 mL | 3.9772 mL | |
| 25 mM | 0.1273 mL | 0.6364 mL | 1.2727 mL | 3.1818 mL | |
| 30 mM | 0.1061 mL | 0.5303 mL | 1.0606 mL | 2.6515 mL | |
| 40 mM | 0.0795 mL | 0.3977 mL | 0.7954 mL | 1.9886 mL | |
| 50 mM | 0.0636 mL | 0.3182 mL | 0.6364 mL | 1.5909 mL | |
| 60 mM | 0.0530 mL | 0.2651 mL | 0.5303 mL | 1.3257 mL | |
| 80 mM | 0.0398 mL | 0.1989 mL | 0.3977 mL | 0.9943 mL | |
| 100 mM | 0.0318 mL | 0.1591 mL | 0.3182 mL | 0.7954 mL |


Pectolinarigenin Related Classifications
HY-N0493 Related Classifications
 Powered by Bioz
Keywords
- Pectolinarigenin
- 520-12-7
- COX
- Lipoxygenase
- NF-κB
- p38 MAPK
- ERK
- HIF/HIF Prolyl-Hydroxylase
- Keap1-Nrf2
- PI3K
- Apoptosis
- Autophagy
- COX-2/5-LOX Inhibitor
- J774A.1 cells
- primary mouse cortical astrocytes
- RAW 264.7 cells
- RBL-1 cells
- HepG2 cells
- HK-2 cells
- AGS cells
- MKN28 cells
- ICR mice
- Sprague-Dawley rat
- C57BL/6J mice
- neurodegenerative diseases
- inflammatory/allergic diseases
- calcium oxalate nephrocalcinosis
- gastric cancer
- melasma
- post-inflammatory diseases
- chloasma
- Inhibitor
- inhibitor
- inhibit