



Lucidenic acid B

Based on 1 Customer Validation
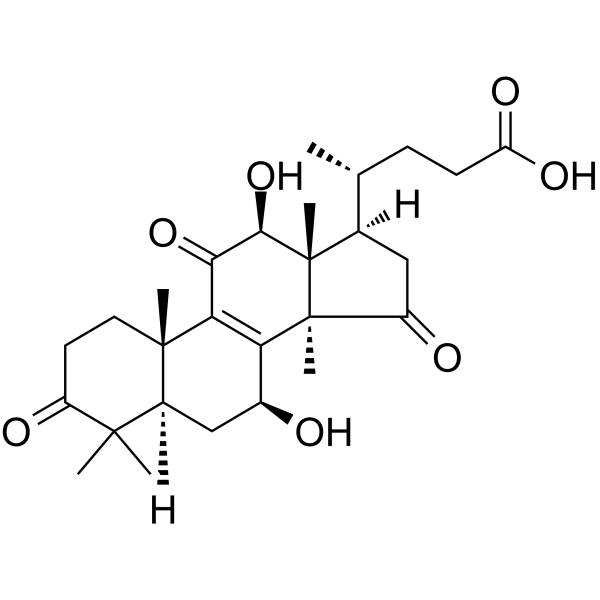
Lucidenic acid B is a triterpenoid compound. Lucidenic acid B inhibits the activities of ERK1/2, AP-1, NF-kB, and IKK, suppresses PMA (Phorbol 12-myristate 13-acetate) (HY-18739)-induced MMP-9 expression and cell invasion, and induces apoptosis in leukemia cells via the mitochondrial pathway. Lucidenic acid B inhibits the growth of various cancer cell lines without affecting normal lymphocytes and does not induce G1 phase arrest or necrosis. Lucidenic acid B can be used in research on hepatocellular carcinoma, human acute promyelocytic leukemia, and skin tumor promotion.
For research use only. We do not sell to patients.
- Purity : 99.85%
- CAS No.: 95311-95-8
- Formula: C27H38O7
- Molecular Weight:474.59
-
Storage:
-20°C, protect from light
* In solvent : -80°C, 6 months; -20°C, 1 month (protect from light)

To place orders, for customer services and technical support, please contact: MedChemExpress USA
Tel: 609-228-6898 E-mail: [email protected] [email protected]


-
 Biological Activity
-
Chemical Information
-
Solvent & Solubility
- Protocols
- Purity & Documentation
- References
-
 Help & FAQs


All AP-1 Isoforms
More

Biological Activity
Description
|
ERK1 |
ERK2 |
NF-κB |
AP-1 |
IKK |
MMP-9 |
Cellular Effect
|
Cell Line

|
Type | Value | Description | References |
|---|---|---|---|---|
| COLO 205 | IC50 |
249 μM
|
Antiproliferative activity against human COLO 205 cells assessed as reduction in cell viability by MTT assay.
Antiproliferative activity against human COLO 205 cells assessed as reduction in cell viability by MTT assay.
|
18481862 |
| HepG2 | IC50 |
112 μM
|
Antiproliferative activity against human HepG2 cells assessed as reduction in cell viability by MTT assay.
Antiproliferative activity against human HepG2 cells assessed as reduction in cell viability by MTT assay.
|
18481862 |
| HL-60 | IC50 |
19.3 μM
|
Antiproliferative activity against human HL-60 cells assessed as reduction in cell viability by MTT assay.
Antiproliferative activity against human HL-60 cells assessed as reduction in cell viability by MTT assay.
|
18481862 |
| HT-29 | IC50 |
382 μM
|
Antiproliferative activity against human HT-29 cells assessed as reduction in cell viability by MTT assay.
Antiproliferative activity against human HT-29 cells assessed as reduction in cell viability by MTT assay.
|
18481862 |
In Vitro
Lucidenic acid B (LAB) (10-100 μM; 24 h) reduces PMA (Phorbol 12-myristate 13-acetate) (HY-18739)-induced invasion of HepG2 cells in a dose-dependent manner[1].
Lucidenic acid B (10-100 μM; 24 h) suppresses PMA-induced MMP-9 expression in HepG2 cells at the transcriptional level[1].
Lucidenic acid B (10-100 μM; 24 h) suppresses PMA-induced MMP-9 activity in HepG2 cells[1].
Lucidenic acid B (10-100 μM; 24 h), in combination with an IKK inhibitor, synergistically suppresses PMA-induced MMP-9 expression in HepG2 cells[1].
Lucidenic acid B (10-100 μM; 24 h) suppresses the PMA-induced phosphorylation of ERK1/2 in HepG2 cells without affecting Akt phosphorylation[1].
Lucidenic acid B (10-100 μM; 24 h) enhances IκBα protein expression in PMA-stimulated HepG2 cells, which prevents NF-κB activation[1].
Lucidenic acid B (10-100 μM; 24 h) strongly inhibits the PMA-stimulated NF-κB and AP-1 DNA-binding activities in HepG2 cells in a dose-dependent manner[1].
Lucidenic acid B (10-100 μM; 24 h) dose-dependently reduces the nuclear protein levels of NF-κB, c-Jun, and c-Fos in PMA-stimulated HepG2 cells[1].
Lucidenic acid B (25-500 µM; 24-72 h) potently inhibits the growth of HL-60 human acute promyelocytic leukemia cells with an IC50 of 19.3 µM, while exhibiting weaker growth inhibition against COLO 205, HepG2, and HT-29 cells, and no effect on normal human peripheral blood lymphocytes[2].
Lucidenic acid B (25-100 µM; 24-72 h) does not induce G1 cell cycle arrest in HL-60 cells but causes a time- and dose-dependent increase in the sub-G1 apoptotic cell population[2].
Lucidenic acid B (5-100 µM; 24-72 h) induces apoptotic nuclear morphological changes in HL-60 cells in a time- and dose-dependent manner, with visible apoptotic bodies at 50 µM after 24 h[2].
Lucidenic acid B (5-100 µM; 72 h) induces dose-dependent early and late apoptosis in HL-60 cells after 72 h of treatment, with negligible necrosis[2].
Lucidenic acid B (5-100 µM; 3-12 h) induces a time- and dose-dependent loss of mitochondrial membrane potential in HL-60 cells[2].
Lucidenic acid B (5-25 µM; 3-6 h) modulates Bcl-2 family protein expression (increasing pro-apoptotic Bax, Bak, Bad and decreasing anti-apoptotic Bcl-2, Bcl-XL) and induces cytochrome c release from mitochondria in HL-60 cells in a time- and dose-dependent manner[2].
Lucidenic acid B (5-25 µM; 3-6 h) induces caspase-9 and caspase-3 activation and PARP cleavage in HL-60 cells in a time- and dose-dependent manner[2].
Lucidenic acid B induced cell death in HL-60 cells is prevented by inhibition of caspase-9 or caspase-3, confirming the functional requirement of these caspases in the apoptotic pathway[2].
MedChemExpress (MCE) has not independently confirmed the accuracy of these methods. They are for reference only. Further protocols information, click here.
-
Cell Line:HepG2
-
Concentration:10 μM; 25 μM; 50 μM; 75 μM; 100 μM
-
Incubation Time:24 h
-
Result:Reduced PMA-induced invasion of HepG2 cells in a dose-dependent manner.
-
Cell Line:HepG2
-
Concentration:10 μM; 25 μM; 50 μM; 75 μM; 100 μM
-
Incubation Time:24 h
-
Result:Suppressed PMA-induced MMP-9 expression in HepG2 cells at the transcriptional level.
-
Cell Line:HepG2
-
Concentration:10 μM; 25 μM; 50 μM; 75 μM; 100 μM
-
Incubation Time:24 h
-
Result:Decreased PMA-induced ERK1 phosphorylation by 49.8% and ERK2 phosphorylation by 46.2% compared with PMA-only treatment.
Did not significantly affect PMA-induced Akt phosphorylation.\nEnhanced IκBα protein expression in PMA-stimulated HepG2 cells.
-
Cell Line:HepG2
-
Concentration:10 μM; 25 μM; 50 μM; 75 μM; 100 μM
-
Incubation Time:24 h
-
Result:Decreased nuclear protein levels of NF-κB, c-Jun, and c-Fos in dose-dependent manners.
-
Cell Line:COLO 205, HCT 116, HepG2, HL-60, HT-29 human cancer cell lines and human peripheral blood lymphocytes
-
Concentration:25-500 µM
-
Incubation Time:24, 48, and 72 h
-
Result:Inhibited the growth of multiple human cancer cell lines, with the strongest effect observed in HL-60 cells.
Showed an IC50 value of 249 µM in COLO 205 cells.
Showed an IC50 value of 112 µM in HepG2 cells.
Showed an IC50 value of 19.3 µM in HL-60 cells.
Showed an IC50 value of 382 µM in HT-29 cells.
Showed an IC50 value of over 500 µM in HCT 116 cells.
Did not affect the survival of normal human peripheral blood lymphocytes.
-
Cell Line:HL-60 human leukemic cells
-
Concentration:25 µM; 50 µM; 75 µM; 100 µM
-
Incubation Time:24, 48, and 72 h
-
Result:Did not cause cell cycle arrest at the G1 phase in HL-60 cells.
Resulted in a marked, time- and dose-dependent accumulation of cells in the sub-G1 phase, which corresponds to apoptotic cells.
-
Cell Line:HL-60 human leukemic cells
-
Concentration:5 µM; 10 μM; 25 μM; 50 μM; 100 μM
-
Incubation Time:24, 48, and 72 h
-
Result:Revealed apoptotic bodies, characterized by chromatin condensation, compaction along the periphery of the nucleus, and nuclear segmentation, when HL-60 cells were treated with 50 µM for 24 h.
Mediated apoptosis in HL-60 cells in a time- and dose-dependent manner.
-
Cell Line:HL-60 human leukemic cells
-
Concentration:5 µM; 10 μM; 25 μM; 50 μM; 100 μM
-
Incubation Time:72 h
-
Result:Decreased the number of normal HL-60 cells in a dose-dependent manner.
Increased the combined population of early apoptotic (Annexin V-FITC+/PI-) and late apoptotic cells (Annexin V-FITC+/PI+) in a dose-dependent manner.
Resulted in 1.9% of cells being apoptotic (1.7% early + 0.2% late) with 98.1% remaining normal and 0% necrosis at 5 µM.
Resulted in 22.8% of cells being apoptotic (all early) with 77.2% normal and 0% necrosis at 10 µM.
Resulted in 26.6% of cells being apoptotic (26.5% early + 0.1% late) with 73.4% normal and 0% necrosis at 25 µM.
Resulted in 33.9% of cells being apoptotic (33.8% early + 0.1% late) with 66.1% normal and 0% necrosis at 50 µM.
Resulted in 75.5% of cells being apoptotic (3.6% early + 71.9% late) with 23.9% normal and 0.6% necrosis at 100 µM.
Caused minimal necrosis across all tested concentrations.
-
Cell Line:HL-60 human leukemic cells
-
Concentration:5 µM; 10 µM; 25 µM
-
Incubation Time:3 and 6 h
-
Result:Increased pro-apoptotic Bax expression to 2.02-fold relative to control at 25 µM for 6 h.
Increased Bak expression to 4.90-fold relative to control at 25 µM for 6 h.
Increased Bad expression to 4.59-fold relative to control at 25 µM for 6 h.
Decreased anti-apoptotic Bcl-2 expression to 0.13-fold of control at 25 µM for 6 h.
Decreased anti-apoptotic Bcl-X_L expression to 0.33-fold of control at 25 µM for 6 h.
Caused a significant time- and dose-dependent shift in the ratio of pro-apoptotic to anti-apoptotic Bcl-2 family members.
Increased cytosolic cytochrome c expression to 5.91-fold of control at 25 µM for 6 h, indicating release of cytochrome c from mitochondria into the cytosol.
Induced cytochrome c release in a time- and dose-dependent manner.\nCaused degradation of pro-caspase-9 and pro-caspase-3, generating active caspase-9 and caspase-3 fragments in a time- and dose-dependent manner.
Induced PARP cleavage in a time- and dose-dependent manner.
Caused a time- and dose-dependent increase in the enzymatic activities of both caspase-9 and caspase-3.


Chemical Information
-
CAS No. 95311-95-8
-
Appearance Solid
-
Molecular Weight 474.59
-
Formula C27H38O7
-
Color White to off-white
-
SMILES
C[C@]12C3=C(C([C@@H](O)[C@@]1([C@]([C@H](C)CCC(O)=O)([H])CC2=O)C)=O)[C@@]4([C@@](C(C)(C(CC4)=O)C)([H])C[C@@H]3O)C
-
Structure Classification
-
Shipping
Room temperature in continental US; may vary elsewhere.
-
Storage
-20°C, protect from light
* In solvent : -80°C, 6 months; -20°C, 1 month (protect from light)


Solvent & Solubility
In Vitro:
DMSO : ≥ 100 mg/mL (210.71 mM; Hygroscopic DMSO has a significant impact on the solubility of product, please use newly opened DMSO)
* "≥" means soluble, but saturation unknown.
Please refer to the solubility information to select the appropriate solvent. Once prepared, please aliquot and store the solution to prevent product inactivation from repeated freeze-thaw cycles.
Storage method and period of stock solution: -80°C, 6 months; -20°C, 1 month (protect from light). When stored at -80°C, please use it within 6 months. When stored at -20°C, please use it within 1 month.
Please refer to the solubility information to select the appropriate solvent. Once prepared, please aliquot and store the solution to prevent product inactivation from repeated freeze-thaw cycles.
Storage method and period of stock solution: -80°C, 6 months; -20°C, 1 month (protect from light). When stored at -80°C, please use it within 6 months. When stored at -20°C, please use it within 1 month.
Concentration (start) × Volume (start) = Concentration (final) × Volume (final)
In Vivo:
Select the appropriate dissolution method based on your experimental animal and administration route.
- For the following dissolution methods, please ensure to first prepare a clear stock solution using an In Vitro approach and then sequentially add co-solvents:
- To ensure reliable experimental results, the clarified stock solution can be appropriately stored based on storage conditions. As for the working solution for In Vivo experiments, it is recommended to prepare freshly and use it on the same day.
- The percentages shown for the solvents indicate their volumetric ratio in the final prepared solution. If precipitation or phase separation occurs during preparation, heat and/or sonication can be used to aid dissolution.
Add each solvent one by one: 10% DMSO 40% PEG300 5% Tween-80 45% Saline
Solubility: ≥ 2.5 mg/mL (5.27 mM); Clear solution
This protocol yields a clear solution of ≥ 2.5 mg/mL (saturation unknown).
Taking 1 mL working solution as an example, add 100 μL DMSO stock solution (25.0 mg/mL) to 400 μL PEG300, and mix evenly; then add 50 μL Tween-80 and mix evenly; then add 450 μL Saline to adjust the volume to 1 mL.
Preparation of Saline: Dissolve 0.9 g sodium chloride in ddH₂O and dilute to 100 mL to obtain a clear Saline solution.
Add each solvent one by one: 10% DMSO 90% (20% SBE-β-CD in Saline)
Solubility: ≥ 2.5 mg/mL (5.27 mM); Clear solution
This protocol yields a clear solution of ≥ 2.5 mg/mL (saturation unknown).
Taking 1 mL working solution as an example, add 100 μL DMSO stock solution (25.0 mg/mL) to 900 μL 20% SBE-β-CD in Saline, and mix evenly.
Preparation of 20% SBE-β-CD in Saline (4°C, storage for one week): 2 g SBE-β-CD powder is dissolved in 10 mL Saline, completely dissolve until clear.
In Vivo Dissolution Calculator
Please enter the basic information of animal experiments:
-
-
-
-
Recommended: Prepare an additional quantity of animals to account for potential losses during experiments.
Please enter your animal formula composition:
-
%DMSO +
Recommended: Keep the proportion of DMSO in working solution below 2% if your animal is weak.
-
%+
-
+%Tween-80 + +
-
%Saline +
The co-solvents required include: DMSO, . All of co-solvents are available by MedChemExpress (MCE). , Tween 80. All of co-solvents are available by MedChemExpress (MCE).
Working solution concentration: 0.22 mg/mL
Method for preparing stock solution: mg drug dissolved in μL DMSO. Stock solution concentration: mg/mL. * In solvent : -80°C, 6 months; -20°C, 1 month (protect from light)
1. Take μL DMSO stock solution;
2. Add μL .
μL , mix evenly;
3. Then add μL Tween 80, mix evenly;
4. Then add μL
Please ensure that the stock solution in the first step is dissolved to a clear state, and add co-solvents in sequence. You can use ultrasonic heating (ultrasonic cleaner, recommended frequency 20-40 kHz), vortexing, etc. to assist dissolution.

Protocols
-
Spheroid/Tumor Organoid Invasion Assay
The spheroid/tumor organoid invasion assay measures outward movement of cancer cells from a compact 3D aggregate into an extracellular matrix, usually collagen I, basement membrane matrix, or mixed collagen-Matrigel hydrogels; the readout is generated by bright-field, fluorescence, confocal, or time-lapse imaging of cell egress, invasion area, invasion distance, dispersion, protrusion formation, basement-membrane perforation, or cell trajectories. The assay reflects cell-cell cohesion, cell-matrix adhesion, matrix remodeling, protease-dependent invasion, contractility, and invasion behavior in a 3D microenvironment rather than migration on a flat 2D surface.
-
RNA extraction experimental
By lysing cells, releasing RNA, and removing impurities such as proteins and DNA, high-purity RNA products are finally obtained. The commonly used traditional method is the guanidine isothiocyanate/phenol/chloroform method (Trizol), which is suitable for a variety of animal materials including animal tissues, microorganisms, cultured cells, etc., and most plant materials.
-
Ex Vivo Tissue Slice/Explant Invasion Assay
Ex vivo organotypic tissue slice cultures are based on maintaining thin, viable tissue sections at an air-liquid interface to preserve native cytoarchitecture and local cell-matrix interactions, enabling observation of cell behavior such as migration and tissue infiltration within a physiologically relevant 3D microenvironment. The method relies on maintaining tissue viability on porous membrane supports, allowing diffusion of nutrients and oxygen while preserving structural integrity for extended culture periods, which makes it suitable for studying dynamic cellular processes in intact tissue contexts such as cell movement and tissue remodeling. .
-
Mitochondrial membrane-potential fluorescent assay
Mitochondrial membrane potential fluorescent assays estimate ΔΨm in living cells using lipophilic cationic dyes such as TMRM, TMRE, rhodamine 123, and JC-1, which accumulate in mitochondria according to membrane polarization; loss of signal after FCCP or CCCP treatment is interpreted as mitochondrial depolarization. TMRM/TMRE and rhodamine 123 are commonly used for semi-quantitative live-cell microscopy or flow cytometry, while JC-1 can report a shift from red aggregate fluorescence to green monomer fluorescence during depolarization; interpretation requires controls because dye concentration, quenching mode, cell type, dye efflux, and mitochondrial mass can affect fluorescence independently of ΔΨm.
-
Patient-Derived Organoid Invasion Assay
Patient-derived organoid (PDO) invasion assays are based on the ability of epithelial tumor organoids to self-organize in three-dimensional extracellular matrix (ECM) hydrogels (commonly Matrigel) and to recapitulate key aspects of in vivo tissue architecture, including polarity, proliferation, and invasive outgrowth when exposed to permissive microenvironmental cues. In this system, invasion is operationally defined as the emergence of multicellular protrusions, collective budding, or single-cell dissemination from the organoid core into the surrounding ECM, reflecting epithelial-mesenchymal plasticity and matrix remodeling capacity. Organoid morphology and invasive behavior are typically monitored using brightfield or confocal microscopy over time, enabling quantitative assessment of invasion area, protrusion number, and structural disruption of the organoid spheroid architecture.
-
Annexin V plus membrane-impermeant dye apoptosis staining
Annexin V-based apoptosis assays rely on the detection of phosphatidylserine (PS) externalization from the inner leaflet of the plasma membrane to the outer leaflet, an early biochemical hallmark of apoptosis. Fluorescently labeled Annexin V binds PS in a calcium-dependent manner, enabling identification of early apoptotic cells by flow cytometry or fluorescence microscopy. When combined with a membrane-impermeant DNA-binding dye (e. g. , propidium iodide), this approach allows discrimination between viable (Annexin V−/dye−), early apoptotic (Annexin V+/dye−), and late apoptotic or necrotic (Annexin V+/dye+) cell populations by assessing membrane integrity and PS exposure.
-
Liver Cancer Modeling
Liver cancer can be classified into primary liver cancer and secondary liver cancer. Secondary liver cancer is the metastatic liver cancer. Primary liver cancer includes hepatocellular carcinoma (HCC), intrahepatic cholangiocarcinoma (ICC) and fibrolamellar HCC, of which HCC is the most common form, accounting for approximately 90% of primary liver cancers[1]. HCC mouse models include chemical agent-induced models, transplanted tumor models, and genetic engineered models.
-
3D Tumor Spheroid Invasion Assay
3D tumor spheroid invasion assay measures outward tumor-cell movement from a compact multicellular spheroid into a surrounding extracellular matrix, producing image-based readouts such as invasion area, invasion distance, cell dispersion, or time-resolved cell movement. The method models tumor-cell interaction with matrix components in three dimensions and is used to study invasive phenotypes in cancer models including glioblastoma, squamous cell carcinoma, breast cancer, prostate cancer, ovarian cancer, and other solid tumor systems.
-
Matrigel Transwell/Boyden Chamber Invasion Assay
Matrigel Transwell/Boyden chamber invasion assay measures the ability of cells to degrade or traverse an extracellular matrix-coated porous membrane and move from an upper chamber toward a chemoattractant in a lower chamber. Invasion is distinguished from migration by coating the membrane with Matrigel or basement membrane matrix; uncoated inserts measure migration, while coated inserts require cells to cross an ECM barrier before reaching the underside of the membrane.
-
Invadopodia/Fluorescent Gelatin Degradation Assay
Invadopodia/fluorescent gelatin degradation assay detects proteolytic extracellular matrix degradation by cancer-cell invadopodia, which are actin-rich protrusive structures associated with matrix remodeling, invasion, and metastasis. The readout is generated by culturing cells on fluorescent gelatin and measuring dark degraded areas where fluorescent substrate has been locally removed, often together with immunofluorescent detection of invadopodia markers such as F-actin, cortactin, and TKS5.
-
Apoptosis
Apoptosis, also called programmed cell death, is generally characterized by distinct morphological characteristics.
-
TUNEL staining for apoptotic DNA fragmentation
TUNEL staining detects DNA strand breaks by using terminal deoxynucleotidyl transferase to add labeled nucleotides to exposed 3′-OH DNA termini, generating either microscopic staining in fixed cells or tissue sections, or fluorescence/cytometric signal in cell suspensions. TUNEL positivity reflects DNA fragmentation but should not be interpreted alone as definitive apoptosis, because TUNEL can also label necrotic, autolytic, mechanically damaged, or DNA-repair-associated DNA breaks.
-
Mitochondrial membrane-potential and mitochondrial mass staining
Mitochondrial membrane potential staining measures the electrochemical polarization across the mitochondrial inner membrane in live cells using lipophilic cationic fluorescent probes; early rhodamine-based work showed that selective mitochondrial dye accumulation is lost when the mitochondrial transmembrane potential is dissipated. JC-1 reports mitochondrial polarization by shifting from green monomer fluorescence to red J-aggregate fluorescence as dye concentration increases within energized mitochondria; therefore, the red/green fluorescence ratio is used as a relative readout of mitochondrial membrane potential. TMRE or TMRM staining provides a single-channel relative readout because these cationic rhodamine esters accumulate in polarized mitochondria, and lower fluorescence indicates reduced mitochondrial polarization when acquisition and dye-loading conditions are controlled. Mitochondrial mass staining is commonly performed with MitoTracker Green FM or related MitoTracker dyes as
-
Organotypic 3D Invasion Assay
The organotypic 3D invasion assay measures carcinoma-cell invasion into a fibroblast-remodeled extracellular matrix, usually collagen I with or without basement-membrane matrix, under an air-liquid or grid-supported culture condition; the readout is invasion depth, invaded area, or an invasion index from histological or fluorescence images. This assay models stromal regulation of invasion because fibroblasts or CAFs remodel matrix, generate tracks, and can lead collective carcinoma-cell invasion; the resulting cancer-cell penetration into the gel reflects tumor-stroma-ECM interactions rather than migration on a rigid 2D substrate.
-
Apoptosis Solutions
Apoptosis is a regulated, generally non-lytic cell-death pathway that removes unwanted, damaged, infected, or abnormal cells through coordinated morphological changes, caspase activation, DNA fragmentation, and membrane remodeling. The intrinsic apoptosis pathway is controlled mainly by mitochondrial outer membrane permeabilization, BCL-2 family proteins, cytochrome c release, apoptosome formation, caspase-9 activation, and downstream executioner caspase-3/7 activation. The extrinsic apoptosis pathway is initiated by death receptors such as Fas, TNFR, and TRAIL receptors, which recruit adaptor proteins and activate caspase-8 before engaging executioner caspases or mitochondrial amplification through BID cleavage. Apoptosis is linked to many phenotypes, including cancer cell killing, tissue homeostasis, immune regulation, neurodegeneration, infection response, and treatment-induced cytotoxicity; unresolved questions include how apoptosis interacts with necroptosis, pyroptosis, ferroptos
-
Cell invasion
Cell invasion is the ability of cells to migrate from one area to another via the extracellular matrix. Cell invasion is the response of normal and cancer cells to chemical and mechanical stimuli. Before migrating to a new region, the extracellular matrix is degraded by proteases within the cell. Cell invasion often occurs during wound repair, vascularization and inflammation, abnormal tissue invasion, and tumor cell metastasis.
-
Matrigel/ECM Transwell Invasion Assay
The Matrigel/ECM Transwell invasion assay measures the ability of cells to move toward a chemoattractant while crossing an extracellular-matrix barrier placed on a porous membrane; therefore, the readout reflects both chemotactic motility and matrix invasion rather than migration alone. Matrigel is a basement-membrane-rich matrix derived from Engelbreth-Holm-Swarm mouse sarcoma and has been used as a reconstituted basement membrane barrier in chemoinvasion assays. The assay readout is generated by quantifying cells that reach the underside of the insert membrane or lower compartment after incubation, commonly by staining and counting invaded cells or by fluorescence-based quantification.
-
3D Collagen/Hydrogel Matrix Invasion Assay
The 3D collagen/hydrogel matrix invasion assay is based on embedding cells within or on top of a three-dimensional fibrillar extracellular matrix (typically type I collagen or collagen-rich hydrogels) to model cell migration through a physiologically relevant physical barrier. In this system, invasive behavior is quantified by measuring the ability of cells to degrade, remodel, and migrate through the 3D matrix architecture, which better reflects in vivo tissue invasion compared to 2D migration assays. Collagen-based 3D matrices provide structural cues such as fiber alignment and porosity that influence cell motility and integrin-mediated adhesion, enabling observation of collective or single-cell invasion modes depending on matrix density and organization.


Purity & Documentation
-
Data Sheet (304 KB)
-
SDS (252 KB)
- English - EN (252 KB)
- Français - FR (252 KB)
- Deutsch - DE (252 KB)
- Norwegian - NO (252 KB)
- Español - ES (252 KB)
- Swedish - SV (252 KB)
- Italian - IT (252 KB)
- Korean - KR (252 KB)
- Portuguese - PT (252 KB)
-
Handling Instructions (2659 KB)
References
[2]. Hsu CL, et al. Lucidenic acid B induces apoptosis in human leukemia cells via a mitochondria-mediated pathway. Journal of agricultural and food chemistry. 2008 Jun 11;56(11):3973-80. [Content Brief]
[3]. Akihisa T, et al. Anti-inflammatory and anti-tumor-promoting effects of triterpene acids and sterols from the fungus Ganoderma lucidum. Chemistry & biodiversity. 2007 Feb;4(2):224-31. [Content Brief]


Complete Stock Solution Preparation Table
Please refer to the solubility information to select the appropriate solvent. Once prepared, please aliquot and store the solution to prevent product inactivation from repeated freeze-thaw cycles.
Storage method and period of stock solution: -80°C, 6 months; -20°C, 1 month (protect from light). When stored at -80°C, please use it within 6 months. When stored at -20°C, please use it within 1 month.
| Optional Solvent | Concentration Solvent Mass | 1 mg | 5 mg | 10 mg | 25 mg |
|---|---|---|---|---|---|
| DMSO | 1 mM | 2.1071 mL | 10.5354 mL | 21.0708 mL | 52.6770 mL |
| 5 mM | 0.4214 mL | 2.1071 mL | 4.2142 mL | 10.5354 mL | |
| 10 mM | 0.2107 mL | 1.0535 mL | 2.1071 mL | 5.2677 mL | |
| 15 mM | 0.1405 mL | 0.7024 mL | 1.4047 mL | 3.5118 mL | |
| 20 mM | 0.1054 mL | 0.5268 mL | 1.0535 mL | 2.6339 mL | |
| 25 mM | 0.0843 mL | 0.4214 mL | 0.8428 mL | 2.1071 mL | |
| 30 mM | 0.0702 mL | 0.3512 mL | 0.7024 mL | 1.7559 mL | |
| 40 mM | 0.0527 mL | 0.2634 mL | 0.5268 mL | 1.3169 mL | |
| 50 mM | 0.0421 mL | 0.2107 mL | 0.4214 mL | 1.0535 mL | |
| 60 mM | 0.0351 mL | 0.1756 mL | 0.3512 mL | 0.8780 mL | |
| 80 mM | 0.0263 mL | 0.1317 mL | 0.2634 mL | 0.6585 mL | |
| 100 mM | 0.0211 mL | 0.1054 mL | 0.2107 mL | 0.5268 mL |


Lucidenic acid B Related Classifications
HY-N6861 Related Classifications
 Powered by Bioz