



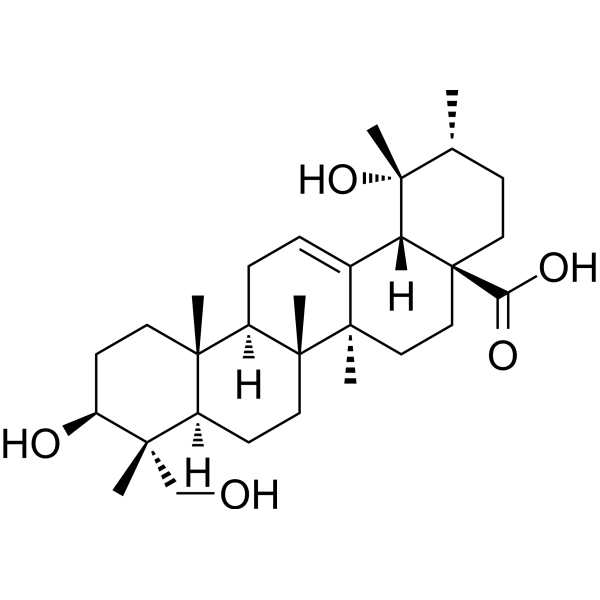
Rotundic acid

Based on 1 Customer Validation
Rotundic acid is an orally effective triterpenoid with a Kd value of 51.3 µM for PTP1B. Rotundic acid downregulates the AKT/mTOR pro-survival pathway and modulates the MAPK pathway. Rotundic acid induces cell cycle S-phase arrest, DNA damage and apoptosis; it inhibits migration, invasion, angiogenesis and proliferation of cancer cells. Rotundic acid improves leptin sensitivity, regulates gut microbiota and reduces cellular senescence. Rotundic acid can be used in research related to hepatocellular carcinoma, obesity, aging, acute lung injury and type 2 diabetes.
For research use only. We do not sell to patients.
- Purity : 98.41%
- CAS No.: 20137-37-5
- Formula: C30H48O5
- Molecular Weight:488.70
-
Storage:
4°C, protect from light
* In solvent : -80°C, 6 months; -20°C, 1 month (protect from light)

To place orders, for customer services and technical support, please contact: MedChemExpress USA
Tel: 609-228-6898 E-mail: [email protected] [email protected]


-
 Biological Activity
-
Chemical Information
-
Solvent & Solubility
- Protocols
- Purity & Documentation
- References
-
 Help & FAQs


-
HY-15174
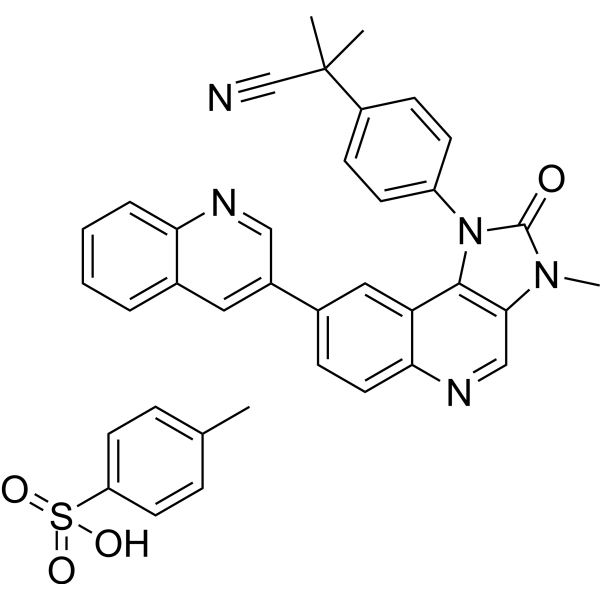
Dactolisib TosylateAutophagy Inducer -
HY-15431
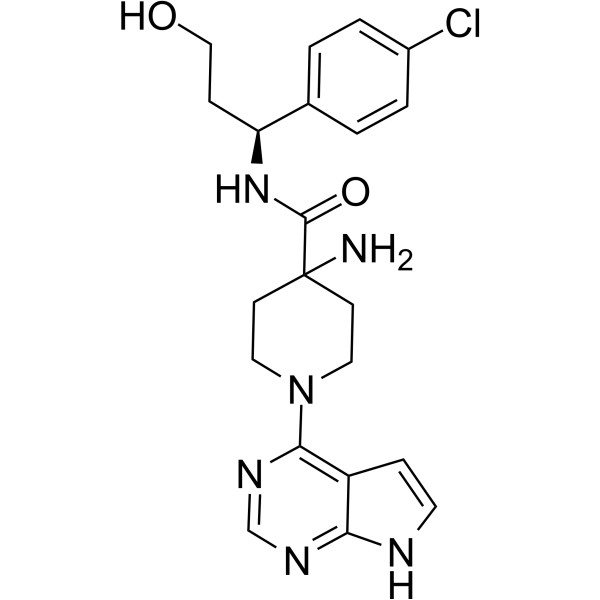
CapivasertibAkt Inhibitor -
HY-50673
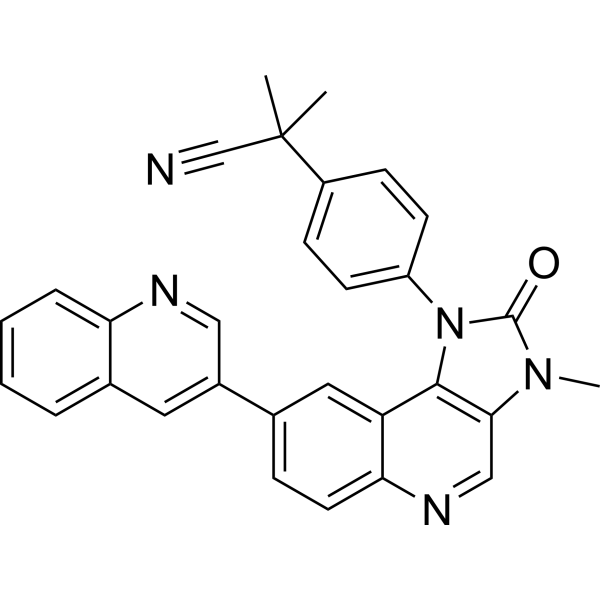
DactolisibPI3K/mTOR Inhibitor -
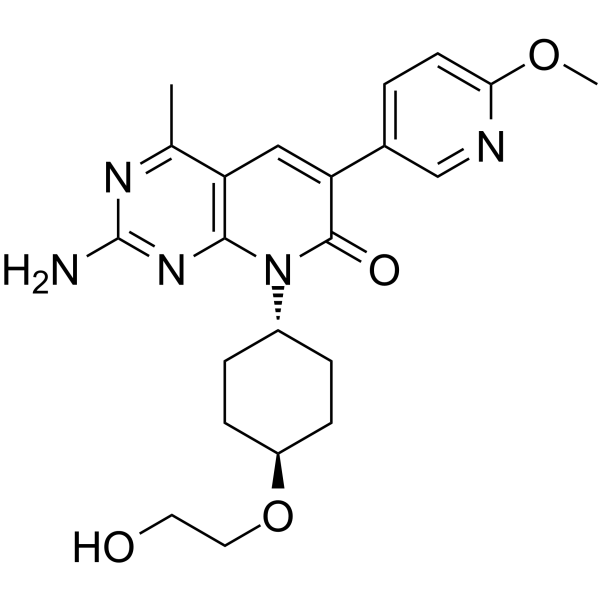
HY-15177
PF-04691502PI3K/mTOR Inhibitor -
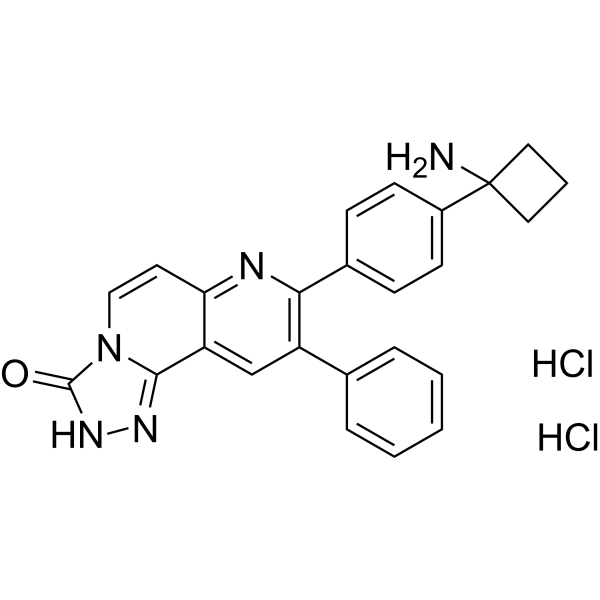
HY-10358
MK-2206 dihydrochlorideAllosteric Akt Inhibitor -
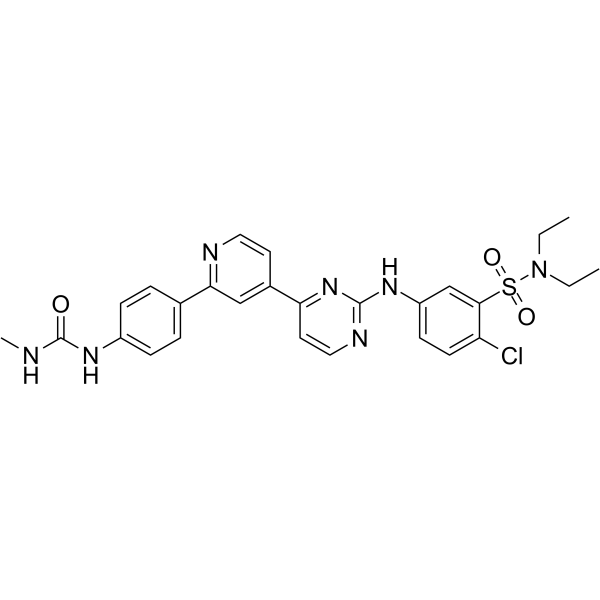
HY-124719
hSMG-1 inhibitor 11jhSMG-1 Inhibitor -
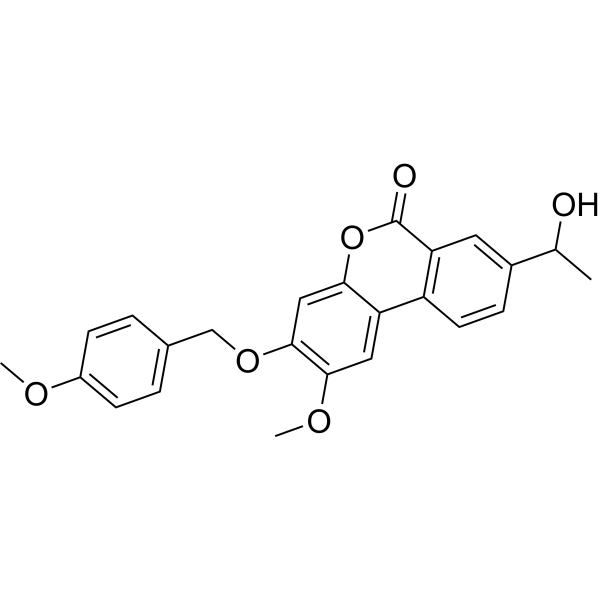
HY-14581
Palomid 529Apoptosis Inducer -
HY-50909
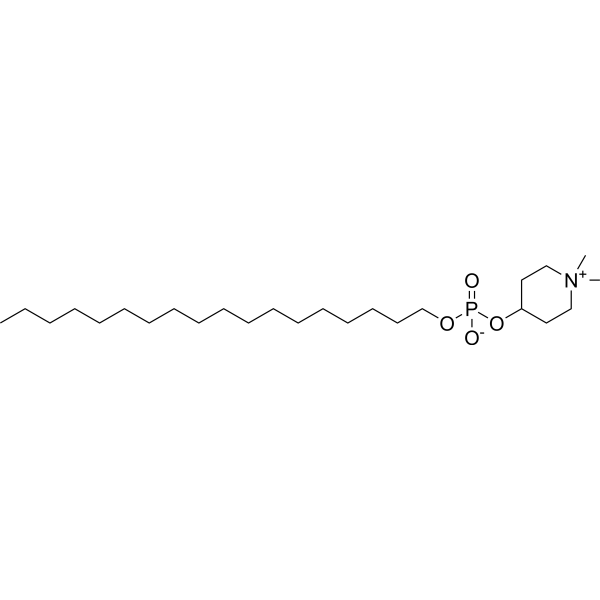
PerifosineAkt Inhibitor -
HY-13334A
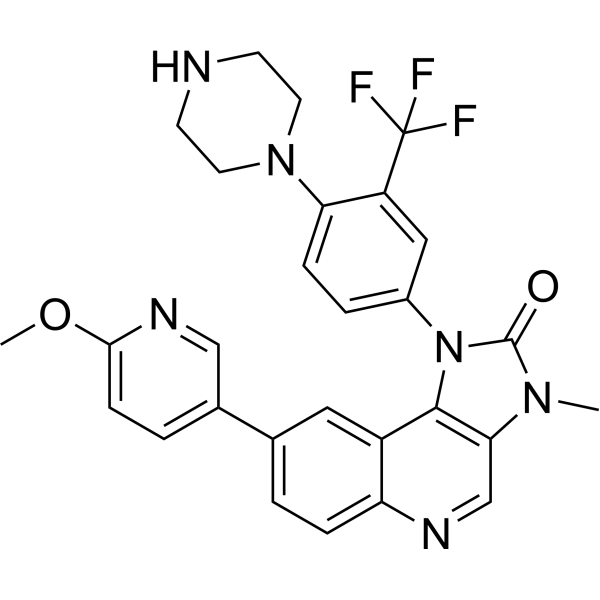
BGT226Autophagy Inducer -
HY-10355
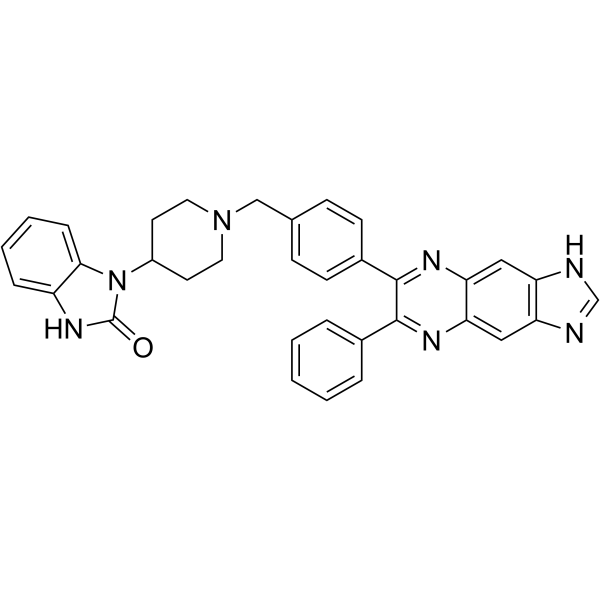
AKT inhibitor VIIIAKT Inhibitor -

HY-N2217R
Rotundic acid (Standard)Standard -
HY-10249
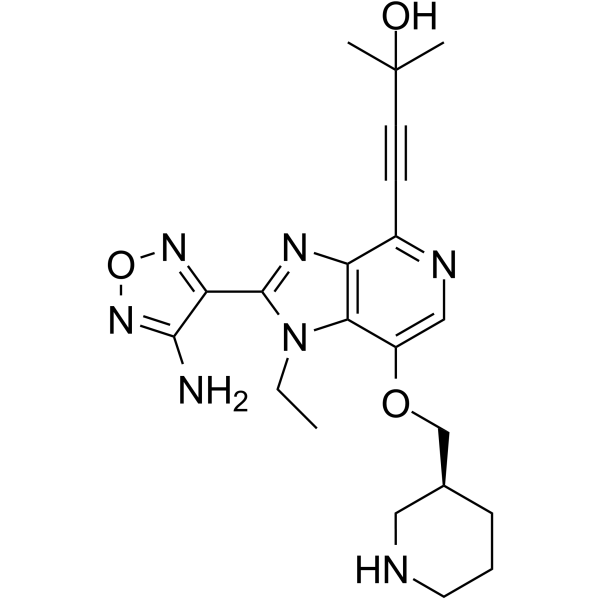
GSK-690693Akt Inhibitor


Biological Activity
Description
IC50 & Target
|
mTOR |
p38 MAPK |
Cellular Effect
|
Cell Line

|
Type | Value | Description | References |
|---|---|---|---|---|
| A-375 | IC50 |
16.58 μM
Compound: 1, RA, Rotundic acid
|
Cytotoxicity against human A375 cells after 24 hrs by MTT assay
Cytotoxicity against human A375 cells after 24 hrs by MTT assay
|
[PMID: 23558236] |
| HeLa | IC50 |
31.92 μM
Compound: 1, RA, Rotundic acid
|
Cytotoxicity against human HeLa cells after 24 hrs by MTT assay
Cytotoxicity against human HeLa cells after 24 hrs by MTT assay
|
[PMID: 23558236] |
| HepG2 | IC50 |
7.33 μM
Compound: 1, RA, Rotundic acid
|
Cytotoxicity against human HepG2 cells after 24 hrs by MTT assay
Cytotoxicity against human HepG2 cells after 24 hrs by MTT assay
|
[PMID: 23558236] |
| NCI-H446 | IC50 |
11.4 μM
Compound: 1, RA, Rotundic acid
|
Cytotoxicity against human NCI-H446 cells after 24 hrs by MTT assay
Cytotoxicity against human NCI-H446 cells after 24 hrs by MTT assay
|
[PMID: 23558236] |
In Vitro
Rotundic acid (10-30 μM) dose-dependently inhibits the migration of HUVEC cells[1].
Rotundic acid (0-1000 μM) is a non-competitive inhibitor of human PTP1B, whose optimal inhibitory effect depends on the C-terminus of this protein. The IC50 values against PTP1B1-298, PTP1B1-321 and PTP1B1-393 are 2 mM, 481.8 μM and 443.7 μM, respectively[2].
Rotundic acid (3.125-100 μM; 48 h) significantly extends the replicative lifespan of BY4741 yeast cells, with a maximum extension of up to 135% at the concentration of 12.5 μM[2].
Rotundic acid (5-20 μM; 24 h) reduces cellular senescence levels in senescent WI-38 human embryonic lung fibroblasts, as evidenced by a decrease in SA-β-gal-positive cells; it also promotes cell proliferation at a concentration of 12.5 μM[2].
Rotundic acid (15-60 μM; 24 h) shows no cytotoxicity against RAW264.7 mouse macrophages, and its concentration can reach up to 60 μM after 24 h of incubation[3].
Rotundic acid (15-60 μM; 1 h pretreatment) dose-dependently reduces nitrite production in LPS (HY-D1056)-stimulated RAW264.7 murine macrophages[3].
Rotundic acid (15-60 μM; 1 h pretreatment) inhibits LPS-induced release of TNF-α and IL-6 in RAW264.7 mouse macrophages[3].
Rotundic acid (15-60 μM; 1 h pretreatment) regulates multiple inflammatory signaling pathways in LPS-stimulated RAW264.7 murine macrophages, including inhibiting the activation of NF-κB, MAPK and PI3K/Akt/mTOR, upregulating the Keap-1/Nrf2/HO-1 signaling pathway and reducing the expression of TLR4[3].
Rotundic acid (15-60 μM; 1 h pretreatment) reduces LPS-induced NO release, ROS production and intracellular Ca2+ levels in RAW264.7 murine macrophages[3].
Rotundic acid exhibits significant cytotoxic activity against Daoy, Hep-2 and MCF-7 human tumor cell lines[4].
MedChemExpress (MCE) has not independently confirmed the accuracy of these methods. They are for reference only. Further protocols information, click here.
-
Cell Line:RAW264.7 murine macrophages
-
Concentration:15, 30, 60 μM
-
Incubation Time:24 h
-
Result:Showed no cytotoxic effect on RAW264.7 macrophages at all tested concentrations, with cell viability remaining above 80% relative to the control group.
-
Cell Line:LPS-stimulated RAW264.7 murine macrophages
-
Concentration:15-60 μM
-
Incubation Time:1 h pretreatment, followed by 18 h LPS stimulation
-
Result:Significantly decreased the release of TNF-α and IL-6 at all tested concentrations, with consistent, significant inhibition across doses.
Increased TNF-α and IL-6 release strongly when LPS was applied alone.
In Vivo
Rotundic acid (40 mg/kg; i.p.; 1 week per month for 6 consecutive months) extends the average lifespan of naturally aged male C57BL/6J mice by 16.2% and improves their aging-related functional indicators[2].
Rotundic acid (40 mg/kg; i.p.; once daily; for 14 consecutive days) reduces the body weight of high-fat diet-induced obese mice by up to 26.3% and decreases their food intake in a dose-dependent manner[2].
Rotundic acid (i.p.; 40 mg/kg; once daily for 14 consecutive days) reduces body weight by 25.1% in high-fat diet-induced obese mice with an average body weight of approximately 58 g, while also decreasing their food intake, reducing adipose tissue weight, and downregulating plasma leptin levels[2].
Rotundic acid (40 mg/kg; i.p.; once daily for 14 consecutive days) exerts no effect on body weight, food intake, or adipose tissue mass in normal lean male C57BL/6N mice[2].
Rotundic acid (40 mg/kg; i.p.; once daily for 14 consecutive days) improves glucose homeostasis and insulin sensitivity in high-fat diet-induced obese mice[2].
Rotundic acid (20-40 mg/kg; i.p.) reduces xylene-induced ear swelling in mice by more than 80% and ameliorates associated pathological tissue damage[3].
Rotundic acid (20-40 mg/kg; i.p.) increases the 144-hour survival rate of LPS-induced endotoxic shock mice to 30%[3].
Rotundic acid (10-40 mg/kg; i.p.) reduces LPS-induced levels of inflammatory markers, ameliorates pulmonary function impairment, and alleviates lung pathological damage in a mouse model of acute lung injury[3].
Rotundic acid (40 mg/kg; oral gavage; daily; 8 weeks) improves glucose and lipid metabolism, reduces blood pressure, protects against cardiovascular, hepatic and renal damage, alleviates oxidative stress and inflammatory responses, and restores gut microbiota dysbiosis induced by a high-fat diet combined with low-dose streptozotocin in type 2 diabetic rats[4].
MedChemExpress (MCE) has not independently confirmed the accuracy of these methods. They are for reference only.
-
Animal Model:Balb/c nude (male, 5 weeks old, subcutaneous HepG2 cell xenograft)[1]
-
Dosage:50 mg/kg
-
Administration:i.p.; every 2 days; 60 days
-
Result:Reduced mean tumor volume to 78.95 mm3 (vs. 323.64 mm3 in controls), achieving 75.6% tumor growth inhibition.
Reduced tumor weights significantly compared to controls.
Showed no significant body weight loss.
Reduced expression of proliferation marker Ki-67, angiogenesis marker CD-31, phosphorylated AKT, and phosphorylated mTOR in tumor tissue.
Increased expression of phosphorylated p38 MAPK in tumor tissue.
Induced apoptosis via increased cleaved PARP and cleaved caspase-3 in tumor tissue.
-
Animal Model:C57BL/6N (male, 8 weeks old, high-fat diet-induced obese)[2]
-
Dosage:40 mg/kg
-
Administration:i.p.; daily; 14 days
-
Result:Reduced body weight in a dose-dependent manner, with the 40 mg/kg dose causing a 26.3% decrease.
Reduced daily food intake by 62.3% in the first week of 40 mg/kg treatment.
-
Animal Model:BALB/c (male, 18-20 g, LPS-induced acute lung injury model)[3]
-
Dosage:10 mg/kg; 20 mg/kg; 40 mg/kg
-
Administration:i.p.; two doses: 2 hours before LPS, 4 hours after LPS
-
Result:Decreased LPS-induced increases in blood lymphocytes, neutrophils, and white blood cells.
Reduced levels of TNF-α, IL-6, and IL-1β in serum, bronchoalveolar lavage fluid, and lung tissue homogenate.
Reduced myeloperoxidase activity in lung tissue.
Significantly recovered mouse lung function including peak expiratory flow, dynamic lung compliance, inspiratory resistance, expiratory resistance, and minute ventilation volume.
Ameliorated LPS-induced alveolar interstitial exudation, alveolar structural destruction, and inflammatory cell infiltration observed via H&E staining.
-
Animal Model:Sprague-Dawley (5-week-old male, weight 180-220 g, type 2 diabetes induced by high-fat diet + low-dose streptozotocin)[4]
-
Dosage:40 mg/kg
-
Administration:i.g.; daily; 8 weeks
-
Result:Increased body weight compared to T2D model rats.
Decreased water intake and increased food intake compared to T2D model rats.
Reduced fasting glucose, glycated hemoglobin A1c (HbA1c), and insulin levels compared to T2D model rats.
Reduced glucose area under the curve (AUC) for OGTT and ITT, and reduced HOMA-IR index compared to T2D model rats.
Significantly reduced serum total glyceride (TG), total cholesterol (TC), low-density lipoprotein cholesterol (LDL-C), and free fatty acid (FFA) levels, and increased high-density lipoprotein cholesterol (HDL-C) levels compared to T2D model rats.
Reduced systolic blood pressure (SYS), diastolic blood pressure (DIA), mean arterial pressure (MAP), and serum angiotensin-2 (ANG-2) levels compared to T2D model rats.
Significantly reduced serum myocardial enzymes (α-HBDH: 151.9 U/L, CK: 0.418 U/L, CK-MB: 191.7 U/L, LDH: 1854.0 U/L), C-reactive protein (CRP: 422.7 pg/mL), endothelin-1 (ET-1: 48.9 pg/mL), alanine aminotransferase (ALT: 44.6 IU/L), aspartate aminotransferase (AST: 99.32 IU/L), alkaline phosphatase (ALP: 15.1 KU/100 mL), uric acid (UA: 131.0 μmol/L), and urea nitrogen (BUN: 5.3 mmol/L) compared to T2D model rats.
Increased serum superoxide dismutase (SOD: 246.7 U/L) and interleukin-4 (IL-4: 55.2 pg/mL) levels compared to T2D model rats.
Decreased serum malondialdehyde (MDA: 4.73 nmol/mL), tumor necrosis factor-α (TNF-α: 259.1 pg/mL), interferon-γ (INF-γ: 16.6 pg/mL), interleukin-1β (IL-1β: 11.0 pg/mL), and interleukin-6 (IL-6: 8.7 pg/mL) levels compared to T2D model rats.
Increased Chao1 and Shannon α-diversity indices compared to T2D model rats.
Reversed the elevated Firmicutes-to-Bacteroidetes ratio seen in T2D model rats.
Increased relative abundances of beneficial/commensal genera Prevotella, Ruminococcus, Leuconostoc, and Streptococcus compared to T2D model rats.
Decreased relative abundances of opportunistic pathogen genera Klebsiella and Proteus compared to T2D model rats.


Chemical Information
-
CAS No. 20137-37-5
-
Appearance Solid
-
Molecular Weight 488.70
-
Formula C30H48O5
-
Color White to off-white
-
SMILES
C[C@@]1(CO)[C@@H](O)CC[C@]2(C)[C@@]3([H])CC=C4[C@]5([H])[C@](C)(O)[C@H](C)CC[C@@](C(O)=O)5CC[C@](C)4[C@@](C)3CC[C@@]12[H]
-
Structure Classification
-
Shipping
Room temperature in continental US; may vary elsewhere.
-
Storage
4°C, protect from light
* In solvent : -80°C, 6 months; -20°C, 1 month (protect from light)


Solvent & Solubility
In Vitro:
DMSO : 100 mg/mL (204.62 mM; Need ultrasonic; Hygroscopic DMSO has a significant impact on the solubility of product, please use newly opened DMSO)
Please refer to the solubility information to select the appropriate solvent. Once prepared, please aliquot and store the solution to prevent product inactivation from repeated freeze-thaw cycles.
Storage method and period of stock solution: -80°C, 6 months; -20°C, 1 month (protect from light). When stored at -80°C, please use it within 6 months. When stored at -20°C, please use it within 1 month.
Please refer to the solubility information to select the appropriate solvent. Once prepared, please aliquot and store the solution to prevent product inactivation from repeated freeze-thaw cycles.
Storage method and period of stock solution: -80°C, 6 months; -20°C, 1 month (protect from light). When stored at -80°C, please use it within 6 months. When stored at -20°C, please use it within 1 month.
Concentration (start) × Volume (start) = Concentration (final) × Volume (final)
In Vivo:
Select the appropriate dissolution method based on your experimental animal and administration route.
- For the following dissolution methods, please ensure to first prepare a clear stock solution using an In Vitro approach and then sequentially add co-solvents:
- To ensure reliable experimental results, the clarified stock solution can be appropriately stored based on storage conditions. As for the working solution for In Vivo experiments, it is recommended to prepare freshly and use it on the same day.
- The percentages shown for the solvents indicate their volumetric ratio in the final prepared solution. If precipitation or phase separation occurs during preparation, heat and/or sonication can be used to aid dissolution.
Add each solvent one by one: 10% DMSO 40% PEG300 5% Tween-80 45% Saline
Solubility: 2.5 mg/mL (5.12 mM); Suspended solution; Need ultrasonic
This protocol yields a suspended solution of 2.5 mg/mL. Suspended solution can be used for oral and intraperitoneal injection.
Taking 1 mL working solution as an example, add 100 μL DMSO stock solution (25.0 mg/mL) to 400 μL PEG300, and mix evenly; then add 50 μL Tween-80 and mix evenly; then add 450 μL Saline to adjust the volume to 1 mL.
Preparation of Saline: Dissolve 0.9 g sodium chloride in ddH₂O and dilute to 100 mL to obtain a clear Saline solution.
Add each solvent one by one: 10% DMSO 90% (20% SBE-β-CD in Saline)
Solubility: 2.5 mg/mL (5.12 mM); Suspended solution; Need ultrasonic
This protocol yields a suspended solution of 2.5 mg/mL. Suspended solution can be used for oral and intraperitoneal injection.
Taking 1 mL working solution as an example, add 100 μL DMSO stock solution (25.0 mg/mL) to 900 μL 20% SBE-β-CD in Saline, and mix evenly.
Preparation of 20% SBE-β-CD in Saline (4°C, storage for one week): 2 g SBE-β-CD powder is dissolved in 10 mL Saline, completely dissolve until clear.
In Vivo Dissolution Calculator
Please enter the basic information of animal experiments:
-
-
-
-
Recommended: Prepare an additional quantity of animals to account for potential losses during experiments.
Please enter your animal formula composition:
-
%DMSO +
Recommended: Keep the proportion of DMSO in working solution below 2% if your animal is weak.
-
%+
-
+%Tween-80 + +
-
%Saline +
The co-solvents required include: DMSO, . All of co-solvents are available by MedChemExpress (MCE). , Tween 80. All of co-solvents are available by MedChemExpress (MCE).
Working solution concentration: 0.22 mg/mL
Method for preparing stock solution: mg drug dissolved in μL DMSO. Stock solution concentration: mg/mL. * In solvent : -80°C, 6 months; -20°C, 1 month (protect from light)
1. Take μL DMSO stock solution;
2. Add μL .
μL , mix evenly;
3. Then add μL Tween 80, mix evenly;
4. Then add μL
Please ensure that the stock solution in the first step is dissolved to a clear state, and add co-solvents in sequence. You can use ultrasonic heating (ultrasonic cleaner, recommended frequency 20-40 kHz), vortexing, etc. to assist dissolution.

Protocols
-
Human pluripotent stem cell endothelial-cell differentiation
Human pluripotent stem cell endothelial differentiation is based on stepwise developmental patterning: early activation of WNT/GSK3β inhibition promotes mesodermal or vascular progenitor entry, followed by endothelial specification using VEGF-related signaling, BMP4, FGF2, Notch modulation, or cAMP depending on the published protocol. Endothelial differentiation is read out by acquisition of CD31, CD34, VE-cadherin/CD144, KDR/VEGFR2, vWF, Tie2, NOS3, acetylated LDL uptake, tube/network formation, barrier function, and in vivo vessel-forming capacity where tested.
-
Vascular/Branching Fractal Analysis
Vascular/branching fractal analysis quantifies the geometric complexity of vessel trees or vascular networks from segmented 2D images, commonly by converting vessels into binary and/or skeletonized maps and estimating fractal dimension using box-counting or related approaches. Fractal dimension is interpreted as an image-derived readout of vascular branching complexity, space filling, or density, and has been applied to retinal photographs, fluorescein angiography, OCT angiography, capillary perfusion maps, and in vitro Matrigel angiogenesis networks. The assay readout is generated from vessel-positive pixels after image preprocessing, vessel segmentation, binarization, and optional skeletonization; reported outputs include fractal dimension, vessel density, branchpoint density, endpoint density, vessel length density, tortuosity, and generation-based branching metrics when VESGEN-style analysis is used. The biological interpretation is limited to quantitative vascular patterning and s
-
Annexin V plus membrane-impermeant dye apoptosis staining
Annexin V-based apoptosis assays rely on the detection of phosphatidylserine (PS) externalization from the inner leaflet of the plasma membrane to the outer leaflet, an early biochemical hallmark of apoptosis. Fluorescently labeled Annexin V binds PS in a calcium-dependent manner, enabling identification of early apoptotic cells by flow cytometry or fluorescence microscopy. When combined with a membrane-impermeant DNA-binding dye (e. g. , propidium iodide), this approach allows discrimination between viable (Annexin V−/dye−), early apoptotic (Annexin V+/dye−), and late apoptotic or necrotic (Annexin V+/dye+) cell populations by assessing membrane integrity and PS exposure.
-
BrdU Incorporation Assay
Bromodeoxyuridine (BrdU) incorporation assay is based on the principle that BrdU, a thymidine analog, is incorporated into newly synthesized DNA during the S phase of the cell cycle, thereby serving as a marker of DNA replication and cellular proliferation. Incorporated BrdU can be detected using anti-BrdU antibodies following DNA denaturation, enabling visualization or quantification of proliferating cells through immunochemical detection methods such as immunofluorescence or immunohistochemistry.
-
Cell migration
Cell migration is a method that plays an important role in wound healing, cell differentiation, embryonic development, etc.
-
Research Protocol for Microbiome Analysis
Microbiome analysis characterizes microbial communities in biological or environmental samples by measuring community composition, diversity, taxonomic structure, functional potential, and associations with host or environmental phenotypes. 16S rRNA gene amplicon sequencing is commonly used for bacterial and archaeal taxonomic profiling, while shotgun metagenomics provides higher taxonomic resolution and direct functional information, including microbial genes, pathways, viruses, fungi, and antimicrobial-resistance genes when sequencing depth and host-DNA contamination are adequately controlled. Microbiome results are strongly affected by sample collection, storage, DNA extraction, contamination, sequencing method, reference database, and bioinformatic pipeline; therefore, standardized protocols, negative controls, mock communities, and transparent analysis workflows are required. Unresolved issues include low-biomass contamination, compositional-data bias, inconsistent species-level c
-
Protocol for Cell Cycle
Cell-cycle analysis by flow cytometry measures DNA content in single cells to estimate the fraction of cells in G0/G1, S, and G2/M phases. Propidium iodide intercalates into DNA, and after RNA removal with RNase, fluorescence intensity reflects cellular DNA content: 2N cells are assigned to G0/G1, cells between 2N and 4N to S phase, and 4N cells to G2/M. DNA-content analysis alone cannot reliably separate G0 from G1 or G2 from M. Ki-67 can distinguish quiescent G0 cells from cycling cells, EdU or BrdU incorporation marks active DNA synthesis in S phase, and phospho-histone H3 staining identifies mitotic cells within the 4N population.
-
Liver Cancer Modeling
Liver cancer can be classified into primary liver cancer and secondary liver cancer. Secondary liver cancer is the metastatic liver cancer. Primary liver cancer includes hepatocellular carcinoma (HCC), intrahepatic cholangiocarcinoma (ICC) and fibrolamellar HCC, of which HCC is the most common form, accounting for approximately 90% of primary liver cancers[1]. HCC mouse models include chemical agent-induced models, transplanted tumor models, and genetic engineered models.
-
Research Protocol for Metabolic Diseases
AMP-activated protein kinase, AMPK, is a conserved cellular energy sensor that responds to reduced cellular energy status and coordinates metabolism by increasing ATP-generating catabolic pathways while suppressing ATP-consuming anabolic processes. In metabolic disease research, the AMPK pathway is experimentally relevant because it regulates hepatic lipid synthesis, fatty acid oxidation, glucose production, skeletal-muscle glucose disposal, mTORC1-linked biosynthesis, autophagy, mitochondrial homeostasis, and whole-body energy balance. The central pathway logic is that energy stress, metformin, exercise-like stimulation, or direct AMPK activators increase AMPKα Thr172 phosphorylation and downstream substrate phosphorylation, including ACC and RAPTOR. Phosphorylation of ACC suppresses lipogenesis and supports fatty acid oxidation, whereas phosphorylation of RAPTOR suppresses mTORC1 signaling and links cellular energy status to growth and protein synthesis control. The pathway is linked
-
Senescence-associated β-galactosidase staining
Senescence-associated β-galactosidase staining detects β-galactosidase activity that is histochemically visible at pH 6. 0 in senescent cells, where X-gal cleavage produces an insoluble blue precipitate observable by bright-field microscopy. This activity reflects increased lysosomal β-galactosidase/lysosomal mass rather than a senescence-essential enzyme, because GLB1 depletion or genetic lysosomal β-galactosidase deficiency can abolish SA-β-gal staining while cells still undergo senescence. SA-β-gal was originally reported in senescent but not presenescent fibroblasts and keratinocytes, absent from quiescent fibroblasts and terminally differentiated keratinocytes, and increased with donor age in human skin samples. Because SA-β-gal can also appear in some non-senescent or tissue-specific contexts, interpretation should be paired with experimental controls and, when possible, independent senescence markers.
-
Cell Viability Determination by MTT Colorimetric Assay
The following protocol uses the MTT colorimetric assay as a classic literature-established method for assessing cell viability/metabolic activity in cultured mammalian cells. MTT[3-(4,5-dimethylthiazol-2-yl)-2,5-diphenyltetrazolium bromide] is reduced by metabolically active cells to a colored formazan product; the amount of formazan is quantified spectrophotometrically and provides an indirect measure of metabolically active viable cells. Importantly, MTT reduction reflects cellular oxidoreductase/metabolic activity rather than an absolute direct count of living cells, so changes in cellular metabolism can alter the signal independently of cell number.
-
Apoptosis
Apoptosis, also called programmed cell death, is generally characterized by distinct morphological characteristics.
-
TUNEL staining for apoptotic DNA fragmentation
TUNEL staining detects DNA strand breaks by using terminal deoxynucleotidyl transferase to add labeled nucleotides to exposed 3′-OH DNA termini, generating either microscopic staining in fixed cells or tissue sections, or fluorescence/cytometric signal in cell suspensions. TUNEL positivity reflects DNA fragmentation but should not be interpreted alone as definitive apoptosis, because TUNEL can also label necrotic, autolytic, mechanically damaged, or DNA-repair-associated DNA breaks.
-
Flow cytometric DNA-content cell-cycle staining
Flow cytometric DNA-content cell-cycle staining measures the fluorescence intensity of DNA-bound fluorochromes in single cells or nuclei to estimate DNA content distributions, allowing assignment of populations to G0/G1, S, and G2/M phases by DNA histogram deconvolution. Propidium iodide (PI) intercalates into DNA, and PI fluorescence is proportional to cellular DNA content when staining is performed under conditions that make DNA accessible and minimize non-DNA signal. Cells with G2/M DNA content are expected to show approximately twice the fluorescence intensity of G0/G1 cells, while S-phase cells occupy intermediate fluorescence values. PI-based DNA-content analysis can also detect cells with fractional DNA content, often reported as sub-G1, when DNA fragmentation and extraction during staining reduce retained DNA signal in apoptotic cells. DAPI is an alternative DNA fluorochrome for univariate DNA-content analysis, while bivariate approaches combining DNA content with proliferation
-
Endothelial Tube Formation Assay
Endothelial tube formation assay evaluates the ability of endothelial cells to attach, migrate, align, and organize into capillary-like networks when cultured on gelled basement membrane extract or Matrigel; the readout is the morphology and quantity of tube-like networks, which reflects an in vitro endothelial morphogenesis step related to angiogenesis. Basement membrane extract/Matrigel provides laminin-rich extracellular matrix cues that support endothelial differentiation into capillary-like structures, but it can contain biologically active growth factors, so growth-factor-reduced matrix is preferred when testing defined angiogenic stimulators or inhibitors.
-
Apoptosis Solutions
Apoptosis is a regulated, generally non-lytic cell-death pathway that removes unwanted, damaged, infected, or abnormal cells through coordinated morphological changes, caspase activation, DNA fragmentation, and membrane remodeling. The intrinsic apoptosis pathway is controlled mainly by mitochondrial outer membrane permeabilization, BCL-2 family proteins, cytochrome c release, apoptosome formation, caspase-9 activation, and downstream executioner caspase-3/7 activation. The extrinsic apoptosis pathway is initiated by death receptors such as Fas, TNFR, and TRAIL receptors, which recruit adaptor proteins and activate caspase-8 before engaging executioner caspases or mitochondrial amplification through BID cleavage. Apoptosis is linked to many phenotypes, including cancer cell killing, tissue homeostasis, immune regulation, neurodegeneration, infection response, and treatment-induced cytotoxicity; unresolved questions include how apoptosis interacts with necroptosis, pyroptosis, ferroptos
-
Cell invasion
Cell invasion is the ability of cells to migrate from one area to another via the extracellular matrix. Cell invasion is the response of normal and cancer cells to chemical and mechanical stimuli. Before migrating to a new region, the extracellular matrix is degraded by proteases within the cell. Cell invasion often occurs during wound repair, vascularization and inflammation, abnormal tissue invasion, and tumor cell metastasis.
-
Inhalation Toxicity Study
Inhalation toxicity studies expose rodents to a controlled aerosol, vapor, gas, or smoke atmosphere and assess respiratory and systemic toxicity using exposure-atmosphere characterization, clinical observations, body and organ weights, bronchoalveolar lavage fluid, histopathology, blood chemistry, hematology, and, when included, molecular endpoints such as transcriptomics, proteomics, lipidomics, or tissue burden analysis. The primary biological readouts are airway irritation, pulmonary inflammation, cytotoxicity, altered surfactant or lipid homeostasis, impaired particle clearance, and tissue remodeling, reflected by BALF cell differentials, BALF protein, LDH, phosphatase activities, cytokines, lung weight, microscopic respiratory-tract lesions, and retained lung burden.
-
Genotoxicity/Mutagenicity Study
The bacterial reverse mutation assay detects point mutations that restore amino-acid prototrophy in auxotrophic Salmonella typhimurium or Escherichia coli tester strains; after exposure to a test article, mutagenic activity is read out as an increased number of revertant colonies on minimal agar compared with the vehicle control. The assay uses tester strains with different mutation targets so that base-substitution and frameshift mutagens can be detected, and testing is performed with and without exogenous mammalian metabolic activation because some chemicals require biotransformation to become mutagenic.
-
Endothelial Cell Migration/Angiogenic Sprouting Assay
Endothelial cell migration and angiogenic sprouting assays are in vitro (and partially ex vivo-adapted) functional models that quantify the ability of endothelial cells to undergo coordinated migration, extracellular matrix invasion, and multicellular organization into capillary-like sprouts in response to pro-angiogenic stimuli such as VEGF, bFGF, or conditioned microenvironments. These assays are used to model early angiogenic events including tip-cell formation, directional migration, and lumen-like sprout extension, which collectively reflect angiogenic activation and vascular morphogenesis processes observed in vivo.


Purity & Documentation
-
Data Sheet (293 KB)
-
SDS (252 KB)
- English - EN (252 KB)
- Français - FR (252 KB)
- Deutsch - DE (252 KB)
- Norwegian - NO (252 KB)
- Español - ES (252 KB)
- Swedish - SV (252 KB)
- Italian - IT (252 KB)
- Korean - KR (252 KB)
- Portuguese - PT (252 KB)
-
Handling Instructions (2659 KB)
References
[1]. Roy G, et al. Rotundic Acid Induces DNA Damage and Cell Death in Hepatocellular Carcinoma Through AKT/mTOR and MAPK Pathways. Front Oncol. 2019;9:545. Published 2019 Jun 26. [Content Brief]
[2]. Zhu J, et al. The natural product rotundic acid treats both aging and obesity by inhibiting PTP1B. Life Med. 2022;1(3):372-386. Published 2022 Oct 26. [Content Brief]
[3]. Li XX, et al. Rotundic acid reduces LPS-induced acute lung injury in vitro and in vivo through regulating TLR4 dimer. Phytother Res. 2021;35(8):4485-4498. [Content Brief]
[4]. Yan Z, et al. Rotundic Acid Protects against Metabolic Disturbance and Improves Gut Microbiota in Type 2 Diabetes Rats. Nutrients. 2019;12(1):67. Published 2019 Dec 26. [Content Brief]


Complete Stock Solution Preparation Table
Please refer to the solubility information to select the appropriate solvent. Once prepared, please aliquot and store the solution to prevent product inactivation from repeated freeze-thaw cycles.
Storage method and period of stock solution: -80°C, 6 months; -20°C, 1 month (protect from light). When stored at -80°C, please use it within 6 months. When stored at -20°C, please use it within 1 month.
| Optional Solvent | Concentration Solvent Mass | 1 mg | 5 mg | 10 mg | 25 mg |
|---|---|---|---|---|---|
| DMSO | 1 mM | 2.0462 mL | 10.2312 mL | 20.4625 mL | 51.1561 mL |
| 5 mM | 0.4092 mL | 2.0462 mL | 4.0925 mL | 10.2312 mL | |
| 10 mM | 0.2046 mL | 1.0231 mL | 2.0462 mL | 5.1156 mL | |
| 15 mM | 0.1364 mL | 0.6821 mL | 1.3642 mL | 3.4104 mL | |
| 20 mM | 0.1023 mL | 0.5116 mL | 1.0231 mL | 2.5578 mL | |
| 25 mM | 0.0818 mL | 0.4092 mL | 0.8185 mL | 2.0462 mL | |
| 30 mM | 0.0682 mL | 0.3410 mL | 0.6821 mL | 1.7052 mL | |
| 40 mM | 0.0512 mL | 0.2558 mL | 0.5116 mL | 1.2789 mL | |
| 50 mM | 0.0409 mL | 0.2046 mL | 0.4092 mL | 1.0231 mL | |
| 60 mM | 0.0341 mL | 0.1705 mL | 0.3410 mL | 0.8526 mL | |
| 80 mM | 0.0256 mL | 0.1279 mL | 0.2558 mL | 0.6395 mL | |
| 100 mM | 0.0205 mL | 0.1023 mL | 0.2046 mL | 0.5116 mL |


Rotundic acid Related Classifications
HY-N2217 Related Classifications
 Powered by Bioz
Keywords
- Rotundic acid
- 20137-37-5
- Akt
- mTOR
- p38 MAPK
- Apoptosis
- Phosphatase
- Interleukin Related
- NF-κB
- PI3K
- Keap1-Nrf2
- Heme Oxygenase (HO)
- Toll-like Receptor (TLR)
- Reactive Oxygen Species (ROS)
- hepatocellular carcinoma
- BY4741 yeast cells
- MAPK pathway
- Caco-2 cells
- WI-38 human embryonic lung fibroblast cells
- HUVEC cells
- PTP1B
- RAW264.7 murine macrophages
- AKT/mTOR pro-survival pathway
- HepG2 xenograft Balb/c nude mouse model
- Inhibitor
- inhibitor
- inhibit