



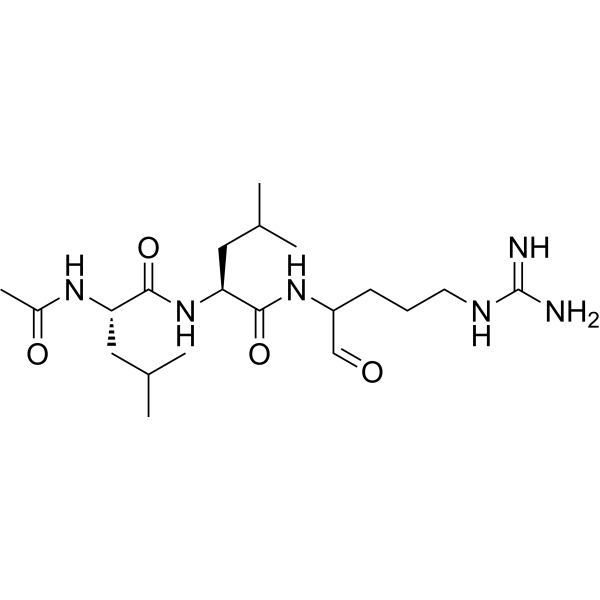
Leupeptin Ac-LL
Leupeptin Ac-LL is a broad-spectrum protease inhibitor. By inhibiting the activation of the PTEN/PI3K/Akt/NF-κB/ERK1/2/p38 signaling pathway, Leupeptin Ac-LL significantly reduces LPS-induced NO and ROS production, mitochondrial membrane potential hyperpolarization, phagocytic activity, pro-inflammatory cytokine release, and M1 polarization in mouse peritoneal macrophages, and reverses autophagic flux impairment. It also decreases Concanavalin A (HY-P2149)-induced proliferation index of mouse splenic lymphocytes and the Th1/IL-10 and Th2/IL-10 cytokine ratios, thereby modulating innate and adaptive immune responses. Leupeptin Ac-LL inhibits blood coagulation and tumorigenesis in mouse skin. Leupeptin Ac-LL can be used in research on chronic inflammatory diseases and skin tumorigenesis.
For research use only. We do not sell to patients.
- CAS No.: 24365-47-7
- Formula: C20H38N6O4
- Molecular Weight:426.55
-
Storage:
Please store the product under the recommended conditions in the Certificate of Analysis.

To place orders, for customer services and technical support, please contact: MedChemExpress USA
Tel: 609-228-6898 E-mail: [email protected] [email protected]


-
 Biological Activity
-
Chemical Information
- Protocols
- Purity & Documentation
- References
-
 Help & FAQs


All Cathepsin Isoforms
More

Biological Activity
Description
|
SARS-CoV-2 Mpro 127.2 μM (IC50) |
Kallikrein 70-75 μg/mL (IC50) |
Plasmin 6-100 μg/mL (IC50) |
Thrombokinase 15-18 μg/mL (IC50) |
papain 0.03-0.51 μg/mL (IC50) |
trypsin 0.1-136 μg/mL (IC50) |
PI3K |
ERK1 |
NF-κB |
iNOS |
Akt |
HTRA1 |
COX-2 |
Threonine Protease |
Cysteine Protease |
ERK2 |
LC3B |
Beclin-1 |
p62 |
Arg 1 |
Msr 1 |
Mrc−1 |
p-PTEN |
In Vitro
Leupeptin (50-200 µM; 3.5 h) Ac-LL significantly reduces LPS-induced NO and ROS production, mitochondrial membrane potential hyperpolarization, phagocytic activity, pro-inflammatory cytokine release, and M1 polarization in mouse peritoneal macrophages, and reverses autophagic flux impairment, with its mechanism associated with the inhibition of PTEN/PI3K/Akt/NF-κB/ERK1/2/p38 signaling pathway activation[1].
Leupeptin (50-200 µM; 48 h) Ac-LL reduces the Con-A (Concanavalin A) (HY-P2149)-induced proliferation index of mouse splenic lymphocytes and significantly decreases the Th1/IL-10 and Th2/IL-10 cytokine ratios, thereby modulating adaptive immune responses[1].
MedChemExpress (MCE) has not independently confirmed the accuracy of these methods. They are for reference only.
-
Cell Line:Peritoneal macrophages
-
Concentration:50 μM; 100 μM; 200 μM
-
Incubation Time:3.5 h
-
Result:Reduced LPS-induced intracellular ROS accumulation.
Reversed LPS-induced mitochondrial membrane potential hyperpolarization.
Reduced LPS-enhanced macrophage phagocytic activity.
-
Cell Line:Peritoneal macrophages
-
Concentration:50 μM; 100 μM; 200 μM
-
Incubation Time:3.5 h
-
Result:Reduced the LPS-induced increases in TNF-α, IL-1β, IFN-γ, and IL-6.
-
Cell Line:Peritoneal macrophages
-
Concentration:50 μM; 100 μM; 200 μM
-
Incubation Time:3.5 h
-
Result:Reduced the LPS-induced elevation of iNOS, Cox-2, IL-17, IL-15, and IL-5 mRNA levels.
Reduced LPS-induced mRNA expression of MMP-1, MMP-3, and MMP-9.
-
Cell Line:Peritoneal macrophages
-
Concentration:50 μM; 100 μM; 200 μM
-
Incubation Time:3.5 h
-
Result:Reduced the LPS-induced elevations of p-PTEN, p-PI3K, p-Akt, p-NF-κB, p-ERK1/2, and p-p38.
-
Cell Line:Splenic lymphocytes
-
Concentration:50 μM; 100 μM; 200 μM
-
Incubation Time:48 h
-
Result:Reduced the Con-A-induced lymphocyte proliferation index.
-
Cell Line:Splenic lymphocytes
-
Concentration:50 μM; 100 μM; 200 μM
-
Incubation Time:48 h
-
Result:Reduced Con-A-induced levels of TNF-α and IFN-γ, as well as the TNF-α/IL-10 and IFN-γ/IL-10 ratios.
In Vivo
Leupeptin (40 mg/kg; i.p.; single dose; sacrificed 3 h post-injection) Ac-LL detects a 45% increase in macroautophagic flux in calorie-starved mouse liver and significant suppression of flux in refed mouse liver, with a 3-hour flux value of 53.94 ng/mg total protein in starved mice[3].
Leupeptin (40 mg/kg; i.p.; single dose; sacrificed 60 min or 180 min post-injection) Ac-LL detects a significant reduction in p62 flux (but not statistically significant reduction in LC3b-II flux) in beclin 1+/- mouse liver compared to wild-type littermates, with an 180-minute p62 flux value of 18 ng/mg total protein in heterozygous mice[3].
MedChemExpress (MCE) has not independently confirmed the accuracy of these methods. They are for reference only.
-
Animal Model:C57BL/6NCrl (male, 6-8 weeks old, 20-25 g)[3]
-
Dosage:9 mg/kg; 18 mg/kg; 20 mg/kg; 36 mg/kg; 40 mg/kg
-
Administration:i.p.; single dose; sacrificed 1 h, 4 h, 60 min, 90 min, 120 min, 180 min, or 240 min post-injection; administered 60 min prior to cycloheximide injection, sacrificed 60 min post-cycloheximide injection
-
Result:Produced a dose-dependent increase in LC3b-II levels in mouse liver total extracts and lysosome-enriched (LE) fractions, with the 36 mg/kg dose inducing the strongest signal.
Led to time-dependent LC3b-II accumulation across multiple organs, with liver reaching 69.1 ng/mg total protein in LE fractions at 60 min, a flux of 42.1 ng/mg total protein, and spleen reaching 37.1 ng/mg total protein in LE fractions at 60 min, a flux of 11.0 ng/mg total protein.
Increased LC3a-II and p62 levels in liver LE fractions, but did not increase levels of GABARAP or GATE-16.
Induced a 6.88-fold increase in cross-sectional area of late autophagosome/lysosomal compartments in hepatocytes (from 0.36% to 2.50% of total cytoplasmic area; p = 0.013), with this increase correlating with LC3b-II levels in LE fractions (R2 = 0.7741).
Increased LC3b-II and LC3a-II content in dense, lysosome-enriched fractions of lung homogenates.
Stabilized LC3b-II and LC3a-II levels in liver LE fractions (but not cytosolic fractions) following cycloheximide-induced translational inhibition.
-
Animal Model:C57BL/6NCrl (male, 6-8 weeks old, 20-25 g)[3]
-
Dosage:40 mg/kg
-
Administration:i.p.; single dose; sacrificed 1 h or 3 h post-injection
-
Result:Induced an LC3b-II flux of 37.21 ng/mg total protein at 3 h post-injection in ad libitum-fed mice.
Induced an LC3b-II flux of 53.94 ng/mg total protein at 3 h post-injection in calorie-starved mice, representing a 45% increase compared to ad libitum-fed mice (p = 0.04).
Induced an LC3b-II flux of only 3.00 ng/mg total protein at 3 h post-injection in refed mice, significantly suppressed compared to ad libitum-fed mice (p < 0.001).
-
Animal Model:Beclin 1+/+; beclin 1+/- (male, 6-8 weeks old)[3]
-
Dosage:40 mg/kg
-
Administration:i.p.; single dose; sacrificed 60 min or 180 min post-injection
-
Result:Showed an LC3b-II flux of ~25 ng/mg total protein in beclin 1+/- mice at 60 min post-injection, compared to ~38 ng/mg total protein in beclin 1+/+ mice (no statistical significance reported).
Showed an LC3b-II flux of ~56 ng/mg total protein in beclin 1+/- mice at 180 min post-injection, compared to ~73 ng/mg total protein in beclin 1+/+ mice (no statistical significance reported).
Showed a p62 flux of ~4 ng/mg total protein in beclin 1+/- mice at 60 min post-injection, compared to ~2 ng/mg total protein in beclin 1+/+ mice.
Showed a p62 flux of ~18 ng/mg total protein in beclin 1+/- mice at 180 min post-injection, compared to ~35 ng/mg total protein in beclin 1+/+ mice (p < 0.05).
- Phagocytosis Functional Assay
- Mitochondrial membrane-potential fluorescent assay
- Ki-67 Immunostaining Proliferation Assay
- Naïve CD4+ T-cell subset differentiation/polarization
- ROS/oxidative-stress fluorescent staining
- Fluorescent plasma-membrane potential dye assay
- Mitochondrial membrane-potential and mitochondrial mass staining
- Autophagy
- Research Protocol for Inflammation-related Diseases
- Macroautophagy Solutions
- Cell Viability Determination by MTT Colorimetric Assay


Chemical Information
-
CAS No. 24365-47-7
-
Molecular Weight 426.55
-
Formula C20H38N6O4
-
Shipping
Room temperature in continental US; may vary elsewhere.
-
Storage
Please store the product under the recommended conditions in the Certificate of Analysis.


Purity & Documentation
References
[1]. Sharma A, et al. Leupeptin maintains redox homeostasis via targeting ROS-autophagy-inflammatory axis in LPS-stimulated macrophages and cytokines dichotomy in Con-A challenged lymphocyte. Peptides. 2023 Oct;168:171066. [Content Brief]
[2]. Hozumi M, et al. Inhibition of tumorigenesis in mouse skin by leupeptin, a protease inhibitor from Actinomycetes. Cancer Res. 1972 Aug;32(8):1725-8. [Content Brief]
[3]. Haspel J, et al. Characterization of macroautophagic flux in vivo using a leupeptin-based assay. Autophagy. 2011 Jun;7(6):629-42. [Content Brief]
[4]. Billinger E, et al. Inhibition properties of free and conjugated leupeptin analogues. FEBS open bio. 2020 Dec;10(12):2605-2615. [Content Brief]

Calculators
Concentration (start) × Volume (start) = Concentration (final) × Volume (final)


Leupeptin Ac-LL Related Classifications
HY-18234B Related Classifications
 Powered by Bioz
Keywords
- Leupeptin Ac-LL
- 24365-47-7
- Ser/Thr Protease
- Cathepsin
- Autophagy
- SARS-CoV
- Atg8/LC3
- NO Synthase
- COX
- p62
- Arginase
- PTEN
- NF-κB
- PI3K
- Akt
- p38 MAPK
- ERK
- Reactive Oxygen Species (ROS)
- kallikrein
- cathepsins B
- L
- and H
- LPS-induced mitochondrial membrane potential hyperpolarization
- mouse skin
- papain
- chymotrypsin
- mouse hepatocytes
- trypsin
- beclin 1+/- mouse liver
- plasmin
- Inhibitor
- inhibitor
- inhibit