



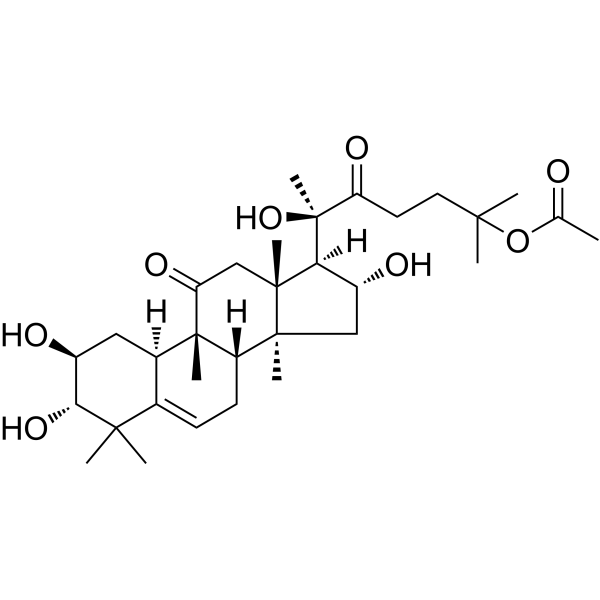
Cucurbitacin IIa
Based on 1 publication(s) in Google Scholar
Cucurbitacin IIa (Hemslecin A) is an orally active, blood-brain barrier-permeable EGFR inhibitor with an IC50 of 1.455 nM against human EGFR. Cucurbitacin IIa induces caspase-3-dependent apoptosis, downregulates survivin expression, enhances autophagy levels, disrupts the actin cytoskeleton via actin aggregation, arrests the cell cycle at the G2/M phase, and exerts anti-inflammatory activity by inhibiting the EGFR-MAPK signaling pathway. Cucurbitacin IIa can be used in the research of inflammation-related diseases, depression, and cancers such as non-small cell lung cancer.
For research use only. We do not sell to patients.
- Purity : 99.90%
- CAS No.: 58546-34-2
- Formula: C32H50O8
- Molecular Weight:562.73
-
Storage:
4°C, protect from light
* In solvent : -80°C, 6 months; -20°C, 1 month (protect from light)

To place orders, for customer services and technical support, please contact: MedChemExpress USA
Tel: 609-228-6898 E-mail: [email protected] [email protected]


-
 Biological Activity
-
Chemical Information
-
Solvent & Solubility
- Protocols
- Purity & Documentation
- References
-
 Help & FAQs



Publications Citing Use of MedChemExpress (MCE) Cucurbitacin IIa
MoreAll EGFR Isoforms
MoreAll Caspase Isoforms
MoreAll MEK Isoforms
More

Biological Activity
Description
|
EGFR 1.455 nM (IC50) |
Caspase 3 |
CaMK IIα |
ERK1 |
MEK1 |
STAT3 |
ERK2 |
Cellular Effect
|
Cell Line

|
Type | Value | Description | References |
|---|---|---|---|---|
| COLO 205 | IC50 |
1.09 μg/mL
Compound: 4
|
Cytotoxicity against human COLO205 cells after 48 hrs by MTT assay
Cytotoxicity against human COLO205 cells after 48 hrs by MTT assay
|
[PMID: 24717151] |
| HepG2 2.2.15 | CC50 |
66.2 μM
Compound: 1
|
Cytotoxicity against human HepG2.2.15 cells
Cytotoxicity against human HepG2.2.15 cells
|
[PMID: 23385212] |
| HepG2 2.2.15 | IC50 |
>66.2 μM
Compound: 1
|
Antiviral activity against HBV infected in human HepG2.2.15 cells assessed as inhibition of viral e antigen production
Antiviral activity against HBV infected in human HepG2.2.15 cells assessed as inhibition of viral e antigen production
|
[PMID: 23385212] |
| HepG2 2.2.15 | IC50 |
>66.2 μM
Compound: 1
|
Antiviral activity against HBV infected in human HepG2.2.15 cells assessed as inhibition of viral surface antigen production
Antiviral activity against HBV infected in human HepG2.2.15 cells assessed as inhibition of viral surface antigen production
|
[PMID: 23385212] |
| HepG2 2.2.15 | IC50 |
11.2 μM
Compound: 1
|
Antiviral activity against HBV infected in human HepG2.2.15 cells assessed as inhibition of viral DNA replication
Antiviral activity against HBV infected in human HepG2.2.15 cells assessed as inhibition of viral DNA replication
|
[PMID: 23385212] |
| NCI-H460 | IC50 |
11.53 μg/mL
Compound: 4
|
Cytotoxicity against human H460 cells after 48 hrs by MTT assay
Cytotoxicity against human H460 cells after 48 hrs by MTT assay
|
[PMID: 24717151] |
| SW-620 | IC50 |
1.11 μg/mL
Compound: 4
|
Cytotoxicity against human SW620 cells after 48 hrs by MTT assay
Cytotoxicity against human SW620 cells after 48 hrs by MTT assay
|
[PMID: 24717151] |
In Vitro
Cucurbitacin IIa (0.1-1000 μM; 24-48 h) dose-dependently inhibits the proliferation of RAW 264.7 macrophages, with an IC50 value of 122.32 μM at 24 h and 6.42 μM at 48 h[1].
Cucurbitacin IIa (2.5-40 μM; 24 h) dose-dependently inhibits the migration of RAW 264.7 macrophages[1].
Cucurbitacin IIa (2.5-40 μM; 5 h) does not inhibit LPS (HY-D1056)-induced TNF-α expression in RAW 264.7 macrophages[1].
Cucurbitacin IIa (2.5-40 μM; 5 h) does not inhibit LPS-induced phosphorylation of MAPK (p38, ERK1/2, JNK) or phosphorylation of NF-κB pathway components (IκBα, p65) in RAW 264.7 macrophages[1].
Cucurbitacin IIa (2.5-40 μM; 6-24 h) induces caspase-3-dependent apoptosis in LPS-stimulated (but not unstimulated) RAW 264.7 macrophages, which is evidenced by an increased population of cells at the sub-G0/G1 phase, elevated levels of activated caspase-3, and decreased expression of survivin[1].
Cucurbitacin IIa (2.5-40 μM; 6-24 h) dose-dependently enhances LPS-induced autophagy in RAW 264.7 macrophages, which is evidenced by increased LC3B-II levels and enhanced LC3 puncta formation[1].
Cucurbitacin IIa disrupts the actin cytoskeleton of RAW 264.7 macrophages by inducing actin aggregation, which is evidenced by the altered G-actin/F-actin ratio and abnormal actin distribution in treated cells[1].
Cucurbitacin IIa (0.1-100 μg/mL; 48 h) reduces the viability and inhibits the growth of human prostate cancer cells CWR22Rv-1, PC-3 as well as human lung cancer cells NCI-H1299[2].
Cucurbitacin IIa (10 μg/mL; 2 h) induces irreversible aggregation of filamentous actin in mouse NIH 3T3 cells transfected with EGFP-actin[2].
Cucurbitacin IIa (50 μg/mL; 48 h) disrupts the actin cytoskeleton in human prostate cancer CWR22Rv-1 cells, but does not affect their microtubule cytoskeleton[2].
Cucurbitacin IIa (10 μg/mL; 16 h) induces G2/M phase cell cycle arrest and increases the proportion of sub-G1 phase (apoptotic) cell population in parental human prostate cancer CWR22Rv-1 cells; however, these effects are inhibited in CWR22Rv-1 cells with δ-catenin overexpression[2].
Cucurbitacin IIa (1-50 μg/mL; 16 h) reduces the expression levels of phosphorylated histone H3 and survivin, increases the level of cleaved PARP, and decreases the phosphorylation level of RhoA at serine 188 in human prostate cancer CWR22Rv-1 and PC-3 cells as well as human lung cancer NCI-H1299 cells, without inhibiting the phosphorylation of JAK2/STAT3[2].
Cucurbitacin IIa (5-40 μg/mL; 72 h) induces apoptotic DNA fragmentation in human prostate cancer PC-3 and CWR22Rv-1 cells[2].
Cucurbitacin IIa (1-50 μg/mL; 16 h) reduces the phosphorylation level of RhoA at serine 188 in human prostate cancer CWR22Rv-1 cells[2].
Cucurbitacin IIa (50 μg/mL; 48 h) induces F-actin aggregation without altering the subcellular localization of STAT3 in human lung cancer NCI-H1299 cells[2].
Cucurbitacin IIa (40-80 μM; 36 h) potently inhibits the proliferation of A549 cells, with an IC50 of 60 μM after 36 h of treatment[4].
Treatment of A549 cells with Cucurbitacin IIa (50-70 μM; 36 h) induces dose-dependent apoptosis in the cells[4].
Treatment of A549 cells with Cucurbitacin IIa (50-70 μM; 36 h) induces G2/M cell cycle arrest[4].
Cucurbitacin IIa (60 μM; 1-5 h) alters the transcription levels of EGFR-MAPK pathway and apoptosis/cell cycle-related genes in A549 cells; significant upregulation of Raf1 and STAT3, as well as significant downregulation of MEK1 and ERK1, are observed at all time points[4].
Cucurbitacin IIa (60 μM; 1-24 h) regulates the accumulation and phosphorylation of EGFR-MAPK pathway-related proteins, apoptosis-related proteins, and cell cycle-related proteins in A549 cells, including the continuous degradation of survivin, the continuous reduction of phosphorylated MEK1/2, and the continuous increase of phosphorylated BRAF[4].
MedChemExpress (MCE) has not independently confirmed the accuracy of these methods. They are for reference only. Further protocols information, click here.
-
Cell Line:mouse RAW 264.7 macrophage cells
-
Concentration:2.5, 10, 40 μM
-
Incubation Time:24 h
-
Result:Markedly inhibited RAW 264.7 cell migration in a dose-dependent manner.
Reduced migrated cell numbers significantly at all tested concentrations compared to control.
-
Cell Line:LPS-stimulated mouse RAW 264.7 macrophage cells
-
Concentration:2.5, 10, 40 μM
-
Incubation Time:1 h pretreatment, followed by 1 h LPS stimulation (MAPK analysis); 1 h pretreatment, followed by 4 h LPS stimulation (NF-κB analysis)
-
Result:Did not suppress LPS-induced phosphorylation of p38, ERK1/2, JNK, IκBα, or p65.
Slightly increased MAPK phosphorylation levels at high doses.
-
Cell Line:LPS-stimulated mouse RAW 264.7 macrophage cells
-
Concentration:2.5, 10, 40 μM
-
Incubation Time:6 h (WB); 24 h (morphological observation, flow cytometry, WB)
-
Result:Reduced the arborized morphology of LPS-activated cells and induced cell fragmentation.
Elevated sub-G0/G1 apoptotic cell populations in LPS-stimulated cells to 17.55% (2.5 μM), 24.64% (10 μM), and 33.28% (40 μM), with no increase in apoptotic cells observed with treatment alone.
Significantly increased cleaved caspase-3 levels in LPS-stimulated cells, with higher levels at 24 h than 6 h.
Decreased survivin expression significantly in LPS-stimulated cells treated with 2.5 and 10 μM at 24 h.
-
Cell Line:LPS-stimulated mouse RAW 264.7 macrophage cells
-
Concentration:2.5, 10, 40 μM
-
Incubation Time:6 h, 24 h (western blot); 24 h (immunofluorescence microscopy, chloroquine combined treatment)
-
Result:Dose-dependently enhanced LPS-induced increases in LC3B-II levels, with greater effects at 24 h than 6 h.
Further increased LC3B-II levels in LPS + Cucurbitacin IIa-treated cells when combined with chloroquine, confirming enhanced autophagic flux.
Increased LC3B-II levels alone, but this effect was significantly lower than the LPS + Cucurbitacin IIa treatment at 24 h. Induced more LC3 puncta in LPS + Cucurbitacin IIa-treated cells than LPS alone-treated cells.
-
Cell Line:human prostate cancer CWR22Rv-1 cells
-
Concentration:50 μg/mL
-
Incubation Time:48 h
-
Result:Caused severe clustering of F-actin.
Showed no significant changes in microtubule structure compared to untreated cells.
-
Cell Line:human prostate cancer CWR22Rv-1 cells (parental and δ-catenin-overexpressing)
-
Concentration:10 μg/mL
-
Incubation Time:16 h
-
Result:Caused a 46% reduction in G1 phase, a decrease in S phase to 20%, a 5.5-fold increase in G2/M phase, and a 2.7-fold increase in sub-G1 phase in parental CWR22Rv-1 cells.
Caused only a moderate decrease in S phase and a slight increase in G2/M phase, with no significant changes in G1 or sub-G1 phases in δ-catenin-overexpressing CWR22Rv-1 cells.
-
Cell Line:human prostate cancer CWR22Rv-1 and PC-3 cells, human lung cancer NCI-H1299 cells
-
Concentration:1, 50 μg/mL
-
Incubation Time:16 h
-
Result:Reduced levels of phospho-Histone H3 and survivin, and increased levels of cleaved PARP in all three cell lines.
Reduced serine 188 phosphorylation of RhoA but did not alter total RhoA levels, total or phosphorylated STAT3, total or phosphorylated JAK2, or total or phosphorylated ERK1/2 in CWR22Rv-1 cells.
Had no significant effect on total or phosphorylated STAT3 or JAK2, and only marginally reduced JAK2 phosphorylation in NCI-H1299 cells.
-
Cell Line:human prostate cancer PC-3 and CWR22Rv-1 cells
-
Concentration:5, 40 μg/mL
-
Incubation Time:72 h
-
Result:Induced clear DNA fragmentation, a hallmark of apoptosis, in both cell lines.
-
Cell Line:human prostate cancer CWR22Rv-1 cells
-
Concentration:1, 50 μg/mL
-
Incubation Time:16 h
-
Result:Significantly reduced RhoA phosphorylation at serine 188, with a more pronounced reduction observed at 50 μg ml⁻1 compared to 1 μg ml⁻1.
-
Cell Line:human lung cancer NCI-H1299 cells
-
Concentration:50 μg/mL
-
Incubation Time:48 h
-
Result:Induced F-actin clustering but did not alter the mixed nuclear and cytoplasmic distribution of STAT3 compared to untreated cells.
-
Cell Line:A549
-
Concentration:40, 50, 60, 70, 80 μM
-
Incubation Time:36 h
-
Result:Inhibited A549 cell proliferation in a dose-dependent manner, with an IC50 value of approximately 60 μM at 36 h.
Caused statistically significant reductions in cell viability relative to vehicle control across all tested concentrations.
-
Cell Line:A549
-
Concentration:50, 60, 70 μM
-
Incubation Time:36 h
-
Result:Induced apoptosis in A549 cells in a dose-dependent manner.
-
Cell Line:A549
-
Concentration:50, 60, 70 μM
-
Incubation Time:36 h
-
Result:Arrested A549 cells at the G2/M phase, with the G2/M phase cell population increasing to approximately one-third of total cells across all tested concentrations.
-
Cell Line:A549
-
Concentration:60 μM
-
Incubation Time:1, 2, 3, 4, 5 h
-
Result:Caused significant, time-dependent changes in the transcription of EGFR-MAPK pathway and related genes.
Upregulated Raf1 and STAT3 significantly at all time points. Downregulated MEK1 and ERK1 significantly at all time points.
Upregulated BRAF, ERK2, and survivin across all treatments.
Downregulated cyclinB1 across all treatments.
Slightly upregulated EGFR at 3 h and downregulated EGFR at other time points.
-
Cell Line:A549
-
Concentration:60 μM
-
Incubation Time:1, 2, 4, 8, 12, 24 h
-
Result:Caused time-dependent changes in protein accumulation and phosphorylation in the EGFR-MAPK pathway and related proteins. Decreased total EGFR accumulation within 8 h, then increased; increased phosphorylated EGFR significantly, then dropped after 12 h.
Decreased total BRAF and Raf1 accumulation initially, then increased after 12 h and 24 h, respectively; increased phosphorylated BRAF continuously, while decreased phosphorylated Raf1 to a minimum at 12 h. Kept total MEK1/2 accumulation constant; decreased phosphorylated MEK1/2 continuously.
Reduced total and phosphorylated ERK1/2 to a trough at 4 h, then increased gradually.
Decreased STAT3 accumulation within 12 h, then recovered to baseline.
Degraded survivin completely over time. Suppressed cyclinB1 accumulation in early treatments, then recovered in later treatments.
In Vivo
Cucurbitacin IIa dose-dependently suppresses Lewis lung carcinoma tumour growth in C57 mice[2].
Cucurbitacin IIa (2.5-5 mg/kg; i.p.; once daily; 5 weeks) exerts dose-dependent antidepressant-like effects in CUMS-exposed mice, with the 5 mg/kg dose fully restoring behavioral, synaptic receptor expression, and CaMKII-CREB-BDNF pathway marker levels to normal, and these effects are dependent on BDNF signaling[3].
MedChemExpress (MCE) has not independently confirmed the accuracy of these methods. They are for reference only.
-
Animal Model:C57 mice[2]
-
Dosage:30-90 mg/kg (i.p.); 30-90 mg/kg (p.o.); 5-15 mg/kg (i.v.)
-
Administration:i.p.; daily; 10 days; p.o.; daily; 10 days; i.v.; daily; 10 days
-
Result:Reduced mean tumour weight.
-
Animal Model:BALB/c (adult male, 18-22 g, chronic unpredictable mild stress-induced)[3]
-
Dosage:2.5 mg/kg; 5 mg/kg (CUMS mice); 5 mg/kg (naive mice)
-
Administration:i.p.; daily; 5 weeks (1 hour before CUMS procedures/behavioral tests); i.p. (naive mice)
-
Result:Restored the behavioral indicators, synaptic receptor expression levels, and levels of CaMKII-CREB-BDNF pathway markers in mice to normal states.


Chemical Information
-
CAS No. 58546-34-2
-
Appearance Solid
-
Molecular Weight 562.73
-
Formula C32H50O8
-
Color White to off-white
-
SMILES
C[C@@]([C@@](CC=C1[C@@]2([H])C[C@H](O)[C@@H](O)C1(C)C)([H])[C@@]2(C)C3=O)(C[C@@H](O)[C@]4([H])[C@@](C)(O)C(CCC(C)(C)OC(C)=O)=O)[C@@]4(C3)C
-
Synonyms
Hemslecin A
-
Structure Classification
-
Initial Source
-
Shipping
Room temperature in continental US; may vary elsewhere.
-
Storage
4°C, protect from light
* In solvent : -80°C, 6 months; -20°C, 1 month (protect from light)


Publications (1)
-
Journal Impact Factor
-
Most Recent
-
Vet Microbiol
The Chinese medicine monomer Schisandrin C inhibits PRRSV infection by regulating the OGT-PI3K/AKT/mTOR signaling pathway. [Abstract]2026 May:316:110992. PMID: 41865607


Solvent & Solubility
In Vitro:
DMSO : 25 mg/mL (44.43 mM; ultrasonic and warming and heat to 60°C; Hygroscopic DMSO has a significant impact on the solubility of product, please use newly opened DMSO)
Please refer to the solubility information to select the appropriate solvent. Once prepared, please aliquot and store the solution to prevent product inactivation from repeated freeze-thaw cycles.
Storage method and period of stock solution: -80°C, 6 months; -20°C, 1 month (protect from light). When stored at -80°C, please use it within 6 months. When stored at -20°C, please use it within 1 month.
Please refer to the solubility information to select the appropriate solvent. Once prepared, please aliquot and store the solution to prevent product inactivation from repeated freeze-thaw cycles.
Storage method and period of stock solution: -80°C, 6 months; -20°C, 1 month (protect from light). When stored at -80°C, please use it within 6 months. When stored at -20°C, please use it within 1 month.
Concentration (start) × Volume (start) = Concentration (final) × Volume (final)
In Vivo:
Select the appropriate dissolution method based on your experimental animal and administration route.
- For the following dissolution methods, please ensure to first prepare a clear stock solution using an In Vitro approach and then sequentially add co-solvents:
- To ensure reliable experimental results, the clarified stock solution can be appropriately stored based on storage conditions. As for the working solution for In Vivo experiments, it is recommended to prepare freshly and use it on the same day.
- The percentages shown for the solvents indicate their volumetric ratio in the final prepared solution. If precipitation or phase separation occurs during preparation, heat and/or sonication can be used to aid dissolution.
Add each solvent one by one: 10% DMSO 40% PEG300 5% Tween-80 45% Saline
Solubility: ≥ 1 mg/mL (1.78 mM); Clear solution
This protocol yields a clear solution of ≥ 1 mg/mL (saturation unknown).
Taking 1 mL working solution as an example, add 100 μL DMSO stock solution (10.0 mg/mL) to 400 μL PEG300, and mix evenly; then add 50 μL Tween-80 and mix evenly; then add 450 μL Saline to adjust the volume to 1 mL.
Preparation of Saline: Dissolve 0.9 g sodium chloride in ddH₂O and dilute to 100 mL to obtain a clear Saline solution.
Add each solvent one by one: 10% DMSO 90% (20% SBE-β-CD in Saline)
Solubility: ≥ 1 mg/mL (1.78 mM); Clear solution
This protocol yields a clear solution of ≥ 1 mg/mL (saturation unknown).
Taking 1 mL working solution as an example, add 100 μL DMSO stock solution (10.0 mg/mL) to 900 μL 20% SBE-β-CD in Saline, and mix evenly.
Preparation of 20% SBE-β-CD in Saline (4°C, storage for one week): 2 g SBE-β-CD powder is dissolved in 10 mL Saline, completely dissolve until clear.
In Vivo Dissolution Calculator
Please enter the basic information of animal experiments:
-
-
-
-
Recommended: Prepare an additional quantity of animals to account for potential losses during experiments.
Please enter your animal formula composition:
-
%DMSO +
Recommended: Keep the proportion of DMSO in working solution below 2% if your animal is weak.
-
%+
-
+%Tween-80 + +
-
%Saline +
The co-solvents required include: DMSO, . All of co-solvents are available by MedChemExpress (MCE). , Tween 80. All of co-solvents are available by MedChemExpress (MCE).
Working solution concentration: 0.22 mg/mL
Method for preparing stock solution: mg drug dissolved in μL DMSO. Stock solution concentration: mg/mL. * In solvent : -80°C, 6 months; -20°C, 1 month (protect from light)
1. Take μL DMSO stock solution;
2. Add μL .
μL , mix evenly;
3. Then add μL Tween 80, mix evenly;
4. Then add μL
Please ensure that the stock solution in the first step is dissolved to a clear state, and add co-solvents in sequence. You can use ultrasonic heating (ultrasonic cleaner, recommended frequency 20-40 kHz), vortexing, etc. to assist dissolution.

Protocols
-
RNA extraction experimental
By lysing cells, releasing RNA, and removing impurities such as proteins and DNA, high-purity RNA products are finally obtained. The commonly used traditional method is the guanidine isothiocyanate/phenol/chloroform method (Trizol), which is suitable for a variety of animal materials including animal tissues, microorganisms, cultured cells, etc., and most plant materials.
-
Annexin V plus membrane-impermeant dye apoptosis staining
Annexin V-based apoptosis assays rely on the detection of phosphatidylserine (PS) externalization from the inner leaflet of the plasma membrane to the outer leaflet, an early biochemical hallmark of apoptosis. Fluorescently labeled Annexin V binds PS in a calcium-dependent manner, enabling identification of early apoptotic cells by flow cytometry or fluorescence microscopy. When combined with a membrane-impermeant DNA-binding dye (e. g. , propidium iodide), this approach allows discrimination between viable (Annexin V−/dye−), early apoptotic (Annexin V+/dye−), and late apoptotic or necrotic (Annexin V+/dye+) cell populations by assessing membrane integrity and PS exposure.
-
BrdU Incorporation Assay
Bromodeoxyuridine (BrdU) incorporation assay is based on the principle that BrdU, a thymidine analog, is incorporated into newly synthesized DNA during the S phase of the cell cycle, thereby serving as a marker of DNA replication and cellular proliferation. Incorporated BrdU can be detected using anti-BrdU antibodies following DNA denaturation, enabling visualization or quantification of proliferating cells through immunochemical detection methods such as immunofluorescence or immunohistochemistry.
-
Protocol for Cell Cycle
Cell-cycle analysis by flow cytometry measures DNA content in single cells to estimate the fraction of cells in G0/G1, S, and G2/M phases. Propidium iodide intercalates into DNA, and after RNA removal with RNase, fluorescence intensity reflects cellular DNA content: 2N cells are assigned to G0/G1, cells between 2N and 4N to S phase, and 4N cells to G2/M. DNA-content analysis alone cannot reliably separate G0 from G1 or G2 from M. Ki-67 can distinguish quiescent G0 cells from cycling cells, EdU or BrdU incorporation marks active DNA synthesis in S phase, and phospho-histone H3 staining identifies mitotic cells within the 4N population.
-
Research Protocol for Inflammation-related Diseases
The NLRP3 inflammasome is a cytosolic innate immune signaling platform that integrates priming signals and danger-signal activation to promote caspase-1 activation, maturation of IL-1β and IL-18, and gasdermin D-mediated pyroptotic cell death. The core experimental logic is to determine whether inflammatory disease phenotypes are driven by increased NLRP3 expression, ASC-containing inflammasome assembly, caspase-1 cleavage, GSDMD cleavage, and extracellular release of IL-1β/IL-18 rather than by nonspecific cell injury alone. The pathway is strongly linked to inflammation-related disease phenotypes because monosodium urate crystals activate NALP3/NLRP3 inflammasome signaling in gout-like crystal inflammation, cholesterol crystals activate NLRP3 inflammasomes in atherogenesis models, and DSS-induced intestinal inflammation has been reported to involve NLRP3 inflammasome activity. However, experimental colitis studies also show context-dependent protective effects of NLRP3 inflammasome co
-
Phalloidin F-actin cytoskeleton staining
Phalloidin F-actin staining detects polymerized filamentous actin in fixed and permeabilized specimens by using fluorescent phalloidin or phalloidin-derived phallotoxins that bind actin filaments and generate a fluorescence microscopy readout corresponding to F-actin organization, including stress fibers, cortical actin, filament bundles, and tissue-specific actin networks. Phalloidin stabilizes F-actin by reducing actin subunit dissociation from filament ends, and fluorescent phallotoxins were established as tools for visualizing actin-containing structures in eukaryotic cells.
-
Apoptosis
Apoptosis, also called programmed cell death, is generally characterized by distinct morphological characteristics.
-
TUNEL staining for apoptotic DNA fragmentation
TUNEL staining detects DNA strand breaks by using terminal deoxynucleotidyl transferase to add labeled nucleotides to exposed 3′-OH DNA termini, generating either microscopic staining in fixed cells or tissue sections, or fluorescence/cytometric signal in cell suspensions. TUNEL positivity reflects DNA fragmentation but should not be interpreted alone as definitive apoptosis, because TUNEL can also label necrotic, autolytic, mechanically damaged, or DNA-repair-associated DNA breaks.
-
Cell Cytotoxicity Assay
Cytotoxicity assays are usually based on the assessment of cell membrane damage, which can also be indirectly detected by measuring cell viability. Detection methods include MTT assay, CKK-8 assay, LDH assay and ATP assay, etc.
-
Flow cytometric DNA-content cell-cycle staining
Flow cytometric DNA-content cell-cycle staining measures the fluorescence intensity of DNA-bound fluorochromes in single cells or nuclei to estimate DNA content distributions, allowing assignment of populations to G0/G1, S, and G2/M phases by DNA histogram deconvolution. Propidium iodide (PI) intercalates into DNA, and PI fluorescence is proportional to cellular DNA content when staining is performed under conditions that make DNA accessible and minimize non-DNA signal. Cells with G2/M DNA content are expected to show approximately twice the fluorescence intensity of G0/G1 cells, while S-phase cells occupy intermediate fluorescence values. PI-based DNA-content analysis can also detect cells with fractional DNA content, often reported as sub-G1, when DNA fragmentation and extraction during staining reduce retained DNA signal in apoptotic cells. DAPI is an alternative DNA fluorochrome for univariate DNA-content analysis, while bivariate approaches combining DNA content with proliferation
-
Cotton Pellet Granuloma
Cotton pellet granuloma is a classical in vivo chronic inflammation model used to evaluate the anti-inflammatory potential of test substances by measuring their ability to inhibit granuloma tissue formation around an implanted foreign body (cotton pellet) in rodents. The method is based on the biological response to a sterile implanted material, which induces proliferative phase inflammation characterized by fibroblast proliferation and collagen-rich granuloma formation, and the final readout reflects the extent of chronic inflammatory tissue growth surrounding the pellet. In multiple preclinical pharmacological evaluations, inhibition of cotton pellet-induced granuloma formation has been used as an indicator of anti-inflammatory activity in both synthetic and natural product screening contexts.
-
Carrageenan-Induced Paw Edema
Carrageenan-induced paw edema is an acute inflammation model in which intraplantar injection of carrageenan induces localized inflammatory swelling characterized by vascular permeability, leukocyte infiltration, and production of inflammatory mediators such as prostaglandins and cytokines, making it widely used to evaluate anti-inflammatory agents in vivo. The resulting paw volume or thickness increase is quantified over time as a direct readout of inflammatory intensity and drug efficacy, typically reflecting cyclooxygenase-mediated prostaglandin-driven edema formation and immune cell recruitment in peripheral tissue[20].
-
Autophagy
Autophagy is a process in which eukaryotic cells use lysosomes to degrade their own cytoplasmic proteins and damaged organelles under the regulation of autophagy related gene (Atg). Microtubule-associated proteins light chain 3 (LC3) is recognized as autophagy marker, which transfers from cytoplasmic LC3 (LC3-I) to membrane type (LC3-II). LC3-II/I ratio could be detected by Western Blot and fluorescence microscopy.
-
Apoptosis Solutions
Apoptosis is a regulated, generally non-lytic cell-death pathway that removes unwanted, damaged, infected, or abnormal cells through coordinated morphological changes, caspase activation, DNA fragmentation, and membrane remodeling. The intrinsic apoptosis pathway is controlled mainly by mitochondrial outer membrane permeabilization, BCL-2 family proteins, cytochrome c release, apoptosome formation, caspase-9 activation, and downstream executioner caspase-3/7 activation. The extrinsic apoptosis pathway is initiated by death receptors such as Fas, TNFR, and TRAIL receptors, which recruit adaptor proteins and activate caspase-8 before engaging executioner caspases or mitochondrial amplification through BID cleavage. Apoptosis is linked to many phenotypes, including cancer cell killing, tissue homeostasis, immune regulation, neurodegeneration, infection response, and treatment-induced cytotoxicity; unresolved questions include how apoptosis interacts with necroptosis, pyroptosis, ferroptos
-
Lysosome and acidic-vesicle live-cell staining
Lysosome and acidic-vesicle live-cell staining detects acidic intracellular compartments by using membrane-permeant acidotropic probes that accumulate in low-pH vesicles, including lysosomes, late endosomes, autolysosomes, and acidic phagosomes. LysoTracker staining is commonly used as an intensity-based readout of acidic lysosomal compartment abundance or enlargement, while acridine orange produces green fluorescence in less concentrated compartments and red fluorescence after concentration-dependent accumulation in acidic vesicular organelles. Loss or reduction of acridine-orange red signal can be used as a readout of lysosomal membrane permeabilization or reduced acidic-vesicle integrity. This protocol is designed for live cultured cells and can be adapted for fluorescence microscopy, high-content imaging, plate-reader readout, or flow cytometry when the selected literature supports the readout. Because these dyes report acidotropic accumulation rather than lysosome identity alone,
-
Macroautophagy Solutions
Macroautophagy is a conserved lysosome-dependent degradation pathway in which cytoplasmic material is sequestered into double-membrane autophagosomes and delivered to lysosomes for degradation and recycling. The pathway supports cellular homeostasis during nutrient limitation, organelle stress, protein-aggregate accumulation, infection, differentiation, and tissue remodeling by coupling cargo sequestration, autophagosome maturation, lysosomal fusion, and degradation of cargo-derived macromolecules. The core molecular sequence includes initiation by nutrient- and stress-regulated autophagy machinery, autophagosome nucleation, LC3/ATG8-family conjugation to autophagosomal membranes, cargo selection through receptors such as SQSTM1/p62, autophagosome-lysosome fusion, and lysosomal degradation. LC3 was identified as a mammalian homolog of yeast Atg8 that localizes to autophagosomal membranes after processing, and p62/SQSTM1 was shown to connect ubiquitinated cargo with autophagic degradati


Purity & Documentation
-
Data Sheet (306 KB)
-
SDS (393 KB)
- English - EN (393 KB)
- Français - FR (393 KB)
- Deutsch - DE (393 KB)
- Norwegian - NO (393 KB)
- Español - ES (393 KB)
- Swedish - SV (393 KB)
- Italian - IT (393 KB)
- Korean - KR (393 KB)
- Portuguese - PT (393 KB)
-
Handling Instructions (2659 KB)
References
[1]. He J, et al. Cucurbitacin IIa induces caspase-3-dependent apoptosis and enhances autophagy in lipopolysaccharide-stimulated RAW 264.7 macrophages. Int Immunopharmacol. 2013;16(1):27-34. [Content Brief]
[2]. Boykin C, et al. Cucurbitacin IIa: a novel class of anti-cancer drug inducing non-reversible actin aggregation and inhibiting survivin independent of JAK2/STAT3 phosphorylation. Br J Cancer. 2011;104(5):781-789. [Content Brief]
[3]. Zhou SM, et al. Cucurbitacin IIa exerts antidepressant-like effects on mice exposed to chronic unpredictable mild stress. Neuroreport. 2017;28(5):259-267. [Content Brief]
[4]. Zhang J, et al. Cucurbitacin IIa interferes with EGFR-MAPK signaling pathway leads to proliferation inhibition in A549 cells. Food Chem Toxicol. 2019;132:110654. [Content Brief]


Complete Stock Solution Preparation Table
Please refer to the solubility information to select the appropriate solvent. Once prepared, please aliquot and store the solution to prevent product inactivation from repeated freeze-thaw cycles.
Storage method and period of stock solution: -80°C, 6 months; -20°C, 1 month (protect from light). When stored at -80°C, please use it within 6 months. When stored at -20°C, please use it within 1 month.
| Optional Solvent | Concentration Solvent Mass | 1 mg | 5 mg | 10 mg | 25 mg |
|---|---|---|---|---|---|
| DMSO | 1 mM | 1.7771 mL | 8.8853 mL | 17.7705 mL | 44.4263 mL |
| 5 mM | 0.3554 mL | 1.7771 mL | 3.5541 mL | 8.8853 mL | |
| 10 mM | 0.1777 mL | 0.8885 mL | 1.7771 mL | 4.4426 mL | |
| 15 mM | 0.1185 mL | 0.5924 mL | 1.1847 mL | 2.9618 mL | |
| 20 mM | 0.0889 mL | 0.4443 mL | 0.8885 mL | 2.2213 mL | |
| 25 mM | 0.0711 mL | 0.3554 mL | 0.7108 mL | 1.7771 mL | |
| 30 mM | 0.0592 mL | 0.2962 mL | 0.5924 mL | 1.4809 mL | |
| 40 mM | 0.0444 mL | 0.2221 mL | 0.4443 mL | 1.1107 mL |


Cucurbitacin IIa Related Classifications
HY-N1988 Related Classifications
 Powered by Bioz