



Viridicatol

Based on 1 Customer Validation
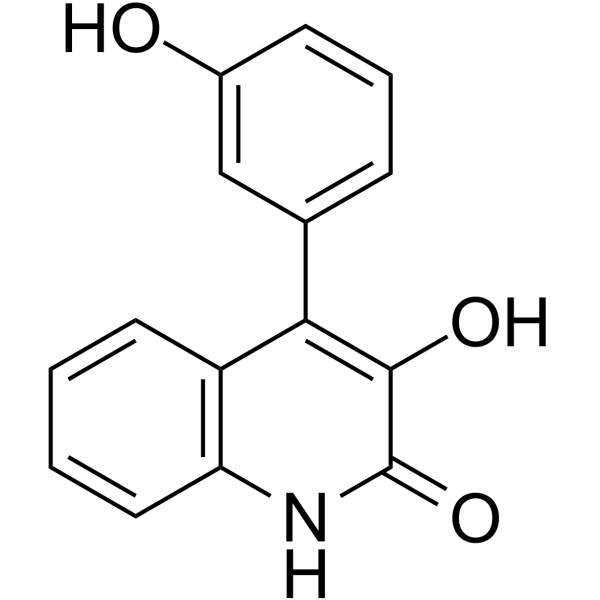
Viridicatol is a quinolone alkaloid with anti-inflammatory, antibacterial, antifungal, osteogenic and chondrogenic activities. Viridicatol reduces the phosphorylation levels of ERK, JNK, p38 and STAT6; inhibits MMP-2, MMP-9, NF-κB signaling pathway and PTP1B; downregulates genes related to mast cell activation; and binds to SHN3 to activate the Wnt/SHN3 signaling pathway. Viridicatol inhibits the expression of pro-inflammatory mediators and cytokines, and promotes osteogenic/chondrogenic differentiation. Viridicatol can be used in studies related to fibrosarcoma, allergy, bacterial infection, fungal infection and osteoporosis.
For research use only. We do not sell to patients.
- Purity : 99.93%
- CAS No.: 14484-44-7
- Formula: C15H11NO3
- Molecular Weight:253.25
-
Storage:Powder -20°C, 3 years , 4°C, 2 years ; In solvent -80°C, 6 months , -20°C, 1 month

To place orders, for customer services and technical support, please contact: MedChemExpress USA
Tel: 609-228-6898 E-mail: [email protected] [email protected]


-
 Biological Activity
-
Chemical Information
-
Solvent & Solubility
- Protocols
- Purity & Documentation
- References
-
 Help & FAQs





Biological Activity
Description
|
ERK |
p38 MAPK |
JNK |
MMP-9 |
MMP-2 |
NF-κB |
In Vitro
Viridicatol (10-100 μM; 24 h) exhibits no cytotoxicity toward HT1080 human fibrosarcoma cells at 10, 20, and 50 μM, but induces cytotoxicity at 100 μM[1].
Viridicatol (10-50 μM; 1 h pre-incubation, followed by 24 h PMA stimulation) inhibits PMA-induced MMP-2 and MMP-9 enzymatic activity in HT1080 human fibrosarcoma cells[1].
Viridicatol (10-50 μM; 1 h pre-incubation, followed by 24 h PMA stimulation) reduces PMA-induced MMP-2 protein expression in HT1080 human fibrosarcoma cells, but does not affect MMP-9 protein expression[1].
Viridicatol (10-50 μM; 1 h pre-incubation, followed by 24 h PMA stimulation) inhibits PMA-induced phosphorylation of ERK, JNK, and p38 in HT1080 human fibrosarcoma cells[1].
Viridicatol (10 μg/mL; 1 h pre-incubation prior to 1 h DNP-BSA stimulation) regulates 128 differentially expressed genes in IgE-mediated activated RBL-2H3 cells, primarily down-regulating mast cell activation-related inflammatory factor and chemokine genes[2].
Viridicatol (10 μg/mL; 1 h pre-incubation prior to 1 h DNP-BSA stimulation) significantly down-regulates the expression of mast cell activation-related genes (Tnfα, Ccl2, Jun, Fos, Il4, Ccl7, Il13, and Socs1) in IgE-mediated activated RBL-2H3 cells[2].
Viridicatol (2.5-10 μg/mL; 1 h pre-incubation prior to 15 min DNP-BSA stimulation) dose-dependently inhibits the phosphorylation of JNK, ERK, P38, and STAT6 proteins in IgE-mediated activated RBL-2H3 cells, suppressing MAPK and JAK-STAT pathway activation[2].
Viridicatol (compound 2) (0.98-500 μg/mL; 1 day) exhibits potent antibacterial activity against Staphylococcus aureus (MIC = 15.6 μg/mL) and moderate activity against Escherichia coli, Pseudomonas aeruginosa, Streptococcus lactis, Colletotrichum gloeosporioides, and Fusarium graminearum.[3].
Viridicatol (0.98-500 μg/mL; 2 days) exhibits potent antifungal activity against Alternaria brassicae, Botrytis cinerea, and Valsa mali (MIC = 31.2 μg/mL) and moderate activity against Alternaria alternata, Setosphearia turcica, Sclerotinia sclerotiorum, Phytophthora capsici, and Peony anthracnose[3].
Viridicatol (compound 1) (5-160 μM; 24 h) is non-cytotoxic to RAW264.7 and BV2 cells[4].
Viridicatol (10-80 μM; 3 h pre-treatment, followed by 24 h LPS stimulation) dose-dependently inhibits pro-inflammatory mediator production and related protein expression in LPS-stimulated RAW264.7 cells, with IC50 values of 46.03 μM for NO and 30.37 μM for PGE2[4].
Viridicatol (10-80 μM; 3 h pre-treatment, followed by 24 h LPS stimulation) dose-dependently inhibits pro-inflammatory mediator production and related protein expression in LPS-stimulated BV2 cells, with IC50 values of 43.03 μM for NO and 34.20 μM for PGE2[4].
Viridicatol (10-80 μM; 3 h pre-treatment, followed by 6 h LPS stimulation) differentially inhibits inflammatory gene expression in LPS‑activated RAW264.7 and BV2 cells[4].
Viridicatol (10-80 μM; 3 h pre-treatment, followed by 1 h LPS stimulation) inhibits the NF-κB signaling pathway in LPS-stimulated RAW264.7 cells and BV2 cells by blocking IκB-α phosphorylation/degradation, NF-κB p65/p50 nuclear translocation, and NF-κB DNA-binding activity[4].
Viridicatol (1-10 μM; 5 days) promotes early osteogenic differentiation of MC3T3-E1 pre-osteoblasts, as evidenced by concentration-dependent increases in alkaline phosphatase activity after 5 days of treatment[5].
Viridicatol (1-20 μM; 21 days) promotes late osteogenic mineralization of MC3T3-E1 pre-osteoblasts with an EC50 of 5.204 μM after 21 days of treatment[5].
Viridicatol (1-20 μM; 14 days) promotes osteogenic mineralization of mouse bone-derived mesenchymal stem cells with an EC50 of 4.132 μM after 14 days of treatment[5].
Viridicatol (1-10 μM; ~21 days) promotes chondrogenic differentiation of mouse bone-derived mesenchymal stem cells in a concentration-dependent manner after ~21 days of treatment[5].
Viridicatol (5 μM; 0-48 h, 3 days, 5 days, 8 days) time-dependently inhibits Hivep3 mRNA expression and upregulates osteogenic marker genes Alpl and Bglap in MC3T3-E1 pre-osteoblasts[5].
Viridicatol (5 μM; 8 days) promotes osteogenic mineralization of WT mouse bone-derived mesenchymal stem cells, but this effect is dependent on the presence of SHN3[5].
Viridicatol (1-10 μM; 5 days) activates the Wnt/SHN3 signaling pathway in MC3T3-E1 pre-osteoblasts by upregulating β-catenin, p-GSK-3β, and p-ERK1/2 and inhibiting SHN3 protein expression[5].
Viridicatol (1-10 μM; 5 days, 5 μM; 3, 5, 8 days) upregulates osteocalcin and β-catenin protein levels in mouse bone-derived mesenchymal stem cells[5].
MedChemExpress (MCE) has not independently confirmed the accuracy of these methods. They are for reference only. Further protocols information, click here.
-
Cell Line:HT1080 human fibrosarcoma cells
-
Concentration:10 μM, 20 μM, 50 μM, 100 μM
-
Incubation Time:24 h
-
Result:Showed no obvious cytotoxic effect at 10, 20, and 50 μM.
Caused clear cytotoxicity at 100 μM.
-
Cell Line:HT1080 human fibrosarcoma cells
-
Concentration:10 μM, 20 μM, 50 μM
-
Incubation Time:1 h pre-incubation, followed by 24 h PMA stimulation
-
Result:Significantly inhibited MMP-2 protein expression in a dose-dependent manner.
Had no inhibitory effect on MMP-9 protein expression in PMA-stimulated cells.\n
Dose-dependently reduced the phosphorylation of ERK, JNK, and p38 in PMA-stimulated cells.
Showed significant inhibition at all tested concentrations for each MAPK subtype.
-
Cell Line:IgE-mediated activated RBL-2H3 cells
-
Concentration:10 μg/mL
-
Incubation Time:1 h (pre-incubation prior to 1 h DNP-BSA stimulation)
-
Result:Significantly down-regulated the mRNA expression levels of Tnfα, Ccl2, Jun, Fos, Il4, Ccl7, Il13, and Socs1.
-
Cell Line:IgE-mediated activated RBL-2H3 cells
-
Concentration:2.5, 5, 10 μg/mL
-
Incubation Time:1 h (pre-incubation prior to 15 min DNP-BSA stimulation)
-
Result:Dose-dependently reduced the levels of phosphorylated JNK, ERK, P38, and STAT6, while total protein levels of these proteins remained unchanged.
Caused the most significant reduction in JNK and ERK phosphorylation at 10 μg/mL.
Significantly reduced P38 and STAT6 phosphorylation at all tested doses.
-
Cell Line:murine macrophage-like RAW264.7 cells, murine immortalized microglial BV2 cells
-
Concentration:5, 10, 20, 40, 80, 160 μM
-
Incubation Time:24 h
-
Result:Did not reduce cell viability of RAW264.7 or BV2 cells.
Decreased cell viability of RAW264.7 or BV2 cells relative to untreated controls at 160 μM.
-
Cell Line:LPS-stimulated murine macrophage-like RAW264.7 cells
-
Concentration:10, 20, 40, 80 μM
-
Incubation Time:3 h pre-treatment, followed by 6 h LPS stimulation
-
Result:Reduced LPS-induced IL-1β, IL-6 and TNF-α mRNA expression dose-dependently.
Significantly inhibited IL-1β, IL-6 and TNF-α mRNA expression at 40 and 80 μM.
-
Cell Line:mouse bone-derived mesenchymal stem cells (BMSCs)
-
Concentration:1, 5, 10 μM
-
Incubation Time:~21 days
-
Result:Induced chondrogenic differentiation of BMSCs in a concentration-dependent manner.
Showed the highest relative Alcian blue staining fold change at 10 μM compared to control groups.
-
Cell Line:MC3T3-E1 pre-osteoblast cells
-
Concentration:5 μM
-
Incubation Time:0 h, 6 h, 12 h, 24 h, 48 h, 3 days, 5 days, 8 days
-
Result:Inhibited Hivep3 (SHN3) mRNA expression in a time-dependent manner over 8 days.
Promoted time-dependent increases in Alpl (early osteogenic marker) and Bglap (late osteogenic marker) mRNA expression.
-
Cell Line:MC3T3-E1 pre-osteoblast cells
-
Concentration:1, 5, 10 μM
-
Incubation Time:5 days
-
Result:Upregulated β-catenin, p-GSK-3β, and p-ERK1/2 protein levels in a concentration-dependent manner.
Left NF-κB, total ERK1/2, and GSK-3β levels unchanged.
Significantly inhibited SHN3 protein expression.
-
Cell Line:mouse bone-derived mesenchymal stem cells (BMSCs)
-
Concentration:1, 5, 10 μM (5 days); 5 μM (3, 5, 8 days)
-
Incubation Time:3 days, 5 days, 8 days
-
Result:Significantly upregulated OCN and β-catenin protein levels in BMSCs, with 5 μM and 10 μM showing significant increases over control after 5 days.
Showed time-dependent increases in OCN and β-catenin protein levels at 5 μM over 3, 5, and 8 days.
In Vivo
Viridicatol (5 mg/kg; i.v.; every 2 days; 14 days) promotes fracture healing by increasing callus volume, bone mass, and cartilage and bone areas at the fracture site[5].
Free viridicatol (5 mg/kg; i.v.; every 2 days; 4 weeks) provides limited mitigation of bone loss in the Col1a2oim/oim osteogenesis imperfecta mouse model[5].
Viridicatol delivered via bone-targeting nanovesicles (5 mg/kg; i.v.; every 2 days; 4 weeks) significantly reduces spontaneous fractures and increases bone volume fraction in the Col1a2oim/oim osteogenesis imperfecta mouse model[5].
MedChemExpress (MCE) has not independently confirmed the accuracy of these methods. They are for reference only.
-
Animal Model:C57BL/6J (female, 10-week-old, bilateral ovariectomy-induced osteoporosis model)[5]
-
Dosage:5 mg/kg
-
Administration:i.v.; daily; 6 weeks
-
Result:Increased femur BV/TV and Tb.N versus untreated OVX group.
Increased 5th lumbar spine bone mass via Von Kossa staining.
Elevated MS/BS, MAR and BFR/BS.
Increased Ob.S/BS in 5th lumbar vertebrae and femur without altering N.Oc.S/BS.
Caused no significant weight changes, deaths or organ abnormalities.
-
Animal Model:C57BL/6J (female, 8-week-old, closed transverse diaphyseal femur fracture model stabilized with an intramedullary needle)[5]
-
Dosage:5 mg/kg
-
Administration:i.v.; every 2 days; 14 days
-
Result:Significantly increased callus volume and BV/TV at the fracture site by micro-CT.
Increased cartilage and bone areas at the fracture site by Safranin O/Fast Green staining.
Increased Ob.S/BS without affecting osteoclast parameters.
-
Animal Model:Col1a2oim/oim (male, 4-week-old, osteogenesis imperfecta genetic model)[5]
-
Dosage:5 mg/kg
-
Administration:i.v.; every 2 days; 4 weeks
-
Result:Showed limited therapeutic effects on severe osteopenic phenotype and spontaneous fracture incidence versus bone-targeted nanovesicle viridicatol, but trended toward improved bone parameters versus PBS control.
Significantly mitigated osteopenic phenotype, reduced spontaneous fractures, and increased femur BV/TV and Ob.S/BS versus PBS, free viridicatol and non-targeted nanovesicle controls.


Chemical Information
-
CAS No. 14484-44-7
-
Appearance Solid
-
Molecular Weight 253.25
-
Formula C15H11NO3
-
Color White to off-white
-
SMILES
O=C1NC2=C(C=CC=C2)C(C3=CC=CC(O)=C3)=C1O
-
Structure Classification
-
Initial Source
Penicillium griseofulvum
-
Shipping
Room temperature in continental US; may vary elsewhere.
-
Storage
Powder -20°C 3 years 4°C 2 years In solvent -80°C 6 months -20°C 1 month


Solvent & Solubility
In Vitro:
DMSO : 125 mg/mL (493.58 mM; Need ultrasonic; Hygroscopic DMSO has a significant impact on the solubility of product, please use newly opened DMSO)
Please refer to the solubility information to select the appropriate solvent. Once prepared, please aliquot and store the solution to prevent product inactivation from repeated freeze-thaw cycles.
Storage method and period of stock solution: -80°C, 6 months; -20°C, 1 month. When stored at -80°C, please use it within 6 months. When stored at -20°C, please use it within 1 month.
Please refer to the solubility information to select the appropriate solvent. Once prepared, please aliquot and store the solution to prevent product inactivation from repeated freeze-thaw cycles.
Storage method and period of stock solution: -80°C, 6 months; -20°C, 1 month. When stored at -80°C, please use it within 6 months. When stored at -20°C, please use it within 1 month.
Concentration (start) × Volume (start) = Concentration (final) × Volume (final)
In Vivo:
Select the appropriate dissolution method based on your experimental animal and administration route.
- For the following dissolution methods, please ensure to first prepare a clear stock solution using an In Vitro approach and then sequentially add co-solvents:
- To ensure reliable experimental results, the clarified stock solution can be appropriately stored based on storage conditions. As for the working solution for In Vivo experiments, it is recommended to prepare freshly and use it on the same day.
- The percentages shown for the solvents indicate their volumetric ratio in the final prepared solution. If precipitation or phase separation occurs during preparation, heat and/or sonication can be used to aid dissolution.
Add each solvent one by one: 10% DMSO 40% PEG300 5% Tween-80 45% Saline
Solubility: ≥ 2.08 mg/mL (8.21 mM); Clear solution
This protocol yields a clear solution of ≥ 2.08 mg/mL (saturation unknown).
Taking 1 mL working solution as an example, add 100 μL DMSO stock solution (20.8 mg/mL) to 400 μL PEG300, and mix evenly; then add 50 μL Tween-80 and mix evenly; then add 450 μL Saline to adjust the volume to 1 mL.
Preparation of Saline: Dissolve 0.9 g sodium chloride in ddH₂O and dilute to 100 mL to obtain a clear Saline solution.
Add each solvent one by one: 10% DMSO 90% (20% SBE-β-CD in Saline)
Solubility: ≥ 2.08 mg/mL (8.21 mM); Clear solution
This protocol yields a clear solution of ≥ 2.08 mg/mL (saturation unknown).
Taking 1 mL working solution as an example, add 100 μL DMSO stock solution (20.8 mg/mL) to 900 μL 20% SBE-β-CD in Saline, and mix evenly.
Preparation of 20% SBE-β-CD in Saline (4°C, storage for one week): 2 g SBE-β-CD powder is dissolved in 10 mL Saline, completely dissolve until clear.
In Vivo Dissolution Calculator
Please enter the basic information of animal experiments:
-
-
-
-
Recommended: Prepare an additional quantity of animals to account for potential losses during experiments.
Please enter your animal formula composition:
-
%DMSO +
Recommended: Keep the proportion of DMSO in working solution below 2% if your animal is weak.
-
%+
-
+%Tween-80 + +
-
%Saline +
The co-solvents required include: DMSO, . All of co-solvents are available by MedChemExpress (MCE). , Tween 80. All of co-solvents are available by MedChemExpress (MCE).
Working solution concentration: 0.22 mg/mL
Method for preparing stock solution: mg drug dissolved in μL DMSO. Stock solution concentration: mg/mL.
1. Take μL DMSO stock solution;
2. Add μL .
μL , mix evenly;
3. Then add μL Tween 80, mix evenly;
4. Then add μL
Please ensure that the stock solution in the first step is dissolved to a clear state, and add co-solvents in sequence. You can use ultrasonic heating (ultrasonic cleaner, recommended frequency 20-40 kHz), vortexing, etc. to assist dissolution.

Protocols
-
Kinase activity and phosphorylation assays
Kinase activity assays measure the ability of kinases to transfer phosphate groups from ATP to specific substrates, while phosphorylation assays detect the presence and levels of phosphorylated proteins. Common methods include radiolabeled ATP incorporation (e. g. ,), ADP release detection via bioluminescence (e. g. ,[3]), enzyme-linked immunosorbent assays (ELISA) for phospho-specific epitopes (e. g. ,[6]), and microtiter-based formats for high-throughput screening (e. g. ,[8]). The ADP-Glo assay quantifies kinase activity by measuring ADP produced during phosphorylation using a luciferase-based system. Radiometric assays involve autoradiography or scintillation counting after incorporation of 32P-labeled ATP into substrate proteins. ELISA-based approaches rely on phospho-specific antibodies to detect activated kinases in cell lysates or purified samples.
-
Research Protocol for Infectious Diseases
Infectious-disease experiments test how pathogens interact with host barriers, innate immune receptors, inflammatory signaling, pathogen replication, and tissue injury; pattern-recognition receptors such as TLRs, RIG-I-like receptors, NOD-like receptors, and inflammasomes detect microbial molecules and activate NF-κB, interferon, and cytokine responses. The central hypothesis is that infection severity reflects the balance between pathogen burden and host response: protective inflammation restricts pathogen growth, whereas excessive or mislocalized inflammation contributes to tissue damage and disease phenotype. Unresolved questions include which host pathways are protective versus pathogenic, why some infection models fail to translate to human disease, and which combined readouts best predict clinically relevant infection outcomes.
-
Western Blot
Western blotting (WB) is a commonly used experimental method in molecular biology, biochemistry, and immunogenetics for identifying and quantifying target proteins. It combines gel electrophoresis with immunoassay, enabling researchers to analyze protein expression, post-translational modifications, and molecular weight.
-
RNA extraction experimental
By lysing cells, releasing RNA, and removing impurities such as proteins and DNA, high-purity RNA products are finally obtained. The commonly used traditional method is the guanidine isothiocyanate/phenol/chloroform method (Trizol), which is suitable for a variety of animal materials including animal tissues, microorganisms, cultured cells, etc., and most plant materials.
-
Mitochondrial membrane-potential fluorescent assay
Mitochondrial membrane potential fluorescent assays estimate ΔΨm in living cells using lipophilic cationic dyes such as TMRM, TMRE, rhodamine 123, and JC-1, which accumulate in mitochondria according to membrane polarization; loss of signal after FCCP or CCCP treatment is interpreted as mitochondrial depolarization. TMRM/TMRE and rhodamine 123 are commonly used for semi-quantitative live-cell microscopy or flow cytometry, while JC-1 can report a shift from red aggregate fluorescence to green monomer fluorescence during depolarization; interpretation requires controls because dye concentration, quenching mode, cell type, dye efflux, and mitochondrial mass can affect fluorescence independently of ΔΨm.
-
Mesenchymal stromal/stem cell chondrogenic differentiation
MSC chondrogenic differentiation is commonly induced by culturing bone marrow-derived mesenchymal stromal/stem cells as high-density three-dimensional pellets or micromass aggregates in defined chondrogenic medium containing TGF-β family stimulation; the readout is formation of cartilage-like extracellular matrix, especially sulfated proteoglycans, aggrecan, and type II collagen. The assay detects chondrogenesis by pellet enlargement, metachromatic or Alcian blue/Safranin O staining of proteoglycan-rich matrix, immunodetection of type II collagen and aggrecan, and gene-expression changes in cartilage matrix markers; hypertrophic or fibrocartilaginous drift can be assessed by collagen X and collagen I readouts when included.
-
Mitochondrial membrane-potential and mitochondrial mass staining
Mitochondrial membrane potential staining measures the electrochemical polarization across the mitochondrial inner membrane in live cells using lipophilic cationic fluorescent probes; early rhodamine-based work showed that selective mitochondrial dye accumulation is lost when the mitochondrial transmembrane potential is dissipated. JC-1 reports mitochondrial polarization by shifting from green monomer fluorescence to red J-aggregate fluorescence as dye concentration increases within energized mitochondria; therefore, the red/green fluorescence ratio is used as a relative readout of mitochondrial membrane potential. TMRE or TMRM staining provides a single-channel relative readout because these cationic rhodamine esters accumulate in polarized mitochondria, and lower fluorescence indicates reduced mitochondrial polarization when acquisition and dye-loading conditions are controlled. Mitochondrial mass staining is commonly performed with MitoTracker Green FM or related MitoTracker dyes as
-
Research Protocol for Inflammation-related Diseases
The NLRP3 inflammasome is a cytosolic innate immune signaling platform that integrates priming signals and danger-signal activation to promote caspase-1 activation, maturation of IL-1β and IL-18, and gasdermin D-mediated pyroptotic cell death. The core experimental logic is to determine whether inflammatory disease phenotypes are driven by increased NLRP3 expression, ASC-containing inflammasome assembly, caspase-1 cleavage, GSDMD cleavage, and extracellular release of IL-1β/IL-18 rather than by nonspecific cell injury alone. The pathway is strongly linked to inflammation-related disease phenotypes because monosodium urate crystals activate NALP3/NLRP3 inflammasome signaling in gout-like crystal inflammation, cholesterol crystals activate NLRP3 inflammasomes in atherogenesis models, and DSS-induced intestinal inflammation has been reported to involve NLRP3 inflammasome activity. However, experimental colitis studies also show context-dependent protective effects of NLRP3 inflammasome co
-
Protocol for Kinase activity and phosphorylation assays
Kinase activity assays measure transfer of phosphate from ATP to a protein or peptide substrate, generating phosphorylated substrate, ADP, or incorporated radiolabeled phosphate as the readout; phosphorylation assays measure site-specific phosphorylation in cells or tissues as a proxy for kinase-pathway activation, inhibition, or substrate regulation. Phosphorylation can be detected by phospho-specific Western blot, immunoprecipitation kinase assay, phospho-immunofluorescence, phospho-flow cytometry, luminescent ADP detection, radiolabeled ATP incorporation, or reporter-based pathway assays, and these readouts can be applied to cancer cells, primary neurons, mouse tumors, organoids, inflammatory macrophages, ferroptosis studies, and mitophagy studies when the kinase target is biologically relevant.


Purity & Documentation
-
Data Sheet (300 KB)
-
SDS (480 KB)
- English - EN (480 KB)
- Français - FR (480 KB)
- Deutsch - DE (480 KB)
- Norwegian - NO (480 KB)
- Español - ES (480 KB)
- Swedish - SV (480 KB)
- Italian - IT (480 KB)
- Korean - KR (480 KB)
- Portuguese - PT (480 KB)
-
Handling Instructions (2659 KB)
References
[3]. Ma YM, et al. A new isoquinolone alkaloid from an endophytic fungus R22 of Nerium indicum. Nat Prod Res. 2017;31(8):951-958. [Content Brief]
[5]. Xie CL, et al. Viridicatol from the Deep-Sea-Derived Fungus Alleviates Bone Loss by Targeting the Wnt/SHN3 Pathway. Adv Sci (Weinh). 2025;12(21):e2416140. [Content Brief]


Complete Stock Solution Preparation Table
Please refer to the solubility information to select the appropriate solvent. Once prepared, please aliquot and store the solution to prevent product inactivation from repeated freeze-thaw cycles.
Storage method and period of stock solution: -80°C, 6 months; -20°C, 1 month. When stored at -80°C, please use it within 6 months. When stored at -20°C, please use it within 1 month.
| Optional Solvent | Concentration Solvent Mass | 1 mg | 5 mg | 10 mg | 25 mg |
|---|---|---|---|---|---|
| DMSO | 1 mM | 3.9487 mL | 19.7433 mL | 39.4867 mL | 98.7167 mL |
| 5 mM | 0.7897 mL | 3.9487 mL | 7.8973 mL | 19.7433 mL | |
| 10 mM | 0.3949 mL | 1.9743 mL | 3.9487 mL | 9.8717 mL | |
| 15 mM | 0.2632 mL | 1.3162 mL | 2.6324 mL | 6.5811 mL | |
| 20 mM | 0.1974 mL | 0.9872 mL | 1.9743 mL | 4.9358 mL | |
| 25 mM | 0.1579 mL | 0.7897 mL | 1.5795 mL | 3.9487 mL | |
| 30 mM | 0.1316 mL | 0.6581 mL | 1.3162 mL | 3.2906 mL | |
| 40 mM | 0.0987 mL | 0.4936 mL | 0.9872 mL | 2.4679 mL | |
| 50 mM | 0.0790 mL | 0.3949 mL | 0.7897 mL | 1.9743 mL | |
| 60 mM | 0.0658 mL | 0.3291 mL | 0.6581 mL | 1.6453 mL | |
| 80 mM | 0.0494 mL | 0.2468 mL | 0.4936 mL | 1.2340 mL | |
| 100 mM | 0.0395 mL | 0.1974 mL | 0.3949 mL | 0.9872 mL |


Viridicatol Related Classifications
HY-116474 Related Classifications
 Powered by Bioz