



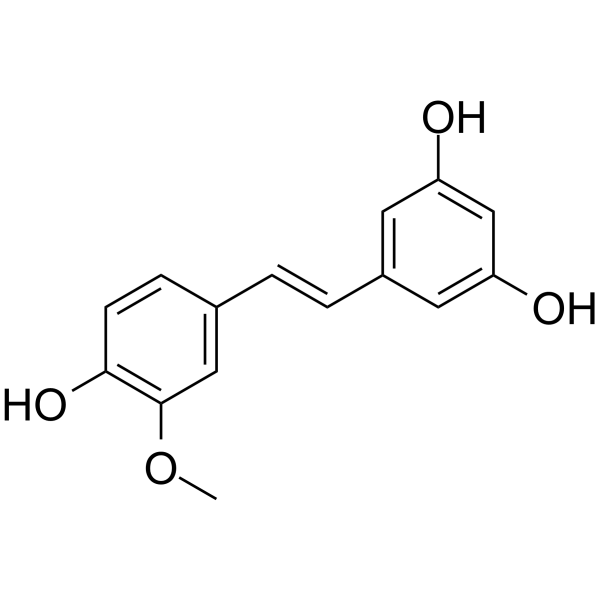
Isorhapontigenin
Based on 4 publication(s) in Google Scholar
Isorhapontigenin is an orally active dietary polyphenol. Isorhapontigenin acts as a potent antioxidant that reduces the production of reactive oxygen species (ROS). Isorhapontigenin promotes the binding of JUN to the AP-1 site on the SESN2 promoter, induces SESN2 transcription, triggers MAPK8-dependent JUN activation, and upregulates the expression of PPAR-α, PGC-1α and CPT-1A to facilitate fatty acid oxidation. Isorhapontigenin induces autophagy, apoptosis and preadipocyte differentiation; it inhibits tumor growth, cell invasion, NF-κB transcriptional activity, the PI3K/Akt signaling pathway, STAT1 phosphorylation and MMP-2 expression. Isorhapontigenin alleviates oxidative stress, inflammatory cytokine release and triglyceride accumulation; it increases intracellular ATP levels and promotes Nrf2 nuclear translocation. Isorhapontigenin improves insulin sensitivity in adipose tissue and glucose tolerance, and reduces postprandial blood glucose, insulin and free fatty acid levels. Isorhapontigenin is applicable to research on bladder cancer, liver injury, chronic obstructive pulmonary disease, acute lung injury and type 2 diabetes.
For research use only. We do not sell to patients.
- Purity : 99.82%
- CAS No.: 32507-66-7
- Formula: C15H14O4
- Molecular Weight:258.27
-
Storage:
4°C, sealed storage, away from moisture and light
* In solvent : -80°C, 6 months; -20°C, 1 month (sealed storage, away from moisture and light)

To place orders, for customer services and technical support, please contact: MedChemExpress USA
Tel: 609-228-6898 E-mail: [email protected] [email protected]


-
 Biological Activity
-
Chemical Information
-
Solvent & Solubility
- Protocols
- Purity & Documentation
- References
-
 Help & FAQs


-
HY-N0828
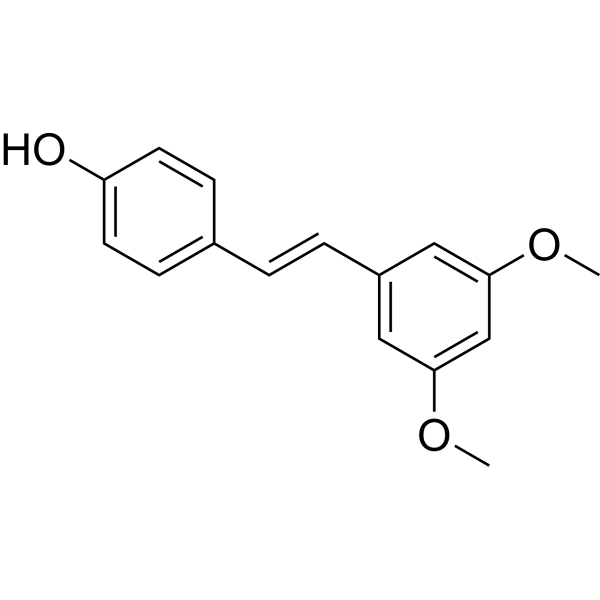
PterostilbeneAutophagy Inducer -
HY-16561
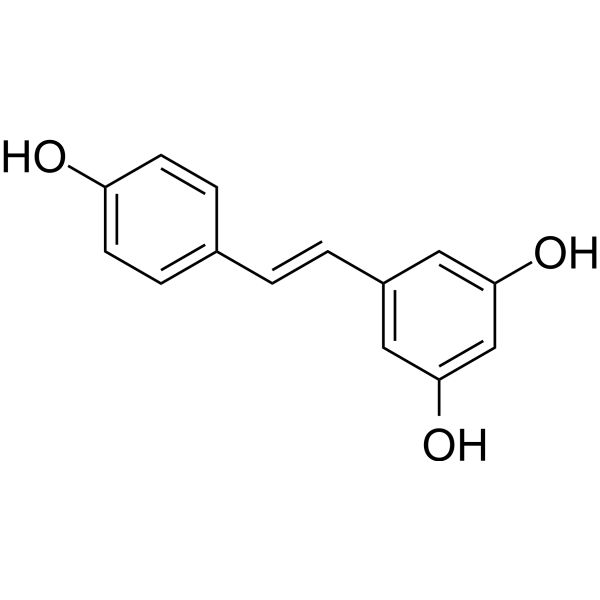
ResveratrolPolyphenolic Phytoalexin -
HY-13518
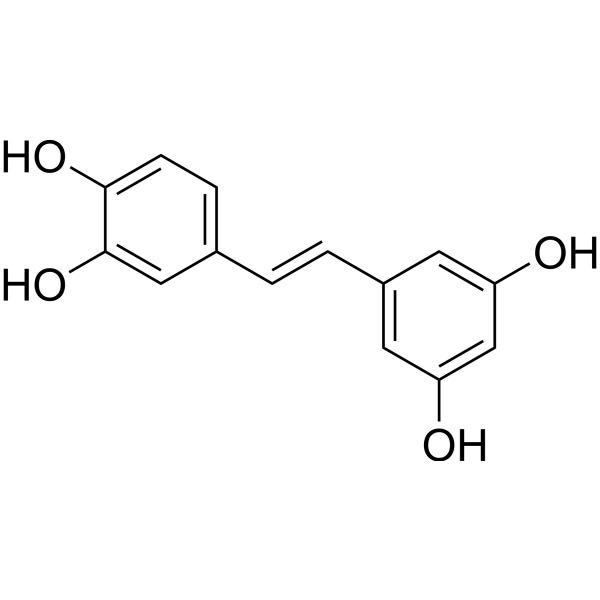
PiceatannolSyk Inhibitor -
HY-N2229
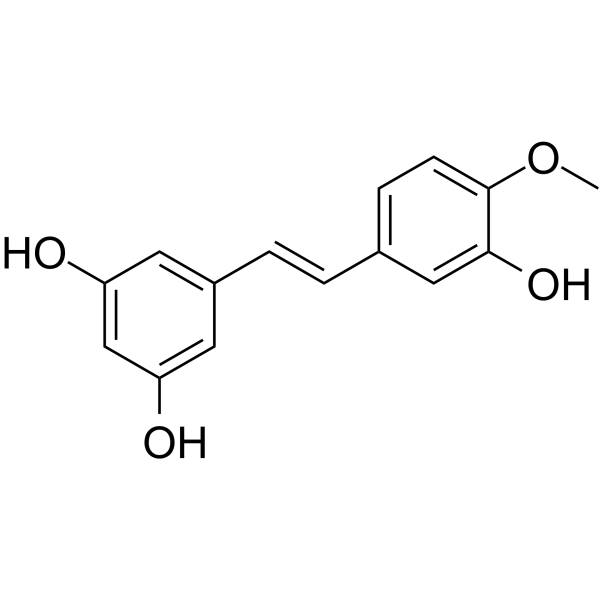
RhapontigeninCytochrome P450 1A1 Inactivator -

HY-N2593R
Isorhapontigenin (Standard)Analytical Standard -

HY-N0828R
Pterostilbene (Standard)Autophagy Inducer -
HY-N0105
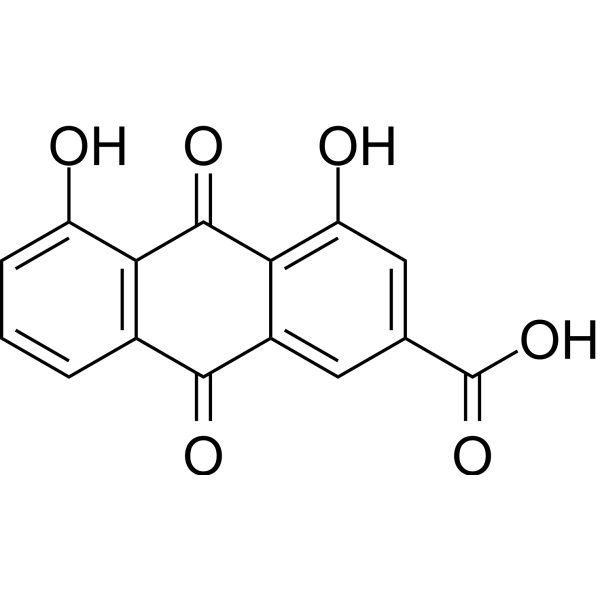
RheinAntioxidant -
HY-N0105R
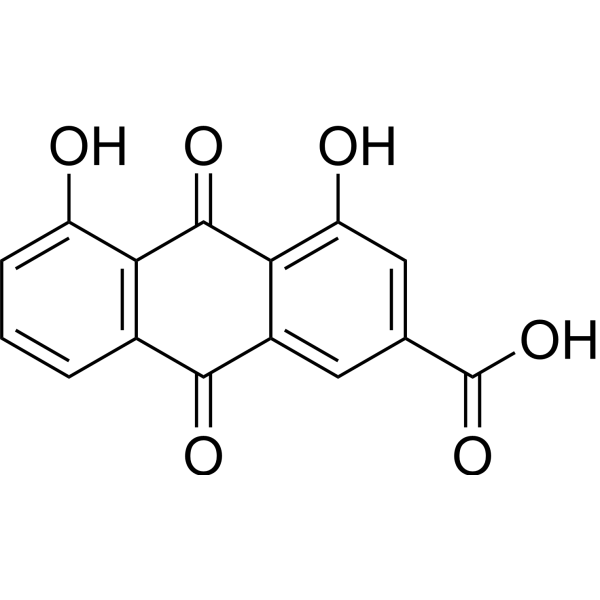
Rhein (Standard)
Publications Citing Use of MedChemExpress (MCE) Isorhapontigenin
More Customer Validation & Images

-
Cell Proliferation/Viability Assay
-
RT-PCR
-
In Vivo Efficacy Study
-
Histological Imaging/Staining
-
WB


Biological Activity
Description
IC50 & Target
|
CPT-1A |
MMP-2 |
PPARα |
PPARγ |
FOXO1 |
IL-6 |
Cellular Effect
|
Cell Line

|
Type | Value | Description | References |
|---|---|---|---|---|
| Platelet | IC50 |
1.85 μM
Compound: Isorhapontigenin
|
Antiplatelet activity in human platelet rich plasma assessed as inhibition of ADP-induced platelet aggregation preincubated for 5 mins followed by ADP addition and measured after 5 mins
Antiplatelet activity in human platelet rich plasma assessed as inhibition of ADP-induced platelet aggregation preincubated for 5 mins followed by ADP addition and measured after 5 mins
|
[PMID: 34731765] |
In Vitro
Isorhapontigenin (1.25-40 μM; 24 h) induces autophagy in a dose-dependent manner in UMUC3, T24T, and HeLa cells, and this autophagy contributes to its inhibition of anchorage-independent growth of UMUC3 cells[1].
Isorhapontigenin (2.5-10 μM; 12-24 h) increases SESN2 transcription via a JUN-dependent mechanism, which is required for autophagy induction and inhibition of anchorage-independent growth in UMUC3 cells[1].
Isorhapontigenin (10 μM; 12 h pre-APAP treatment, 24 h post-APAP treatment) attenuates APAP-induced FAO dysregulation in AML12 cells by upregulating PPAR-α/PGC-1α/CPT-1A signaling[2].
Isorhapontigenin (1-100 μM; 1 h pre-incubation + 24 h stimulation, 1 h pre-incubation + 10-60 min stimulation) inhibits IL-6 and CXCL8 release from primary human airway epithelial cells and A549 cells, with IC50 values for IL-6 of 17.3-19.7 μM, and suppresses NF-κB, AP-1, and PI3K/Akt/FoxO3A signaling pathways[3].
Isorhapontigenin (1-100 μM; 1 h pre-incubation + 30 min stimulation) concentration-dependently reduces intracellular ROS levels in IL-1β-stimulated A549 cells[3].
Isorhapontigenin (5-15 μM; 12 h pretreatment + 12 h LPS stimulation) exerts anti-inflammatory and antioxidant effects on LPS-challenged RAW264.7 cells by reducing pro-inflammatory mediator and ROS production[4].
Isorhapontigenin (15 μM; 0-24 h direct treatment, 12 h pretreatment + 12 h LPS stimulation) activates the Nrf2 pathway in RAW264.7 cells, and its anti-inflammatory/antioxidant effects depend on Nrf2 activation[4].
Isorhapontigenin (25 μM; 6 days) promotes adipocyte differentiation, enhances insulin sensitivity, and reduces lipolysis in 3T3-L1 preadipocytes by increasing PPARγ activity and expression[5].
Isorhapontigenin (25 μM; 0-12 h) increases PPARγ activity and stability in 3T3-L1 cells by reducing inhibitory phosphorylation and decelerating proteasomal degradation[5].
Isorhapontigenin (10-20 μM; 24 h) specifically inhibits invasion of UMUC3 and T24T human invasive bladder cancer cells, respectively, without affecting migration[6].
Isorhapontigenin (2.5-20 μM; 6-18 h) induces dose- and time-dependent upregulation of FOXO1 protein expression in UMUC3 and T24T human invasive bladder cancer cells[6].
Isorhapontigenin (2.5-20 μM; 3-9 h) upregulates foxo1 mRNA expression at the transcriptional level in UMUC3 and T24T human invasive bladder cancer cells[6].
Isorhapontigenin (10 μM; 6-18 h) enhances FOXO1 promoter activity in a time-dependent manner in UMUC3 human invasive bladder cancer cells[6].
Isorhapontigenin (2.5-10 μM; 12 h) inhibits STAT1 phosphorylation at Tyr701 in a dose-dependent manner in UMUC3 human invasive bladder cancer cells[6].
Isorhapontigenin (2.5-20 μM; 18 h) inhibits dose-dependent MMP-2 protein expression in UMUC3 and T24T human invasive bladder cancer cells[6].
MedChemExpress (MCE) has not independently confirmed the accuracy of these methods. They are for reference only. Further protocols information, click here.
-
Cell Line:UMUC3, T24T, HeLa
-
Concentration:1.25 μM, 2.5 μM, 5 μM, 10 μM, 20 μM, 40 μM
-
Incubation Time:24 h
-
Result:Caused a dose-dependent increase in LC3-I to LC3-II conversion in UMUC3, T24T, and HeLa cells. Increased the percentage of GFP-LC3 puncta-positive cells and the number of puncta per cell in a dose-dependent manner in GFP-LC3-transfected UMUC3 cells.
-
Cell Line:UMUC3
-
Concentration:2.5 μM, 5 μM, 10 μM
-
Incubation Time:24 h
-
Result:Increased SESN2 and BECN1 expression at 2.5-10 μM in UMUC3 cells. Saw its induced LC3-II formation unaffected by BECN1 knockdown in UMUC3 cells. Had its LC3-II formation significantly attenuated in SESN2 knockdown UMUC3 cells. Saw its inhibitory effect on anchorage-independent growth of UMUC3 cells abolished when SESN2 was knocked down.
-
Cell Line:UMUC3
-
Concentration:5 μM, 10 μM
-
Incubation Time:6 h, 12 h, 24 h
-
Result:Increased MAPK8 phosphorylation in a dose-dependent manner. Had its induced JUN phosphorylation, SESN2 induction, LC3-II formation, SESN2 mRNA expression, and SESN2 promoter activity blocked when MAPK8 was knocked down. Saw its inhibitory effect on anchorage-independent growth of UMUC3 cells abolished when MAPK8 was knocked down.
-
Cell Line:3T3-L1 preadipocytes
-
Concentration:25 μM
-
Incubation Time:6 days (differentiation)
-
Result:Promoted lipid accumulation (quantified by Oil Red O staining optical density at 490 nm). Significantly increased mRNA and protein expression of PPARγ target genes (CEBPα, FAS, FABP4, GLUT4) and PPARγ itself. Enhanced insulin-stimulated glucose uptake (1.5-fold over basal). Reduced mRNA and protein levels of hormone-sensitive lipase (HSL).
-
Cell Line:UMUC3, T24T human invasive bladder cancer cells
-
Concentration:10 μM (UMUC3 cells); 20 μM (T24T cells)
-
Incubation Time:24 h (UMUC3, T24T cells)
-
Result:Reduced relative invasion rate of UMUC3 cells by 63.1% and T24T cells by 61.2% compared to vehicle control; did not affect cell migration under the same conditions.
-
Cell Line:UMUC3, T24T human invasive bladder cancer cells
-
Concentration:2.5-10 μM (UMUC3 cells, dose-response); 10-20 μM (T24T cells, dose-response); 10 μM (UMUC3 cells, time-course)
-
Incubation Time:12 h (UMUC3, T24T cells, dose-response); 6-18 h (UMUC3 cells, time-course)
-
Result:Induced FOXO1 protein expression in a dose-dependent manner in UMUC3 and T24T cells; caused a gradual increase in FOXO1 protein level.
-
Cell Line:UMUC3, T24T human invasive bladder cancer cells
-
Concentration:2.5-10 μM (UMUC3 cells, dose-response); 10 μM (UMUC3 cells, time-course); 10-20 μM (T24T cells, dose-response)
-
Incubation Time:6 h (UMUC3, T24T cells, dose-response); 3-9 h (UMUC3 cells, time-course)
-
Result:Upregulated endogenous foxo1 mRNA expression in a dose-dependent manner in UMUC3 and T24T cells, and in a time-dependent manner in UMUC3 cells; did not affect exogenous flag-foxo1 mRNA expression.
-
Cell Line:UMUC3 human invasive bladder cancer cells
-
Concentration:2.5-10 μM
-
Incubation Time:12 h
-
Result:Dramatically inhibited STAT1 phosphorylation at Tyr701 in a dose-dependent manner without affecting total STAT1 protein expression.
-
Cell Line:UMUC3, T24T human invasive bladder cancer cells
-
Concentration:2.5-10 μM (UMUC3 cells); 10-20 μM (T24T cells)
-
Incubation Time:18 h (UMUC3, T24T cells)
-
Result:Profoundly inhibited MMP-2 protein expression in a dose-dependent manner in both UMUC3 and T24T cells.
-
Cell Line:T24T human invasive bladder cancer cells
-
Concentration:10-20 μM
-
Incubation Time:18 h
-
Result:Attenuated MMP-2 mRNA level in a dose-dependent manner; did not affect MMP-9 mRNA level.
Parmacokinetics
In Vivo
Isorhapontigenin (25-50 mg/kg; i.g. once of once daily for 3 consecutive days) alleviates acetaminophen-induced liver injury in mice by reducing apoptosis, inflammation, oxidative stress, and restoring fatty acid oxidation, with 25 and 50 mg/kg doses showing efficacy[2].
Isorhapontigenin (51.6 mg/kg; p.o.; daily; 7 days) effectively ameliorates LPS-induced acute lung injury in mice by reducing inflammation and oxidative stress[4].
Isorhapontigenin (25 mg/kg; i.p.; daily; 5 weeks) ameliorates type 2 diabetes in db/db mice by improving glucose and insulin homeostasis, enhancing insulin sensitivity, and modulating adipose tissue function via PPARγ regulation[5].
Isorhapontigenin (150 mg/kg/day; drinking water; daily; 20 weeks) inhibits N-Butyl-N-(4-hydroxybutyl)nitrosamine (BBN) (HY-W755252)-induced invasive bladder cancer formation in C57BL/6J mice, with 16.7% of treated mice developing high-grade muscle-invasive disease versus 100% in BBN-only controls[6].
MedChemExpress (MCE) has not independently confirmed the accuracy of these methods. They are for reference only.
-
Animal Model:C57BL/6 (male, 6-8 weeks old; Acetaminophen-induced liver injury model)[2]
-
Dosage:25 mg/kg; 50 mg/kg
-
Administration:i.g. (once, 1 hour after acetaminophen); i.g. (once daily for 3 consecutive days, acetaminophen on day 3); i.g. (once, 1 hour before acetaminophen); i.g. (once, 3 hours after acetaminophen)
-
Result:Significantly reduced serum ALT, AST, and LDH levels, centrilobular necrosis area, TUNEL-positive cells, C-PARP expression, serum TNF-α and IL-6 levels, liver MDA levels, and increased liver CAT levels at 25 and 50 mg/kg (post-treatment) compared to acetaminophen alone; reduced lipid accumulation (Oil Red O and BODIPY staining), serum and liver TG levels, increased liver ATP content and FAO activity, and upregulated PPAR-α, PGC-1α, and CPT-1A protein expression at 50 mg/kg (pre-treatment).
-
Animal Model:C57BL/6 (male, 6-8 weeks old, 20-25 g, LPS-challenged)[4]
-
Dosage:51.6 mg/kg
-
Administration:p.o.; daily; 7 days
-
Result:Reduced LPS-induced lung injury score, myeloperoxidase (MPO) activity in lung tissues, lung wet/dry weight ratio, and protein concentration in bronchoalveolar lavage fluid (BALF); suppressed LPS-induced increases in BALF concentrations of IL-1β, IL-6, and TNF-α; inhibited p-NF-κB p65 expression and IκB degradation in lung tissues; reduced malondialdehyde (MDA) formation in lung tissues; restored superoxide dismutase (SOD) and glutathione (GSH) activities in lung tissues.
-
Animal Model:db/db mice (male, 8 weeks old at treatment start, genetically diabetic model)[5]
-
Dosage:25 mg/kg
-
Administration:i.p.; daily; 5 weeks
-
Result:Reduced postprandial fasting glucose levels by 17.2% after 2 weeks and 40.0% after 5 weeks; reduced insulin levels by 23.2% after 5 weeks; reduced plasma FFA levels by 34.7% after 5 weeks compared to vehicle controls; improved glucose disposal during GTT; enhanced exogenous-insulin-stimulated glucose uptake during ITT; significantly reduced water intake; reduced white adipose tissue adipocyte diameters; significantly increased mRNA expression of PPARγ and its target genes (Fabp4, Glut4, Fas); significantly reduced mRNA and protein levels of HSL; significantly increased insulin-stimulated Akt phosphorylation in white adipose tissue.
-
Animal Model:C57BL/6J (male, 5-6 weeks old) injected with N-Butyl-N-(4-hydroxybutyl)nitrosamine[6]
-
Dosage:150 mg/kg/day
-
Administration:oral via drinking water; daily; 20 weeks
-
Result:Reduced the incidence of BBN-induced high-grade muscle-invasive bladder cancer from 100% (12/12 mice) to 16.7% (2/12 mice); caused 7 cases of papillomas and 3 cases of low-grade non-muscle-invasive bladder cancer in treated mice; up-regulated FOXO1 protein expression and down-regulated MMP-2 protein expression in mouse bladder tissues.


Chemical Information
-
CAS No. 32507-66-7
-
Appearance Solid
-
Molecular Weight 258.27
-
Formula C15H14O4
-
Color White to yellow
-
SMILES
OC1=CC(O)=CC(/C=C/C2=CC(OC)=C(O)C=C2)=C1
-
Structure Classification
-
Initial Source
-
Shipping
Room temperature in continental US; may vary elsewhere.
-
Storage
4°C, sealed storage, away from moisture and light
* In solvent : -80°C, 6 months; -20°C, 1 month (sealed storage, away from moisture and light)


Publications (4)
-
Journal Impact Factor
-
Most Recent
-
Int Immunopharmacol
Isorhapontigenin suppresses inflammation, proliferation and aggressiveness of rheumatoid arthritis fibroblast-like synoviocytes by targeting farnesyl diphosphate synthase. [Abstract]2025 Jun 26:159:114894. PMID: 40412131 -
Int Immunopharmacol
Isorhapontigenin delays senescence and matrix degradation of nucleus pulposus cells via PI3K/AKT/mTOR-mediated autophagy pathway in vitro and alleviates intervertebral disc degeneration in vivo. [Abstract]2024 Sep 30:139:112717. PMID: 39067404 -
mSphere
Exploring the potential of isorhapontigenin: attenuating Staphylococcus aureus virulence through MgrA-mediated regulation. [Abstract]2024 Jun 25;9(6):e0031724. PMID: 38837389
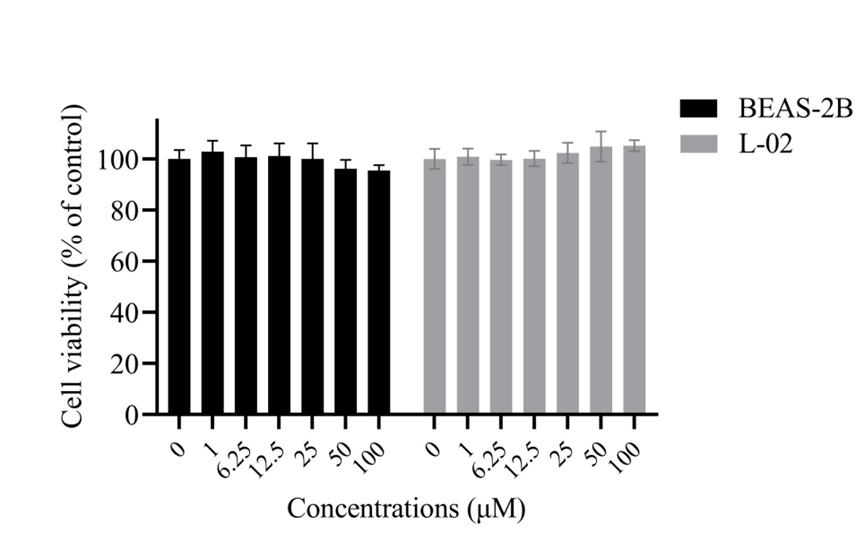
Isorhapontigenin purchased from MedChemExpress. Usage Cited in: mSphere. 2024 Jun 25;9(6):e0031724. [Abstract]
Cell viability of BEAS-2B and L-02 cell lines after 24-h exposure to various concentrations of Isorhapontigenin (0, 1, 6.25, 12.5, 25, 50, 100 μM).
Isorhapontigenin purchased from MedChemExpress. Usage Cited in: mSphere. 2024 Jun 25;9(6):e0031724. [Abstract]
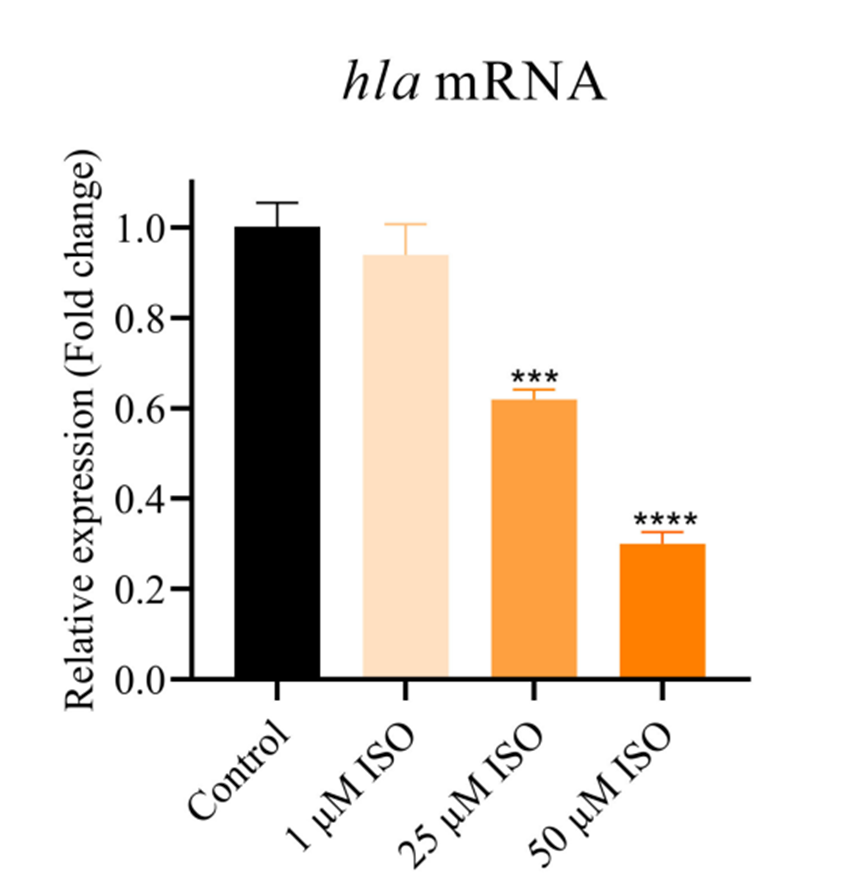
RT-qPCR analysis of the effect of Isorhapontigenin (ISO) (1, 25, 50 μM) on the expression of the hla gene.
Isorhapontigenin purchased from MedChemExpress. Usage Cited in: mSphere. 2024 Jun 25;9(6):e0031724. [Abstract]
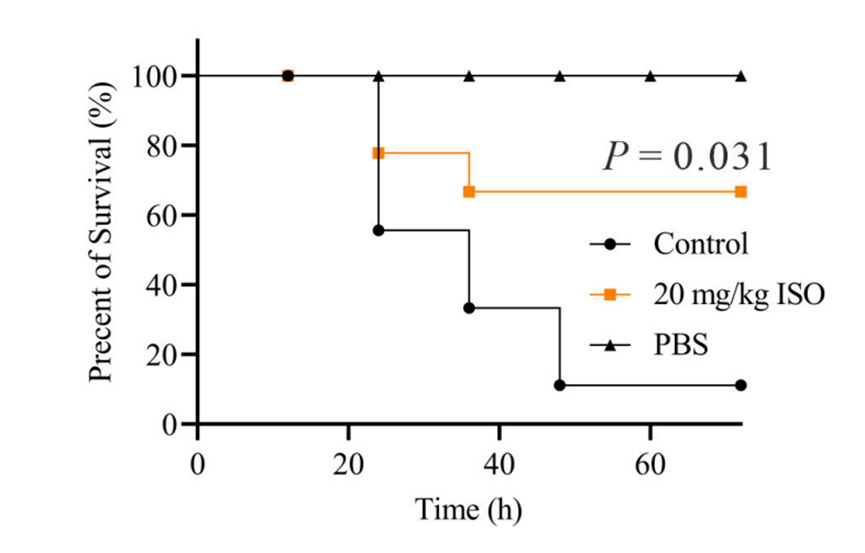
The impact of Isorhapontigenin (ISO) (20 mg/kg, s.c.) on survival rates of mice infected with a lethal dose of S. aureus Newman.
Isorhapontigenin purchased from MedChemExpress. Usage Cited in: mSphere. 2024 Jun 25;9(6):e0031724. [Abstract]
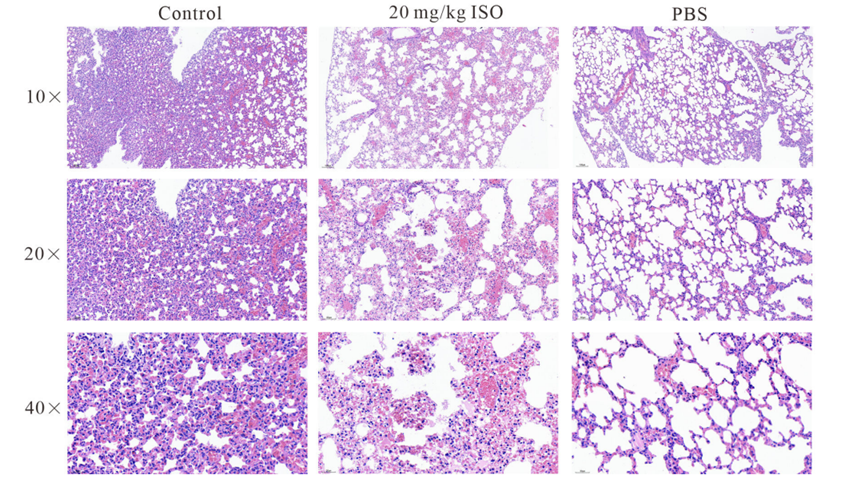
Histological analysis of the impact of Isorhapontigenin (ISO) (20 mg/kg, s.c.) on the lungs of mice, using H&E staining.
Isorhapontigenin purchased from MedChemExpress. Usage Cited in: mSphere. 2024 Jun 25;9(6):e0031724. [Abstract]
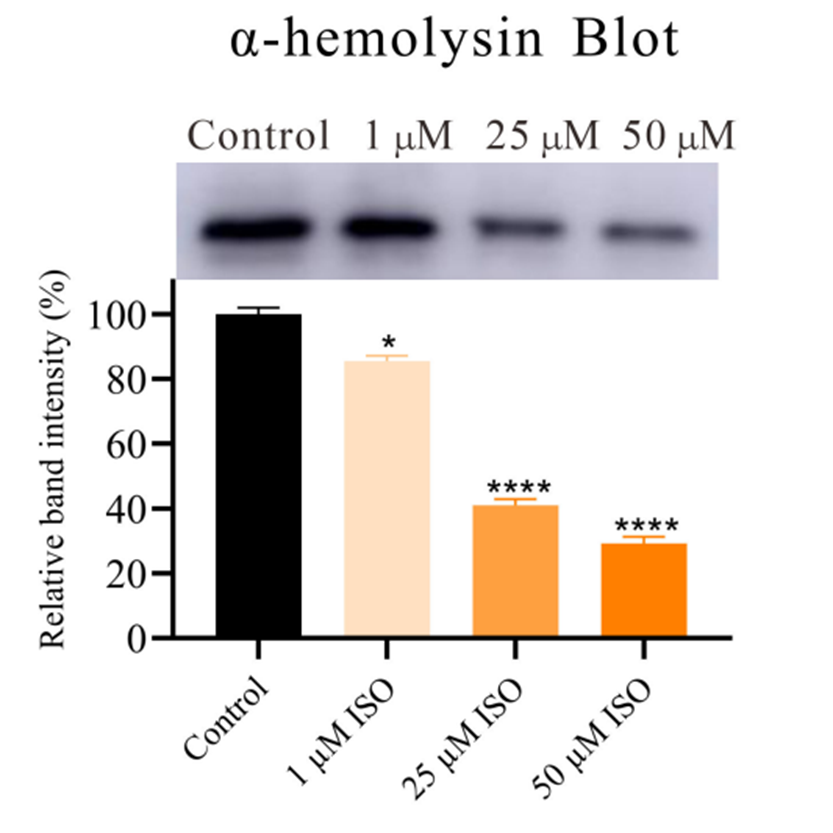
Western blot analysis of the impact of Isorhapontigenin ISO (1, 25, 50 μM) on the production of α-hemolysin.
-
Biomed Res Int
Anti-influenza A Virus Effects and Mechanisms of Emodin and Its Analogs via Regulating PPAR α/ γ-AMPK-SIRT1 Pathway and Fatty Acid Metabolism. [Abstract]2021 Sep 9;2021:9066938. PMID: 34540999


Solvent & Solubility
In Vitro:
DMSO : 50 mg/mL (193.60 mM; Need ultrasonic; Hygroscopic DMSO has a significant impact on the solubility of product, please use newly opened DMSO)
Please refer to the solubility information to select the appropriate solvent. Once prepared, please aliquot and store the solution to prevent product inactivation from repeated freeze-thaw cycles.
Storage method and period of stock solution: -80°C, 6 months; -20°C, 1 month (sealed storage, away from moisture and light). When stored at -80°C, please use it within 6 months. When stored at -20°C, please use it within 1 month.
Please refer to the solubility information to select the appropriate solvent. Once prepared, please aliquot and store the solution to prevent product inactivation from repeated freeze-thaw cycles.
Storage method and period of stock solution: -80°C, 6 months; -20°C, 1 month (sealed storage, away from moisture and light). When stored at -80°C, please use it within 6 months. When stored at -20°C, please use it within 1 month.
Concentration (start) × Volume (start) = Concentration (final) × Volume (final)
In Vivo:
Select the appropriate dissolution method based on your experimental animal and administration route.
- For the following dissolution methods, please ensure to first prepare a clear stock solution using an In Vitro approach and then sequentially add co-solvents:
- To ensure reliable experimental results, the clarified stock solution can be appropriately stored based on storage conditions. As for the working solution for In Vivo experiments, it is recommended to prepare freshly and use it on the same day.
- The percentages shown for the solvents indicate their volumetric ratio in the final prepared solution. If precipitation or phase separation occurs during preparation, heat and/or sonication can be used to aid dissolution.
Add each solvent one by one: 10% DMSO 40% PEG300 5% Tween-80 45% Saline
Solubility: ≥ 2.5 mg/mL (9.68 mM); Clear solution
This protocol yields a clear solution of ≥ 2.5 mg/mL (saturation unknown).
Taking 1 mL working solution as an example, add 100 μL DMSO stock solution (25.0 mg/mL) to 400 μL PEG300, and mix evenly; then add 50 μL Tween-80 and mix evenly; then add 450 μL Saline to adjust the volume to 1 mL.
Preparation of Saline: Dissolve 0.9 g sodium chloride in ddH₂O and dilute to 100 mL to obtain a clear Saline solution.
Add each solvent one by one: 10% DMSO 90% (20% SBE-β-CD in Saline)
Solubility: 2.5 mg/mL (9.68 mM); Suspended solution; Need ultrasonic
This protocol yields a suspended solution of 2.5 mg/mL. Suspended solution can be used for oral and intraperitoneal injection.
Taking 1 mL working solution as an example, add 100 μL DMSO stock solution (25.0 mg/mL) to 900 μL 20% SBE-β-CD in Saline, and mix evenly.
Preparation of 20% SBE-β-CD in Saline (4°C, storage for one week): 2 g SBE-β-CD powder is dissolved in 10 mL Saline, completely dissolve until clear.
In Vivo Dissolution Calculator
Please enter the basic information of animal experiments:
-
-
-
-
Recommended: Prepare an additional quantity of animals to account for potential losses during experiments.
Please enter your animal formula composition:
-
%DMSO +
Recommended: Keep the proportion of DMSO in working solution below 2% if your animal is weak.
-
%+
-
+%Tween-80 + +
-
%Saline +
The co-solvents required include: DMSO, . All of co-solvents are available by MedChemExpress (MCE). , Tween 80. All of co-solvents are available by MedChemExpress (MCE).
Working solution concentration: 0.22 mg/mL
Method for preparing stock solution: mg drug dissolved in μL DMSO. Stock solution concentration: mg/mL. * In solvent : -80°C, 6 months; -20°C, 1 month (sealed storage, away from moisture and light)
1. Take μL DMSO stock solution;
2. Add μL .
μL , mix evenly;
3. Then add μL Tween 80, mix evenly;
4. Then add μL
Please ensure that the stock solution in the first step is dissolved to a clear state, and add co-solvents in sequence. You can use ultrasonic heating (ultrasonic cleaner, recommended frequency 20-40 kHz), vortexing, etc. to assist dissolution.

Protocols
-
RNA extraction experimental
By lysing cells, releasing RNA, and removing impurities such as proteins and DNA, high-purity RNA products are finally obtained. The commonly used traditional method is the guanidine isothiocyanate/phenol/chloroform method (Trizol), which is suitable for a variety of animal materials including animal tissues, microorganisms, cultured cells, etc., and most plant materials.
-
Dual Luciferin reporter gene assay
Luciferin reporter gene assay is a reporting system to detect the activity of Firefly Luciferase using luciferin as a substrate, which is often used in the research of miRNA target gene verification and promoter transcriptive activity regulation. Dual luciferase usually refers to Firefly luciferase and Renilla luciferase.
-
Cytoplasmic-Nuclear Fractionated Protein Extraction
Cytoplasmic-nuclear fractionated protein extraction separates soluble cytoplasmic proteins from nuclear-enriched proteins by mild plasma-membrane permeabilization, differential centrifugation, washing of nuclei, and extraction of nuclear proteins for downstream immunoblotting or related molecular analysis. The readout is the relative abundance of a protein in cytoplasmic and nuclear fractions, commonly assessed by western blotting together with compartment markers such as tubulin or pyruvate kinase for cytoplasm and lamin, nucleoporin, hnRNP, H2AX, or Lamin B for nuclear fractions.
-
Apoptosis
Apoptosis, also called programmed cell death, is generally characterized by distinct morphological characteristics.
-
TUNEL staining for apoptotic DNA fragmentation
TUNEL staining detects DNA strand breaks by using terminal deoxynucleotidyl transferase to add labeled nucleotides to exposed 3′-OH DNA termini, generating either microscopic staining in fixed cells or tissue sections, or fluorescence/cytometric signal in cell suspensions. TUNEL positivity reflects DNA fragmentation but should not be interpreted alone as definitive apoptosis, because TUNEL can also label necrotic, autolytic, mechanically damaged, or DNA-repair-associated DNA breaks.
-
Research Protocol for Endocrine Diseases
Endocrine diseases often arise from disrupted hormone production, hormone signaling, or target-tissue responsiveness; for diabetes-focused endocrine disease models, insulin signaling regulates glucose uptake, hepatic glucose output, lipid metabolism, and β-cell compensation. Type 2 diabetes develops through interacting defects in insulin resistance, β-cell dysfunction, adipose inflammation, hepatic glucose overproduction, altered incretin signaling, and ectopic lipid metabolism. A major unresolved question is whether endocrine dysfunction is driven primarily by target-tissue insulin resistance, intrinsic β-cell failure, immune/inflammatory stress, or combined multi-organ failure that differs by disease stage.
-
Large-size fat particle sorting
Large-size fat particle sorting is widely used to isolate cells up to 200 μm in diameter. Single-cell flow sorting will allow greater insight into adipocyte heterogeneity by identifying gene expression, protein composition, and metabolic signatures at the single-cell level.
-
Autophagy
Autophagy is a process in which eukaryotic cells use lysosomes to degrade their own cytoplasmic proteins and damaged organelles under the regulation of autophagy related gene (Atg). Microtubule-associated proteins light chain 3 (LC3) is recognized as autophagy marker, which transfers from cytoplasmic LC3 (LC3-I) to membrane type (LC3-II). LC3-II/I ratio could be detected by Western Blot and fluorescence microscopy.
-
Mitochondrial membrane-potential and mitochondrial mass staining
Mitochondrial membrane potential staining measures the electrochemical polarization across the mitochondrial inner membrane in live cells using lipophilic cationic fluorescent probes; early rhodamine-based work showed that selective mitochondrial dye accumulation is lost when the mitochondrial transmembrane potential is dissipated. JC-1 reports mitochondrial polarization by shifting from green monomer fluorescence to red J-aggregate fluorescence as dye concentration increases within energized mitochondria; therefore, the red/green fluorescence ratio is used as a relative readout of mitochondrial membrane potential. TMRE or TMRM staining provides a single-channel relative readout because these cationic rhodamine esters accumulate in polarized mitochondria, and lower fluorescence indicates reduced mitochondrial polarization when acquisition and dye-loading conditions are controlled. Mitochondrial mass staining is commonly performed with MitoTracker Green FM or related MitoTracker dyes as
-
Apoptosis Solutions
Apoptosis is a regulated, generally non-lytic cell-death pathway that removes unwanted, damaged, infected, or abnormal cells through coordinated morphological changes, caspase activation, DNA fragmentation, and membrane remodeling. The intrinsic apoptosis pathway is controlled mainly by mitochondrial outer membrane permeabilization, BCL-2 family proteins, cytochrome c release, apoptosome formation, caspase-9 activation, and downstream executioner caspase-3/7 activation. The extrinsic apoptosis pathway is initiated by death receptors such as Fas, TNFR, and TRAIL receptors, which recruit adaptor proteins and activate caspase-8 before engaging executioner caspases or mitochondrial amplification through BID cleavage. Apoptosis is linked to many phenotypes, including cancer cell killing, tissue homeostasis, immune regulation, neurodegeneration, infection response, and treatment-induced cytotoxicity; unresolved questions include how apoptosis interacts with necroptosis, pyroptosis, ferroptos
-
Organotypic 3D Invasion Assay
The organotypic 3D invasion assay measures carcinoma-cell invasion into a fibroblast-remodeled extracellular matrix, usually collagen I with or without basement-membrane matrix, under an air-liquid or grid-supported culture condition; the readout is invasion depth, invaded area, or an invasion index from histological or fluorescence images. This assay models stromal regulation of invasion because fibroblasts or CAFs remodel matrix, generate tracks, and can lead collective carcinoma-cell invasion; the resulting cancer-cell penetration into the gel reflects tumor-stroma-ECM interactions rather than migration on a rigid 2D substrate.
-
Cell invasion
Cell invasion is the ability of cells to migrate from one area to another via the extracellular matrix. Cell invasion is the response of normal and cancer cells to chemical and mechanical stimuli. Before migrating to a new region, the extracellular matrix is degraded by proteases within the cell. Cell invasion often occurs during wound repair, vascularization and inflammation, abnormal tissue invasion, and tumor cell metastasis.
-
Matrigel/ECM Transwell Invasion Assay
The Matrigel/ECM Transwell invasion assay measures the ability of cells to move toward a chemoattractant while crossing an extracellular-matrix barrier placed on a porous membrane; therefore, the readout reflects both chemotactic motility and matrix invasion rather than migration alone. Matrigel is a basement-membrane-rich matrix derived from Engelbreth-Holm-Swarm mouse sarcoma and has been used as a reconstituted basement membrane barrier in chemoinvasion assays. The assay readout is generated by quantifying cells that reach the underside of the insert membrane or lower compartment after incubation, commonly by staining and counting invaded cells or by fluorescence-based quantification.
-
Lysosome and acidic-vesicle live-cell staining
Lysosome and acidic-vesicle live-cell staining detects acidic intracellular compartments by using membrane-permeant acidotropic probes that accumulate in low-pH vesicles, including lysosomes, late endosomes, autolysosomes, and acidic phagosomes. LysoTracker staining is commonly used as an intensity-based readout of acidic lysosomal compartment abundance or enlargement, while acridine orange produces green fluorescence in less concentrated compartments and red fluorescence after concentration-dependent accumulation in acidic vesicular organelles. Loss or reduction of acridine-orange red signal can be used as a readout of lysosomal membrane permeabilization or reduced acidic-vesicle integrity. This protocol is designed for live cultured cells and can be adapted for fluorescence microscopy, high-content imaging, plate-reader readout, or flow cytometry when the selected literature supports the readout. Because these dyes report acidotropic accumulation rather than lysosome identity alone,
-
Inhalation Toxicity Study
Inhalation toxicity studies expose rodents to a controlled aerosol, vapor, gas, or smoke atmosphere and assess respiratory and systemic toxicity using exposure-atmosphere characterization, clinical observations, body and organ weights, bronchoalveolar lavage fluid, histopathology, blood chemistry, hematology, and, when included, molecular endpoints such as transcriptomics, proteomics, lipidomics, or tissue burden analysis. The primary biological readouts are airway irritation, pulmonary inflammation, cytotoxicity, altered surfactant or lipid homeostasis, impaired particle clearance, and tissue remodeling, reflected by BALF cell differentials, BALF protein, LDH, phosphatase activities, cytokines, lung weight, microscopic respiratory-tract lesions, and retained lung burden.
-
Macroautophagy Solutions
Macroautophagy is a conserved lysosome-dependent degradation pathway in which cytoplasmic material is sequestered into double-membrane autophagosomes and delivered to lysosomes for degradation and recycling. The pathway supports cellular homeostasis during nutrient limitation, organelle stress, protein-aggregate accumulation, infection, differentiation, and tissue remodeling by coupling cargo sequestration, autophagosome maturation, lysosomal fusion, and degradation of cargo-derived macromolecules. The core molecular sequence includes initiation by nutrient- and stress-regulated autophagy machinery, autophagosome nucleation, LC3/ATG8-family conjugation to autophagosomal membranes, cargo selection through receptors such as SQSTM1/p62, autophagosome-lysosome fusion, and lysosomal degradation. LC3 was identified as a mammalian homolog of yeast Atg8 that localizes to autophagosomal membranes after processing, and p62/SQSTM1 was shown to connect ubiquitinated cargo with autophagic degradati
-
3D Collagen/Hydrogel Matrix Invasion Assay
The 3D collagen/hydrogel matrix invasion assay is based on embedding cells within or on top of a three-dimensional fibrillar extracellular matrix (typically type I collagen or collagen-rich hydrogels) to model cell migration through a physiologically relevant physical barrier. In this system, invasive behavior is quantified by measuring the ability of cells to degrade, remodel, and migrate through the 3D matrix architecture, which better reflects in vivo tissue invasion compared to 2D migration assays. Collagen-based 3D matrices provide structural cues such as fiber alignment and porosity that influence cell motility and integrin-mediated adhesion, enabling observation of collective or single-cell invasion modes depending on matrix density and organization.
-
Spheroid/Tumor Organoid Invasion Assay
The spheroid/tumor organoid invasion assay measures outward movement of cancer cells from a compact 3D aggregate into an extracellular matrix, usually collagen I, basement membrane matrix, or mixed collagen-Matrigel hydrogels; the readout is generated by bright-field, fluorescence, confocal, or time-lapse imaging of cell egress, invasion area, invasion distance, dispersion, protrusion formation, basement-membrane perforation, or cell trajectories. The assay reflects cell-cell cohesion, cell-matrix adhesion, matrix remodeling, protease-dependent invasion, contractility, and invasion behavior in a 3D microenvironment rather than migration on a flat 2D surface.
-
Ex Vivo Tissue Slice/Explant Invasion Assay
Ex vivo organotypic tissue slice cultures are based on maintaining thin, viable tissue sections at an air-liquid interface to preserve native cytoarchitecture and local cell-matrix interactions, enabling observation of cell behavior such as migration and tissue infiltration within a physiologically relevant 3D microenvironment. The method relies on maintaining tissue viability on porous membrane supports, allowing diffusion of nutrients and oxygen while preserving structural integrity for extended culture periods, which makes it suitable for studying dynamic cellular processes in intact tissue contexts such as cell movement and tissue remodeling. .
-
Western Blot
Western blotting (WB) is a commonly used experimental method in molecular biology, biochemistry, and immunogenetics for identifying and quantifying target proteins. It combines gel electrophoresis with immunoassay, enabling researchers to analyze protein expression, post-translational modifications, and molecular weight.
-
Patient-Derived Organoid Invasion Assay
Patient-derived organoid (PDO) invasion assays are based on the ability of epithelial tumor organoids to self-organize in three-dimensional extracellular matrix (ECM) hydrogels (commonly Matrigel) and to recapitulate key aspects of in vivo tissue architecture, including polarity, proliferation, and invasive outgrowth when exposed to permissive microenvironmental cues. In this system, invasion is operationally defined as the emergence of multicellular protrusions, collective budding, or single-cell dissemination from the organoid core into the surrounding ECM, reflecting epithelial-mesenchymal plasticity and matrix remodeling capacity. Organoid morphology and invasive behavior are typically monitored using brightfield or confocal microscopy over time, enabling quantitative assessment of invasion area, protrusion number, and structural disruption of the organoid spheroid architecture.
-
Mitochondrial membrane-potential fluorescent assay
Mitochondrial membrane potential fluorescent assays estimate ΔΨm in living cells using lipophilic cationic dyes such as TMRM, TMRE, rhodamine 123, and JC-1, which accumulate in mitochondria according to membrane polarization; loss of signal after FCCP or CCCP treatment is interpreted as mitochondrial depolarization. TMRM/TMRE and rhodamine 123 are commonly used for semi-quantitative live-cell microscopy or flow cytometry, while JC-1 can report a shift from red aggregate fluorescence to green monomer fluorescence during depolarization; interpretation requires controls because dye concentration, quenching mode, cell type, dye efflux, and mitochondrial mass can affect fluorescence independently of ΔΨm.
-
Annexin V plus membrane-impermeant dye apoptosis staining
Annexin V-based apoptosis assays rely on the detection of phosphatidylserine (PS) externalization from the inner leaflet of the plasma membrane to the outer leaflet, an early biochemical hallmark of apoptosis. Fluorescently labeled Annexin V binds PS in a calcium-dependent manner, enabling identification of early apoptotic cells by flow cytometry or fluorescence microscopy. When combined with a membrane-impermeant DNA-binding dye (e. g. , propidium iodide), this approach allows discrimination between viable (Annexin V−/dye−), early apoptotic (Annexin V+/dye−), and late apoptotic or necrotic (Annexin V+/dye+) cell populations by assessing membrane integrity and PS exposure.
-
ROS/oxidative-stress fluorescent staining
ROS/oxidative-stress fluorescent staining uses cell-permeant fluorogenic probes that become fluorescent after oxidation inside cells or tissues; commonly used examples include DCFH-DA/DCFDA for broad cellular oxidant detection, DHE for superoxide-related signal detection, MitoSOX for mitochondrial superoxide-related signal detection, and CellROX probes for oxidative-stress-associated fluorescence readouts. The assay detects probe oxidation rather than a single ROS species unless the probe and analysis method have been chemically validated for that species. DCFH-DA enters cells, is deacetylated by intracellular esterases to DCFH, and produces fluorescent DCF after oxidation, so the readout is used as an operational measure of total cellular oxidative stress rather than a species-specific ROS measurement. DHE and MitoSOX can report superoxide-related oxidation, but red fluorescence alone can include non-specific ethidium-like oxidation products; HPLC or optimized spectral approaches are
-
Patient-Derived Orthotopic Xenograft (PDOX)
Patient-derived orthotopic xenograft (PDOX) modeling implants fresh patient tumor tissue or patient-derived tumor cells into the anatomically corresponding organ or tissue site of immunodeficient mice, usually by surgical orthotopic implantation, to preserve patient tumor histology, local microenvironmental context, invasion, metastatic behavior, and treatment-response features better than subcutaneous implantation. PDOX readouts include tumor engraftment, orthotopic tumor growth, local invasion, metastasis, recurrence after resection, histologic similarity to the donor tumor, biomarker retention, molecular concordance, survival, and response or resistance to therapy. PDOX models are used for preclinical drug testing and individualized therapy evaluation, but engraftment success varies by tumor type and specimen quality.
-
Research Protocol for Inflammation-related Diseases
The NLRP3 inflammasome is a cytosolic innate immune signaling platform that integrates priming signals and danger-signal activation to promote caspase-1 activation, maturation of IL-1β and IL-18, and gasdermin D-mediated pyroptotic cell death. The core experimental logic is to determine whether inflammatory disease phenotypes are driven by increased NLRP3 expression, ASC-containing inflammasome assembly, caspase-1 cleavage, GSDMD cleavage, and extracellular release of IL-1β/IL-18 rather than by nonspecific cell injury alone. The pathway is strongly linked to inflammation-related disease phenotypes because monosodium urate crystals activate NALP3/NLRP3 inflammasome signaling in gout-like crystal inflammation, cholesterol crystals activate NLRP3 inflammasomes in atherogenesis models, and DSS-induced intestinal inflammation has been reported to involve NLRP3 inflammasome activity. However, experimental colitis studies also show context-dependent protective effects of NLRP3 inflammasome co
-
Research Protocol for Metabolic Diseases
AMP-activated protein kinase, AMPK, is a conserved cellular energy sensor that responds to reduced cellular energy status and coordinates metabolism by increasing ATP-generating catabolic pathways while suppressing ATP-consuming anabolic processes. In metabolic disease research, the AMPK pathway is experimentally relevant because it regulates hepatic lipid synthesis, fatty acid oxidation, glucose production, skeletal-muscle glucose disposal, mTORC1-linked biosynthesis, autophagy, mitochondrial homeostasis, and whole-body energy balance. The central pathway logic is that energy stress, metformin, exercise-like stimulation, or direct AMPK activators increase AMPKα Thr172 phosphorylation and downstream substrate phosphorylation, including ACC and RAPTOR. Phosphorylation of ACC suppresses lipogenesis and supports fatty acid oxidation, whereas phosphorylation of RAPTOR suppresses mTORC1 signaling and links cellular energy status to growth and protein synthesis control. The pathway is linked
-
3D Tumor Spheroid Invasion Assay
3D tumor spheroid invasion assay measures outward tumor-cell movement from a compact multicellular spheroid into a surrounding extracellular matrix, producing image-based readouts such as invasion area, invasion distance, cell dispersion, or time-resolved cell movement. The method models tumor-cell interaction with matrix components in three dimensions and is used to study invasive phenotypes in cancer models including glioblastoma, squamous cell carcinoma, breast cancer, prostate cancer, ovarian cancer, and other solid tumor systems.
-
Matrigel Transwell/Boyden Chamber Invasion Assay
Matrigel Transwell/Boyden chamber invasion assay measures the ability of cells to degrade or traverse an extracellular matrix-coated porous membrane and move from an upper chamber toward a chemoattractant in a lower chamber. Invasion is distinguished from migration by coating the membrane with Matrigel or basement membrane matrix; uncoated inserts measure migration, while coated inserts require cells to cross an ECM barrier before reaching the underside of the membrane.
-
Invadopodia/Fluorescent Gelatin Degradation Assay
Invadopodia/fluorescent gelatin degradation assay detects proteolytic extracellular matrix degradation by cancer-cell invadopodia, which are actin-rich protrusive structures associated with matrix remodeling, invasion, and metastasis. The readout is generated by culturing cells on fluorescent gelatin and measuring dark degraded areas where fluorescent substrate has been locally removed, often together with immunofluorescent detection of invadopodia markers such as F-actin, cortactin, and TKS5.
-
Kinase activity and phosphorylation assays
Kinase activity assays measure the ability of kinases to transfer phosphate groups from ATP to specific substrates, while phosphorylation assays detect the presence and levels of phosphorylated proteins. Common methods include radiolabeled ATP incorporation (e. g. ,), ADP release detection via bioluminescence (e. g. ,[3]), enzyme-linked immunosorbent assays (ELISA) for phospho-specific epitopes (e. g. ,[6]), and microtiter-based formats for high-throughput screening (e. g. ,[8]). The ADP-Glo assay quantifies kinase activity by measuring ADP produced during phosphorylation using a luciferase-based system. Radiometric assays involve autoradiography or scintillation counting after incorporation of 32P-labeled ATP into substrate proteins. ELISA-based approaches rely on phospho-specific antibodies to detect activated kinases in cell lysates or purified samples.
-
3T3-L1 preadipocyte-to-adipocyte differentiation
3T3-L1 preadipocytes are induced to differentiate after growth arrest using adipogenic media containing insulin, dexamethasone, and IBMX; differentiation is assessed by lipid-droplet accumulation, triglyceride increase, Oil Red O staining, and adipocyte-marker induction such as PPARγ and C/EBPα.
-
Patient-Derived Xenograft (PDX)
Patient-derived xenograft (PDX) models are generated by engrafting primary human tumor tissue directly into immunodeficient mice, allowing in vivo propagation of patient tumor biology without initial in vitro adaptation. These models are used to preserve key histopathological and molecular characteristics of the original tumor and enable assessment of tumor growth dynamics and therapeutic response in a living organism. The biological readout is tumor engraftment and subsequent growth in the murine host, which reflects the ability of human tumor cells to survive, vascularize, and expand in an immunocompromised microenvironment.
-
Protocol for Kinase activity and phosphorylation assays
Kinase activity assays measure transfer of phosphate from ATP to a protein or peptide substrate, generating phosphorylated substrate, ADP, or incorporated radiolabeled phosphate as the readout; phosphorylation assays measure site-specific phosphorylation in cells or tissues as a proxy for kinase-pathway activation, inhibition, or substrate regulation. Phosphorylation can be detected by phospho-specific Western blot, immunoprecipitation kinase assay, phospho-immunofluorescence, phospho-flow cytometry, luminescent ADP detection, radiolabeled ATP incorporation, or reporter-based pathway assays, and these readouts can be applied to cancer cells, primary neurons, mouse tumors, organoids, inflammatory macrophages, ferroptosis studies, and mitophagy studies when the kinase target is biologically relevant.
-
Subcutaneous Cell-Line-Derived Xenograft
Subcutaneous cell-line-derived xenograft (CDX) models are established by implanting cultured human cancer cell lines into immunodeficient mice, where the injected cells form localized tumors that can be monitored in vivo as a measure of tumorigenic potential, growth kinetics, and treatment response. These models are widely used in oncology research because they allow reproducible tumor formation and enable comparative assessment of tumor growth between different cell lines or genetic manipulations in a controlled in vivo microenvironment. Subcutaneous implantation of cancer cells in immunodeficient mice is a standard approach for evaluating tumor growth behavior and therapeutic response across multiple cancer types, including prostate, esophageal, pancreatic, and colon cancer models.
-
Orthotopic Cell-Line Xenograft
Orthotopic cell-line xenograft models involve implantation of human cancer cell lines into the anatomically corresponding organ of immunodeficient mice to reproduce tumor growth within a native microenvironment, enabling more clinically relevant tumor behavior compared with subcutaneous models. These models are widely used because orthotopic placement better recapitulates tumor progression, including invasion and metastatic spread, which are often underrepresented in heterotopic implantation systems. Compared with conventional xenografts, orthotopic implantation is described as more technically complex but provides improved simulation of tumor-microenvironment interactions and metastatic behavior, making it particularly valuable for translational oncology research. Surgical orthotopic implantation approaches have been emphasized as enabling faithful reproduction of clinical cancer features, including metastasis and disease progression patterns that align with the tumor’s organ of origi


Purity & Documentation
-
Data Sheet (295 KB)
-
SDS (476 KB)
- English - EN (476 KB)
- Français - FR (476 KB)
- Deutsch - DE (476 KB)
- Norwegian - NO (476 KB)
- Español - ES (476 KB)
- Swedish - SV (476 KB)
- Italian - IT (476 KB)
- Korean - KR (476 KB)
- Portuguese - PT (476 KB)
-
Handling Instructions (2659 KB)
References
[1]. Liang Y, et al. SESN2/sestrin 2 induction-mediated autophagy and inhibitory effect of isorhapontigenin (ISO) on human bladder cancers. Autophagy. 2016;12(8):1229-1239. [Content Brief]
[2]. Zha H, et al. Isorhapontigenin alleviates acetaminophen-induced liver injury by promoting fatty acid oxidation. Biochim Biophys Acta Mol Basis Dis. 2025;1871(2):167575. [Content Brief]
[3]. Yeo SCM, et al. Isorhapontigenin, a bioavailable dietary polyphenol, suppresses airway epithelial cell inflammation through a corticosteroid-independent mechanism. Br J Pharmacol. 2017;174(13):2043-2059. [Content Brief]
[4]. Yao P, et al. Isorhapontigenin alleviates lipopolysaccharide-induced acute lung injury via modulating Nrf2 signaling. Respir Physiol Neurobiol. 2021;289:103667. [Content Brief]
[5]. Chu XY, et al. Isorhapontigenin Improves Diabetes in Mice via Regulating the Activity and Stability of PPARγ in Adipocytes. J Agric Food Chem. 2020;68(13):3976-3985. [Content Brief]
[6]. Jiang G, et al. Isorhapontigenin (ISO) Inhibits Invasive Bladder Cancer Formation In Vivo and Human Bladder Cancer Invasion In Vitro by Targeting STAT1/FOXO1 Axis. Cancer Prev Res (Phila). 2016 Jul;9(7):567-80. [Content Brief]


Complete Stock Solution Preparation Table
Please refer to the solubility information to select the appropriate solvent. Once prepared, please aliquot and store the solution to prevent product inactivation from repeated freeze-thaw cycles.
Storage method and period of stock solution: -80°C, 6 months; -20°C, 1 month (sealed storage, away from moisture and light). When stored at -80°C, please use it within 6 months. When stored at -20°C, please use it within 1 month.
| Optional Solvent | Concentration Solvent Mass | 1 mg | 5 mg | 10 mg | 25 mg |
|---|---|---|---|---|---|
| DMSO | 1 mM | 3.8719 mL | 19.3596 mL | 38.7192 mL | 96.7979 mL |
| 5 mM | 0.7744 mL | 3.8719 mL | 7.7438 mL | 19.3596 mL | |
| 10 mM | 0.3872 mL | 1.9360 mL | 3.8719 mL | 9.6798 mL | |
| 15 mM | 0.2581 mL | 1.2906 mL | 2.5813 mL | 6.4532 mL | |
| 20 mM | 0.1936 mL | 0.9680 mL | 1.9360 mL | 4.8399 mL | |
| 25 mM | 0.1549 mL | 0.7744 mL | 1.5488 mL | 3.8719 mL | |
| 30 mM | 0.1291 mL | 0.6453 mL | 1.2906 mL | 3.2266 mL | |
| 40 mM | 0.0968 mL | 0.4840 mL | 0.9680 mL | 2.4199 mL | |
| 50 mM | 0.0774 mL | 0.3872 mL | 0.7744 mL | 1.9360 mL | |
| 60 mM | 0.0645 mL | 0.3227 mL | 0.6453 mL | 1.6133 mL | |
| 80 mM | 0.0484 mL | 0.2420 mL | 0.4840 mL | 1.2100 mL | |
| 100 mM | 0.0387 mL | 0.1936 mL | 0.3872 mL | 0.9680 mL |


Isorhapontigenin Related Classifications
HY-N2593 Related Classifications
 Powered by Bioz