



Dimethoxycurcumin

Based on 1 Customer Validation
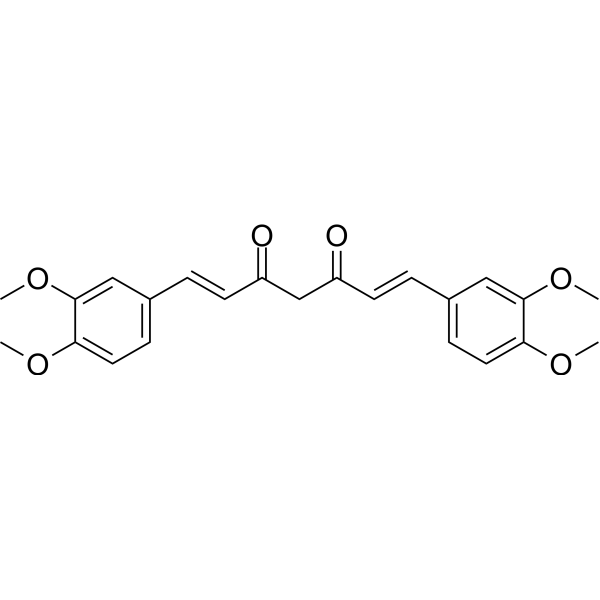
Dimethoxycurcumin (DiMC) is a curcuminoid compound found in Curcuma longa. Dimethoxycurcumin is also an orally active thioredoxin reductase inhibitor (IC50 = 5.4 μM) and androgen receptor antagonist. Dimethoxycurcumin inhibits thioredoxin reductase, leading to oxidized thioredoxin accumulation, ROS production, DNA damage, glutathione depletion, mitochondrial membrane potential decrease, ATP depletion, S phase arrest, and apoptosis. Dimethoxycurcumin inhibits NF-κB, NADPH oxidase subunits, ATP synthase subunits, CDK4, cyclin-D1, FASN, ACC, and the IRS2-PI3K-Akt pathway, while activating AMPK, ERK, and JNK. Dimethoxycurcumin can be used for research on cancer, arsenic-induced hepatotoxicity, and tuberculosis.
For research use only. We do not sell to patients.
- Purity : 98.48%
- CAS No.: 160096-59-3
- Formula: C23H24O6
- Molecular Weight:396.43
-
Storage:Powder -20°C, 3 years , 4°C, 2 years ; In solvent -80°C, 6 months , -20°C, 1 month

To place orders, for customer services and technical support, please contact: MedChemExpress USA
Tel: 609-228-6898 E-mail: [email protected] [email protected]


-
 Biological Activity
-
Chemical Information
-
Solvent & Solubility
- Protocols
- Purity & Documentation
- References
-
 Help & FAQs


-

HY-P2149
Concanavalin APlant Lectin -
HY-18731
1400W DihydrochlorideNO Synthase Inhibitor -
HY-12116
L-NILNO Synthase Inhibitor -
HY-102015
6-BiopterinNO Synthase Cofactor -

HY-102015R
6-Biopterin (Standard)NO Synthase Cofactor -

HY-P2149A
Concanavalin A (agarose)Protein Purification -
HY-B2130A
Uric acid sodiumOxygen Radical Scavenger -
HY-116807
Dihydrolipoic AcidAntioxidant -

HY-116807R
Dihydrolipoic Acid (Standard)Antioxidant -

HY-B2130AR
Uric acid sodium (Standard)Reference Standard -

HY-12294B
(Rac)-PEAQXNMDA Receptor Antagonist -
HY-N0577
ApiiniNOS Inhibitor
All AMPK Isoforms
More

Biological Activity
Description
|
thioredoxin reductase 5.4 μM (IC50) |
Androgen receptor |
NF-κB |
CDK4 |
cyclin-D1 |
FASN |
ACC |
IRS2 |
PI3K |
Akt |
AMPK |
ERK |
JNK |
Cellular Effect
|
Cell Line

|
Type | Value | Description | References |
|---|---|---|---|---|
| T47D | IC50 |
21.75 μM
|
Cytotoxicity against human breast cancer T-47D cells assessed as cell death incubated for 24 hrs by calcein-AM/EthD-1 viability assay.
Cytotoxicity against human breast cancer T-47D cells assessed as cell death incubated for 24 hrs by calcein-AM/EthD-1 viability assay.
|
24625971 |
| MCF7 | IC50 |
23.62 μM
|
Cytotoxicity against human breast cancer MCF-7 cells assessed as cell death incubated for 24 hrs by calcein-AM/EthD-1 viability assay.
Cytotoxicity against human breast cancer MCF-7 cells assessed as cell death incubated for 24 hrs by calcein-AM/EthD-1 viability assay.
|
24625971 |
| MDA-MB-435S | IC50 |
20.05 μM
|
Cytotoxicity against human breast cancer MDA-MB 435S cells assessed as cell death incubated for 24 hrs by calcein-AM/EthD-1 viability assay.
Cytotoxicity against human breast cancer MDA-MB 435S cells assessed as cell death incubated for 24 hrs by calcein-AM/EthD-1 viability assay.
|
24625971 |
| MDA-MB-231 | IC50 |
22.44 μM
|
Cytotoxicity against human breast cancer MDA-MB 231 cells assessed as cell death incubated for 24 hrs by calcein-AM/EthD-1 viability assay.
Cytotoxicity against human breast cancer MDA-MB 231 cells assessed as cell death incubated for 24 hrs by calcein-AM/EthD-1 viability assay.
|
24625971 |
| HPAF-II | IC50 |
11.03 μM
|
Inhibition of human HPAF-II pancreatic cancer cell viability assessed by crystal violet staining after 72 hrs of incubation.
Inhibition of human HPAF-II pancreatic cancer cell viability assessed by crystal violet staining after 72 hrs of incubation.
|
40427480 |
| BXPC-3 | IC50 |
12.90 μM
|
Inhibition of human BxPC-3 pancreatic cancer cell viability assessed by crystal violet staining after 72 hrs of incubation.
Inhibition of human BxPC-3 pancreatic cancer cell viability assessed by crystal violet staining after 72 hrs of incubation.
|
40427480 |
| CFPAC-1 | IC50 |
2.91 μM
|
Inhibition of human CFPAC-1 pancreatic cancer cell viability assessed by crystal violet staining after 72 hrs of incubation.
Inhibition of human CFPAC-1 pancreatic cancer cell viability assessed by crystal violet staining after 72 hrs of incubation.
|
40427480 |
| HCT-116 | GI50 |
3.3 μM
|
Antiproliferative activity against human HCT116 cells assessed as inhibition of cell proliferation incubated for 48 hrs by sulforhodamine B colorimetric assay.
Antiproliferative activity against human HCT116 cells assessed as inhibition of cell proliferation incubated for 48 hrs by sulforhodamine B colorimetric assay.
|
17317839 |
| HCT-116 | LC50 |
38.2 μM
|
Cytotoxicity against human HCT116 cells assessed as lethal concentration incubated for 48 hrs by sulforhodamine B colorimetric assay.
Cytotoxicity against human HCT116 cells assessed as lethal concentration incubated for 48 hrs by sulforhodamine B colorimetric assay.
|
17317839 |
| 786-0 | IC50 |
16 μM
|
Cytotoxicity against human renal adenocarcinoma 786-O cells assessed as reduction in cell viability incubated for 24 hrs by MTT assay.
Cytotoxicity against human renal adenocarcinoma 786-O cells assessed as reduction in cell viability incubated for 24 hrs by MTT assay.
|
33582110 |
In Vitro
Dimethoxycurcumin (DIMC) (5-15 μM) inhibits RAW264.7 cell proliferation and induces apoptosis[1].
Dimethoxycurcumin (5-50 μM; 8 h) simultaneously induces apoptosis and necrosis in MCF7 cells at 5 μM, whereas it primarily induces secondary apoptosis or necrosis at 25 and 50 μM[2].
Dimethoxycurcumin (2.5 μM; 2 h) in combination with 4 Gy or 8 Gy radiation synergistically enhances radiation-induced apoptosis and mitotic catastrophe in A549 cells[6].
Dimethoxycurcumin (5 μM; 48 h) induces a large apoptotic cell population (approximately 65%) in HCT116 cells after 48 h[10].
Dimethoxycurcumin (10-50 μM; 3 h) is genotoxic to 786-O cells and induces DNA damage at concentrations of 10 μM and above[11].
Dimethoxycurcumin (10-50 μM; 24 h) induces monopolar spindle formation and apoptosis in 786-O cells at concentrations of 10 μM and above[11].
Dimethoxycurcumin (10-50 μM; 24 h) induces apoptosis in 786-O cells, with a significant increase in annexin-V-positive cells at 10 μM[11].
Dimethoxycurcumin (24 h) activates caspase 3/7 and caspase 9 in 786-O cells[11].
Dimethoxycurcumin (12 h) regulates the expression of genes involved in DNA repair, apoptosis, proliferation, and xenobiotic metabolism in 786-O cells[11].
Dimethoxycurcumin (DIMC) (5-50 μM; 24 h) induces selective cytotoxicity in MCF7 cells, with weaker effects on mouse splenic lymphocytes[2].
Dimethoxycurcumin (50 μM) combined with NAC (Acetylcysteine) (HY-B0215) (0.25-0.75 mM) inhibits Dimc-induced cytotoxicity in MCF7 cells in a concentration-dependent manner[2].
Dimethoxycurcumin (5-50 μM; 2 h) induces dose-dependent DNA damage in MCF7 cells, manifested as an increase in tail moment in the comet assay[2].
Dimethoxycurcumin (25-50 μM; 2-6 h) induces a significant decrease in the GSH/GSSG ratio at 2 h in MCF7 cells, followed by recovery at 6 h[2].
Dimethoxycurcumin (25-50 μM; 2-6 h) causes a sustained decrease in ATP levels in MCF7 cells, whereas at 5 μM it induces a transient decrease followed by recovery[2].
Dimethoxycurcumin (5-50 μM; 6 h) exhibits differential modulation of ATP synthase subunit gene expression in MCF7 cells, with 50 μM causing significant inhibition of all four subunits[2].
Dimethoxycurcumin (DIMC) (2.5-5 μM; 2 h) sensitizes A549, PC-3, and MCF-7 cancer cells to radiation-induced loss of clonogenic capacity, with the maximum effect observed at 2.5 μM DIMC and 4 Gy radiation, resulting in a surviving fraction of 0.03[6].
Dimethoxycurcumin (2.5 μM; 48 h) combined with 4 Gy radiation effectively eliminates cancer stem cells in A549 cells, reducing their abundance to 0.50%[6].
Treatment with Dimethoxycurcumin (2.5 μM; 15-180 min) followed by 4 Gy radiation significantly delays DNA repair in A549 cells, as evidenced by persistent γ-H2AX and 53BP1 foci at 180 min[6].
Dimethoxycurcumin (DMC) (5-30 μM; 24 h) exhibits potent anticancer effects against T-47D, MCF-7, MDA-MB 435S, and MDA-MB 231 breast cancer cells, with IC50 values of 21.75, 23.62, 20.05, and 22.44 μM, respectively[8].
Dimethoxycurcumin (10-30 μM; 12 h) effectively inhibits the long-term survival and clonogenic capacity of MDA-MB 435S cells at a concentration of 10 μM[8].
Dimethoxycurcumin (20 μM; 12 h) induces pronounced cellular vacuolization in MDA-MB 435S, MDA-MB 231, MCF-7, and T-47D breast cancer cells[8].
Dimethoxycurcumin (20 μM; 4-24 h) upregulates LC3-I and LC3-II protein levels in MDA-MB 435S and MDA-MB 231 cells, but does not affect ATG5 and ATG6 levels[8].
Dimethoxycurcumin (5-20 μM; 16 h) induces cell vacuolation in MDA-MB 435S cells at concentrations of 5, 10, and 20 μM[8].
Dimethoxycurcumin (20 μM; 0-24 h) downregulates Alix and activates the ERK and JNK pathways in MDA-MB 435S cells[8].
Dimethoxycurcumin (20 μM; 0-24 h) progressively increases the accumulation of ubiquitinated proteins in MDA-MB 435S cells[8].
Dimethoxycurcumin (10-30 μM; 6-24 h) inhibits cellular proteasome activity (chymotrypsin-like, trypsin-like, and PGPH-like) in MDA-MB 435S cells[8].
Dimethoxycurcumin (10-30 μM; 4-24 h) upregulates CHOP, ATF4, Noxa, and Bim protein levels in MDA-MB 435S cells[8].
Dimethoxycurcumin (compound 3) (1 nM-50 μM; 72 h) inhibits the viability of HPAF-II, BxPC-3, and CFPAC-1 pancreatic cancer cell lines with IC50 values in the low micromolar range[9].
Dimethoxycurcumin (10 µM) exhibits potent inhibitory effects on the viability of HPAF-II and BxPC-3 cells[9].
Dimethoxycurcumin (10 µM; 12 days) completely inhibits the clonogenic ability of BxPC-3 pancreatic cancer cells[9].
Dimethoxycurcumin (0.01-100 μM; 48 h) effectively inhibits the proliferation of HCT116 human colon cancer cells and induces cytotoxicity, with a GI50 of 3.3 μM and an LC50 of 38.2 μM after 48 h[10].
Dimethoxycurcumin (5-50 μM; 48 h) significantly reduces the adherent density of HCT116 cells after 48 h, with no adherent cells remaining at 30 μM[10].
Dimethoxycurcumin (DiMC) (2.5-50 μM; 24 h) is cytotoxic to 786-O cells with an IC50 of 16 μM[11].
Dimethoxycurcumin (2.5-50 μM; 48 h) inhibits 786-O cell proliferation in a dose-dependent manner, with a significant effect observed at 10 μM[11].
Dimethoxycurcumin (5-50 μM; 2 h) exerts a biphasic effect on ROS generation and specifically increases superoxide anion radical production in MCF7 cells[2].
Dimethoxycurcumin (10-50 nmoles/mL) shows concentration-dependent cellular uptake in MCF7 cells and is inhibited by exogenous GSH, which simultaneously reduces ROS generation[2].
Dimethoxycurcumin (DIMC) (2.5 µM) increases ROS levels and slows DNA repair by inhibiting thioredoxin reductase, thereby exerting a radiosensitizing effect on A549 cells[5].
Dimethoxycurcumin (2.5 μM; 24 h) inhibits thioredoxin reductase in a cell-free system with an IC50 of 5.4 μM, and when combined with 4 Gy radiation, it significantly inhibits TrxR activity in A549 cells, whereas thioredoxin overexpression abolishes this radiosensitizing effect[6].
Dimethoxycurcumin (5-50 μM; 6 h) induces a concentration-dependent decrease in mitochondrial membrane potential in MCF7 cells[2].
Dimethoxycurcumin (20 μM; 8-24 h) induces progressive dilation of mitochondria and the ER in MDA-MB 435S cells, with the average width of ER-derived vacuoles reaching 4.93 μm at 24 h[8].
Dimethoxycurcumin (20 μM; 12-24 h) induces severe ultrastructural changes in MDA-MB 435S cells, including mitochondrial swelling, megamitochondria formation, and extensive endoplasmic reticulum dilation[8].
Dimethoxycurcumin (5-50 μM; 16 h) induces S phase cell cycle arrest and cell death in MCF7 cells[2].
Dimethoxycurcumin (5-50 μM; 16 h) modulates the expression of cell cycle regulatory proteins (p53, p21, CDK4, cyclin-D1) and apoptotic markers (Bax, Bcl-2, Cyt c) in MCF7 cells, promoting apoptosis[2].
Dimethoxycurcumin (DIMC) (10 mM GSH; 1 h) directly interacts with GSH in vitro[4].
Dimethoxycurcumin (1 h) reduces basal reactive oxygen species levels in lymphocytes[4].
Dimethoxycurcumin (4 h) depletes GSH levels in lymphocytes[4].
Dimethoxycurcumin (1-10 μM; 4 h) inhibits PHA-induced IL-2 secretion in Jurkat cells[4].
Dimethoxycurcumin (2.5-10 μM; 15 min-48 h) combined with 4 Gy radiation significantly increases cytosolic and mitochondrial ROS and decreases the GSH/GSSG ratio in A549 cells at 48 h[6].
MedChemExpress (MCE) has not independently confirmed the accuracy of these methods. They are for reference only. Further protocols information, click here.
-
Cell Line:MCF7 cells and murine spleen lymphocytes
-
Concentration:5 μM, 25 μM, 50 μM
-
Incubation Time:24 h
-
Result:Induced cytotoxicity in MCF7 cells that increased with increasing concentration from 5 to 50 μM.
Induced concentration-dependent cytotoxicity to murine spleen lymphocytes, but the level of toxicity was much less (nearly half) than that in MCF7 cells.
-
Cell Line:MCF7 cells
-
Concentration:5 μM, 25 μM, 50 μM
-
Incubation Time:2 h
-
Result:Reduced the generation of ROS at 5 μM.
Significantly increased ROS generation at 25 and 50 μM.
Increased ethidium fluorescence in a dose-dependent manner.
Increased ethidium fluorescence much higher than DCF at all concentrations.
-
Cell Line:MCF7 cells
-
Concentration:5 μM, 25 μM, 50 μM
-
Incubation Time:2 and 6 h
-
Result:Did not cause any noticeable change in GSH/GSSG ratio at 5 μM.
Showed a significant decrease at 2 h followed by slow recovery at 6 h at 25 and 50 μM.
-
Cell Line:MCF7 cells
-
Concentration:5 μM, 25 μM, 50 μM
-
Incubation Time:6 h
-
Result:Shifted JC-1 fluorescence from red-orange to green in a concentration-dependent manner.
-
Cell Line:MCF7 cells
-
Concentration:5 μM, 25 μM, 50 μM
-
Incubation Time:6 h
-
Result:Suppressed α subunit at all concentrations with maximum effect at 25 μM.
Up-regulated β and ε subunits dose-dependently up to 25 μM, but suppressed at 50 μM.
Showed marginal up-regulation of γ subunit at 5 μM, but marginal and significant suppression at 25 and 50 μM, respectively.
-
Cell Line:MCF7 cells
-
Concentration:5 μM, 25 μM, 50 μM
-
Incubation Time:16 h
-
Result:Induced both cell death (Sub G0) and S-phase cell cycle arrest at all concentrations.
-
Cell Line:MCF7 cells
-
Concentration:5 μM, 25 μM, 50 μM
-
Incubation Time:8 h
-
Result:Induced apoptotic (11.58%) and secondary apoptotic or necrotic (11.99%) cell death at 5 μM.
Mainly induced secondary apoptotic or necrotic cell deaths (14.14 and 15.71%, respectively) at 25 and 50 μM.
-
Cell Line:MCF7 cells
-
Concentration:5 μM, 25 μM, 50 μM
-
Incubation Time:16 h
-
Result:Enhanced expression of p53 and p21 in a concentration-dependent manner with maximum effect at 50 μM.
Suppressed expression of CDK4 and cyclin-D1 at all concentrations.
Increased Bax protein expression and decreased Bcl-2, resulting in an increase in the Bax/Bcl-2 ratio.
Released mitochondrial protein Cyt c in the cytoplasm.
-
Cell Line:Jurkat cells
-
Concentration:1 μM, 2.5 μM, 5 μM, 10 μM
-
Incubation Time:4 h
-
Result:Inhibited PHA-induced IL-2 secretion by Jurkat cells.
-
Cell Line:T-47D, MCF-7, MDA-MB 435S, MDA-MB 231
-
Concentration:5 μM, 10 μM, 20 μM, 30 μM
-
Incubation Time:24 h
-
Result:Induced cell death with IC50 values of 21.75 μM for T-47D, 23.62 μM for MCF-7, 20.05 μM for MDA-MB 435S, and 22.44 μM for MDA-MB 231.
-
Cell Line:MDA-MB 435S
-
Concentration:10, 20, 30 μM; 10 μM
-
Incubation Time:12 h; 6, 12, 24 h
-
Result:Completely blocked clonogenicity at 10 μM for 12 h.
Required a much shorter incubation time to inhibit clonogenicity compared to curcumin.
-
Cell Line:MDA-MB 435S, MDA-MB 231
-
Concentration:20 μM
-
Incubation Time:4, 8, 12, 16, 24 h
-
Result:Upregulated both LC3-I and LC3-II forms.
Did not upregulate ATG5 and ATG6.
-
Cell Line:MDA-MB 435S (YFP-Mito, YFP-ER sublines)
-
Concentration:20 μM
-
Incubation Time:8, 16, 24 h
-
Result:At 16 h, noted dilation of mitochondria around nuclei and small ER-derived vacuoles at cellular periphery.
Vacuoles progressively enlarged.
Average width of mitochondria-derived vacuoles was 1.42 μm and ER-derived vacuoles was 4.93 μm at 24 h.
-
Cell Line:MDA-MB 435S
-
Concentration:20 μM
-
Incubation Time:4, 8, 12, 16, 24 h
-
Result:Reduced protein levels of Alix.
Markedly increased activities of ERK and JNK.\nProgressively increased accumulation of protein-ubiquitin conjugates.
-
Cell Line:MDA-MB 435S
-
Concentration:20 μM; 10, 20, 30 μM
-
Incubation Time:4, 8, 12, 16, 24 h; 24 h
-
Result:Markedly increased ATF4 and CHOP protein levels after 4 h.
Progressively increased Bim and Noxa levels.
Markedly increased CHOP, ATF4, and Noxa at much lower doses compared with curcumin.
-
Cell Line:MDA-MB 435S
-
Concentration:20 μM
-
Incubation Time:24 h
-
Result:siRNA-mediated suppression of CHOP, but not Noxa, significantly inhibited DMC-induced cell death.
-
Cell Line:MDA-MB 435S (YFP-ER, YFP-Mito sublines)
-
Concentration:20 μM
-
Incubation Time:16 h
-
Result:siRNA-mediated knockdown of CHOP markedly inhibited DMC-induced ER dilation compared with mitochondrial dilation.
In cells infected with CHOP-targeting shRNA, cellular vacuolation was markedly attenuated.
PDI expression patterns similar to untreated cells, although COX IV-expressing mitochondria appeared somewhat dilated.
-
Cell Line:HPAF-II, BxPC-3, and CFPAC-1
-
Concentration:1 nM to 50 μM
-
Incubation Time:72 h
-
Result:Inhibited growth with IC50 values of 11.03 µM for HPAF-II, 12.90 µM for BxPC-3, and 2.91 µM for CFPAC-1.
-
Cell Line:HCT116
-
Concentration:5 μM
-
Incubation Time:48 h
-
Result:Induced a large apoptotic fraction accounting for approximately 65% of the total cell population.
Resulted in concomitant decreases in G1, S, and G2 fractions.
-
Cell Line:786-O
-
Concentration:2.5 μM, 5 μM, 10 μM, 25 μM, 50 μM
-
Incubation Time:24 h
-
Result:Exerted a dose-dependent cytotoxic effect.
Observed a significant potent cytotoxic effect at 5 μM with 78% viability.
Calculated an IC50 of 16 μM.
-
Cell Line:786-O
-
Concentration:2.5 μM, 5 μM, 10 μM, 25 μM, 50 μM
-
Incubation Time:48 h
-
Result:Decreased the cell index (CI) in a dose-dependent manner.
Observed a significant proliferation delay at 10 μM.
Induced a decrease in CI at around 24 h, but levels returned to baseline at the end of the experimental procedure.
Led to a significant reduction in CI from the beginning of the treatment at ≥25 μM.
-
Cell Line:786-O
-
Concentration:10 μM, 25 μM, 50 μM
-
Incubation Time:24 h
-
Result:Induced a significant increase in the number of monopolar spindle cells at 10 μM (17%).
Induced a significant increase in the number of cells with apoptotic morphology at ≥25 μM (≥24%).
-
Cell Line:786-O
-
Concentration:10 μM 25 μM, 50 μM
-
Incubation Time:24 h
-
Result:Observed a significant increase in the number of annexin-V-positive cells at 10 μM (31%).
In Vivo
DMC (25-50 mg/kg; i.p.; every 2 days; 25 days) demonstrates more potent in vivo anticancer effects than curcumin, with 25 mg/kg DMC exceeding the tumor-reducing effect of 50 mg/kg curcumin, and this is associated with enhanced proteasome inhibition and CHOP upregulation in tumors[8].
MedChemExpress (MCE) has not independently confirmed the accuracy of these methods. They are for reference only.
-
Animal Model:Wistar (Male, 170-190 g)[1]
-
Dosage:20 mg/kg BW/day; 40 mg/kg BW/day; 80 mg/kg BW/day
-
Administration:p.o.; daily; 4 weeks
-
Result:Lowered serum transaminases (AST, ALT, ALP, LDH, GGT) and total bilirubin compared to arsenic-treated rats.
Lowered hepatic ROS (17.36 pmol/mg protein vs 21.24 in arsenic group), TBARS (3.01 nmol/100 g wet tissue vs 5.08), LOOH (1.77 nmol/100 g wet tissue vs 2.99), CD (56.02 nmol/100 g wet tissue vs 72.24), and PC (5.58 nmol/mg protein vs 7.88).
Restored non-enzymatic antioxidants: GSH (40.88 μg/mg protein vs 27.28 in arsenic group), TSH (18.02 μg/mg protein vs 14.54), Vitamin C (3.43 μmol/mg tissue vs 2.92), and Vitamin E (0.42 μmol/mg tissue vs 0.32).
Increased enzymatic antioxidants: SOD (11.12 min/mg protein vs 9.08 in arsenic group), CAT (82.44 min/mg protein vs 72.23), GPx (7.92 min/mg protein vs 5.75), GST (0.68 min/mg protein vs 0.41), GR (0.39 μg/mg protein vs 0.26), and G6PD (3.88 μg/mg protein vs 2.24).
Decreased liver NO levels and serum pro-inflammatory cytokines IL-6 and TNF-α compared to arsenic-treated rats.
Reduced iNOS (4.52% vs 18.21% in arsenic group), NF-kB (3.14% vs 15.64%), and caspase-3 (3.51% vs 11.03%) immunoreactivity.
Inhibited arsenic-induced elevation of NADPH oxidase subunits Nox2, Nox4, and p47phox protein and mRNA expression.
Normalized mRNA and protein expression of Nrf2, Keap1, HO-1, γ-GCL, and SOD.
Up-regulated anti-apoptotic Bcl-2 and down-regulated pro-apoptotic Bax, Bad, and Caspase-3 proteins.
Reduced histopathological scores for fatty degeneration (++ vs ++++), inflammation (+ vs ++++), binucleated cells (+ vs +++), necrosis (+ vs +++), and vacuolization (+ vs +++) compared to arsenic alone.
Significantly reduced ultrastructural changes (broken nuclear membrane, mitochondrial cristae abolition, vacuolization).
Improved food intake (18.12 g/100 g bw/day) and water intake (15.92 mL/rat/day) compared to arsenic-treated rats (15.54 and 12.08, respectively).
Body weight gain was 15.44% compared to 7.23% in arsenic group.
Organ-body weight ratio (liver) was 3.57% compared to 4.87% in arsenic group.
-
Animal Model:Balb/c nu/nu (female, 6-8 weeks old, athymic nude, MDA-MB 435S cell tumor xenograft)[8]
-
Dosage:25 mg/kg; 50 mg/kg
-
Administration:i.p.; every 2 days; 25 days
-
Result:Dose-dependently reduced tumor sizes.
Induced severe cellular vacuolation in MDA-MB 435S xenografts at 25 mg/kg.


Chemical Information
-
CAS No. 160096-59-3
-
Appearance Solid
-
Molecular Weight 396.43
-
Formula C23H24O6
-
Color Yellow to orange
-
SMILES
O=C(CC(/C=C/C1=CC=C(OC)C(OC)=C1)=O)/C=C/C2=CC=C(OC)C(OC)=C2
-
Synonyms
DiMC; CHC 004; Di-O-methylcurcumin
-
Shipping
Room temperature in continental US; may vary elsewhere.
-
Storage
Powder -20°C 3 years 4°C 2 years In solvent -80°C 6 months -20°C 1 month


Solvent & Solubility
In Vitro:
DMSO : 100 mg/mL (252.25 mM; ultrasonic and warming and heat to 60°C; Hygroscopic DMSO has a significant impact on the solubility of product, please use newly opened DMSO)
Please refer to the solubility information to select the appropriate solvent. Once prepared, please aliquot and store the solution to prevent product inactivation from repeated freeze-thaw cycles.
Storage method and period of stock solution: -80°C, 6 months; -20°C, 1 month. When stored at -80°C, please use it within 6 months. When stored at -20°C, please use it within 1 month.
Please refer to the solubility information to select the appropriate solvent. Once prepared, please aliquot and store the solution to prevent product inactivation from repeated freeze-thaw cycles.
Storage method and period of stock solution: -80°C, 6 months; -20°C, 1 month. When stored at -80°C, please use it within 6 months. When stored at -20°C, please use it within 1 month.
Concentration (start) × Volume (start) = Concentration (final) × Volume (final)

Protocols
-
Mitochondrial membrane-potential fluorescent assay
Mitochondrial membrane potential fluorescent assays estimate ΔΨm in living cells using lipophilic cationic dyes such as TMRM, TMRE, rhodamine 123, and JC-1, which accumulate in mitochondria according to membrane polarization; loss of signal after FCCP or CCCP treatment is interpreted as mitochondrial depolarization. TMRM/TMRE and rhodamine 123 are commonly used for semi-quantitative live-cell microscopy or flow cytometry, while JC-1 can report a shift from red aggregate fluorescence to green monomer fluorescence during depolarization; interpretation requires controls because dye concentration, quenching mode, cell type, dye efflux, and mitochondrial mass can affect fluorescence independently of ΔΨm.
-
Annexin V plus membrane-impermeant dye apoptosis staining
Annexin V-based apoptosis assays rely on the detection of phosphatidylserine (PS) externalization from the inner leaflet of the plasma membrane to the outer leaflet, an early biochemical hallmark of apoptosis. Fluorescently labeled Annexin V binds PS in a calcium-dependent manner, enabling identification of early apoptotic cells by flow cytometry or fluorescence microscopy. When combined with a membrane-impermeant DNA-binding dye (e. g. , propidium iodide), this approach allows discrimination between viable (Annexin V−/dye−), early apoptotic (Annexin V+/dye−), and late apoptotic or necrotic (Annexin V+/dye+) cell populations by assessing membrane integrity and PS exposure.
-
ROS/oxidative-stress fluorescent staining
ROS/oxidative-stress fluorescent staining uses cell-permeant fluorogenic probes that become fluorescent after oxidation inside cells or tissues; commonly used examples include DCFH-DA/DCFDA for broad cellular oxidant detection, DHE for superoxide-related signal detection, MitoSOX for mitochondrial superoxide-related signal detection, and CellROX probes for oxidative-stress-associated fluorescence readouts. The assay detects probe oxidation rather than a single ROS species unless the probe and analysis method have been chemically validated for that species. DCFH-DA enters cells, is deacetylated by intracellular esterases to DCFH, and produces fluorescent DCF after oxidation, so the readout is used as an operational measure of total cellular oxidative stress rather than a species-specific ROS measurement. DHE and MitoSOX can report superoxide-related oxidation, but red fluorescence alone can include non-specific ethidium-like oxidation products; HPLC or optimized spectral approaches are
-
BrdU Incorporation Assay
Bromodeoxyuridine (BrdU) incorporation assay is based on the principle that BrdU, a thymidine analog, is incorporated into newly synthesized DNA during the S phase of the cell cycle, thereby serving as a marker of DNA replication and cellular proliferation. Incorporated BrdU can be detected using anti-BrdU antibodies following DNA denaturation, enabling visualization or quantification of proliferating cells through immunochemical detection methods such as immunofluorescence or immunohistochemistry.
-
Protocol for Cell Cycle
Cell-cycle analysis by flow cytometry measures DNA content in single cells to estimate the fraction of cells in G0/G1, S, and G2/M phases. Propidium iodide intercalates into DNA, and after RNA removal with RNase, fluorescence intensity reflects cellular DNA content: 2N cells are assigned to G0/G1, cells between 2N and 4N to S phase, and 4N cells to G2/M. DNA-content analysis alone cannot reliably separate G0 from G1 or G2 from M. Ki-67 can distinguish quiescent G0 cells from cycling cells, EdU or BrdU incorporation marks active DNA synthesis in S phase, and phospho-histone H3 staining identifies mitotic cells within the 4N population.
-
Research Protocol for Inflammation-related Diseases
The NLRP3 inflammasome is a cytosolic innate immune signaling platform that integrates priming signals and danger-signal activation to promote caspase-1 activation, maturation of IL-1β and IL-18, and gasdermin D-mediated pyroptotic cell death. The core experimental logic is to determine whether inflammatory disease phenotypes are driven by increased NLRP3 expression, ASC-containing inflammasome assembly, caspase-1 cleavage, GSDMD cleavage, and extracellular release of IL-1β/IL-18 rather than by nonspecific cell injury alone. The pathway is strongly linked to inflammation-related disease phenotypes because monosodium urate crystals activate NALP3/NLRP3 inflammasome signaling in gout-like crystal inflammation, cholesterol crystals activate NLRP3 inflammasomes in atherogenesis models, and DSS-induced intestinal inflammation has been reported to involve NLRP3 inflammasome activity. However, experimental colitis studies also show context-dependent protective effects of NLRP3 inflammasome co
-
EdU Incorporation Assay (Click Chemistry-Based DNA Synthesis Measurement)
The EdU incorporation assay measures DNA synthesis by adding the thymidine analog 5-ethynyl-2′-deoxyuridine to cells or tissues, where it is incorporated into newly synthesized DNA during S phase. Incorporated EdU is detected by copper-catalyzed azide-alkyne cycloaddition, in which a fluorescent azide covalently reacts with the ethynyl group on EdU, allowing S-phase cells to be detected by fluorescence microscopy, flow cytometry, or high-content imaging. EdU detection does not require DNA denaturation or anti-BrdU antibody access, which preserves sample structure and improves compatibility with immunostaining and multiparameter cytometry compared with BrdU-based detection. EdU can be cytotoxic in a cell-type- and exposure-dependent manner, so pulse duration, concentration, and continuous-labeling designs should be validated for each cell type.
-
Apoptosis
Apoptosis, also called programmed cell death, is generally characterized by distinct morphological characteristics.
-
TUNEL staining for apoptotic DNA fragmentation
TUNEL staining detects DNA strand breaks by using terminal deoxynucleotidyl transferase to add labeled nucleotides to exposed 3′-OH DNA termini, generating either microscopic staining in fixed cells or tissue sections, or fluorescence/cytometric signal in cell suspensions. TUNEL positivity reflects DNA fragmentation but should not be interpreted alone as definitive apoptosis, because TUNEL can also label necrotic, autolytic, mechanically damaged, or DNA-repair-associated DNA breaks.
-
Cell Cytotoxicity Assay
Cytotoxicity assays are usually based on the assessment of cell membrane damage, which can also be indirectly detected by measuring cell viability. Detection methods include MTT assay, CKK-8 assay, LDH assay and ATP assay, etc.
-
Flow cytometric DNA-content cell-cycle staining
Flow cytometric DNA-content cell-cycle staining measures the fluorescence intensity of DNA-bound fluorochromes in single cells or nuclei to estimate DNA content distributions, allowing assignment of populations to G0/G1, S, and G2/M phases by DNA histogram deconvolution. Propidium iodide (PI) intercalates into DNA, and PI fluorescence is proportional to cellular DNA content when staining is performed under conditions that make DNA accessible and minimize non-DNA signal. Cells with G2/M DNA content are expected to show approximately twice the fluorescence intensity of G0/G1 cells, while S-phase cells occupy intermediate fluorescence values. PI-based DNA-content analysis can also detect cells with fractional DNA content, often reported as sub-G1, when DNA fragmentation and extraction during staining reduce retained DNA signal in apoptotic cells. DAPI is an alternative DNA fluorochrome for univariate DNA-content analysis, while bivariate approaches combining DNA content with proliferation
-
Research Protocol for Endocrine Diseases
Endocrine diseases often arise from disrupted hormone production, hormone signaling, or target-tissue responsiveness; for diabetes-focused endocrine disease models, insulin signaling regulates glucose uptake, hepatic glucose output, lipid metabolism, and β-cell compensation. Type 2 diabetes develops through interacting defects in insulin resistance, β-cell dysfunction, adipose inflammation, hepatic glucose overproduction, altered incretin signaling, and ectopic lipid metabolism. A major unresolved question is whether endocrine dysfunction is driven primarily by target-tissue insulin resistance, intrinsic β-cell failure, immune/inflammatory stress, or combined multi-organ failure that differs by disease stage.
-
Fluorescent plasma-membrane potential dye assay
Fluorescent plasma-membrane potential dye assays measure changes in cell membrane potential using voltage-sensitive dyes whose fluorescence changes when cells depolarize or hyperpolarize. Anionic bis-oxonol dyes such as DiBAC4(3) enter depolarized cells more readily and show increased fluorescence after intracellular binding, while hyperpolarization reduces dye accumulation and fluorescence. FMP/FLIPR membrane-potential dyes are used for faster, homogeneous microplate assays of ion-channel or receptor-mediated membrane-potential changes.
-
Mitochondrial membrane-potential and mitochondrial mass staining
Mitochondrial membrane potential staining measures the electrochemical polarization across the mitochondrial inner membrane in live cells using lipophilic cationic fluorescent probes; early rhodamine-based work showed that selective mitochondrial dye accumulation is lost when the mitochondrial transmembrane potential is dissipated. JC-1 reports mitochondrial polarization by shifting from green monomer fluorescence to red J-aggregate fluorescence as dye concentration increases within energized mitochondria; therefore, the red/green fluorescence ratio is used as a relative readout of mitochondrial membrane potential. TMRE or TMRM staining provides a single-channel relative readout because these cationic rhodamine esters accumulate in polarized mitochondria, and lower fluorescence indicates reduced mitochondrial polarization when acquisition and dye-loading conditions are controlled. Mitochondrial mass staining is commonly performed with MitoTracker Green FM or related MitoTracker dyes as
-
Apoptosis Solutions
Apoptosis is a regulated, generally non-lytic cell-death pathway that removes unwanted, damaged, infected, or abnormal cells through coordinated morphological changes, caspase activation, DNA fragmentation, and membrane remodeling. The intrinsic apoptosis pathway is controlled mainly by mitochondrial outer membrane permeabilization, BCL-2 family proteins, cytochrome c release, apoptosome formation, caspase-9 activation, and downstream executioner caspase-3/7 activation. The extrinsic apoptosis pathway is initiated by death receptors such as Fas, TNFR, and TRAIL receptors, which recruit adaptor proteins and activate caspase-8 before engaging executioner caspases or mitochondrial amplification through BID cleavage. Apoptosis is linked to many phenotypes, including cancer cell killing, tissue homeostasis, immune regulation, neurodegeneration, infection response, and treatment-induced cytotoxicity; unresolved questions include how apoptosis interacts with necroptosis, pyroptosis, ferroptos
-
Hepatotoxicity Study
This protocol evaluates hepatotoxicity using complementary in vivo mouse APAP acute liver injury and in vitro hepatocyte-based cytotoxicity readouts. In vivo APAP injury is assessed by serum ALT/AST, liver histology, hepatic glutathione, protein adducts, necrosis, inflammation, and regeneration-related endpoints. In vitro hepatotoxicity is assessed by loss of viability, leakage of ALT/AST/LDH, oxidative-stress markers, mitochondrial function, nuclear morphology, intracellular calcium, and high-content imaging endpoints.
-
Genotoxicity/Mutagenicity Study
The bacterial reverse mutation assay detects point mutations that restore amino-acid prototrophy in auxotrophic Salmonella typhimurium or Escherichia coli tester strains; after exposure to a test article, mutagenic activity is read out as an increased number of revertant colonies on minimal agar compared with the vehicle control. The assay uses tester strains with different mutation targets so that base-substitution and frameshift mutagens can be detected, and testing is performed with and without exogenous mammalian metabolic activation because some chemicals require biotransformation to become mutagenic.


Purity & Documentation
-
Data Sheet (318 KB)
-
SDS (396 KB)
- English - EN (396 KB)
- Français - FR (396 KB)
- Deutsch - DE (396 KB)
- Norwegian - NO (396 KB)
- Español - ES (396 KB)
- Swedish - SV (396 KB)
- Italian - IT (396 KB)
- Korean - KR (396 KB)
- Portuguese - PT (396 KB)
-
Handling Instructions (2659 KB)
References
[4]. Patwardhan RS, et al. Dimethoxycurcumin, a metabolically stable analogue of curcumin, exhibits anti-inflammatory activities in murine and human lymphocytes. Biochemical pharmacology. 2011 Sep 15;82(6):642-57. [Content Brief]
[8]. Yoon MJ, et al. Stronger proteasomal inhibition and higher CHOP induction are responsible for more effective induction of paraptosis by dimethoxycurcumin than curcumin. Cell death & disease. 2014 Mar 13;5(3):e1112. [Content Brief]


Complete Stock Solution Preparation Table
Please refer to the solubility information to select the appropriate solvent. Once prepared, please aliquot and store the solution to prevent product inactivation from repeated freeze-thaw cycles.
Storage method and period of stock solution: -80°C, 6 months; -20°C, 1 month. When stored at -80°C, please use it within 6 months. When stored at -20°C, please use it within 1 month.
| Optional Solvent | Concentration Solvent Mass | 1 mg | 5 mg | 10 mg | 25 mg |
|---|---|---|---|---|---|
| DMSO | 1 mM | 2.5225 mL | 12.6126 mL | 25.2251 mL | 63.0628 mL |
| 5 mM | 0.5045 mL | 2.5225 mL | 5.0450 mL | 12.6126 mL | |
| 10 mM | 0.2523 mL | 1.2613 mL | 2.5225 mL | 6.3063 mL | |
| 15 mM | 0.1682 mL | 0.8408 mL | 1.6817 mL | 4.2042 mL | |
| 20 mM | 0.1261 mL | 0.6306 mL | 1.2613 mL | 3.1531 mL | |
| 25 mM | 0.1009 mL | 0.5045 mL | 1.0090 mL | 2.5225 mL | |
| 30 mM | 0.0841 mL | 0.4204 mL | 0.8408 mL | 2.1021 mL | |
| 40 mM | 0.0631 mL | 0.3153 mL | 0.6306 mL | 1.5766 mL | |
| 50 mM | 0.0505 mL | 0.2523 mL | 0.5045 mL | 1.2613 mL | |
| 60 mM | 0.0420 mL | 0.2102 mL | 0.4204 mL | 1.0510 mL | |
| 80 mM | 0.0315 mL | 0.1577 mL | 0.3153 mL | 0.7883 mL | |
| 100 mM | 0.0252 mL | 0.1261 mL | 0.2523 mL | 0.6306 mL |


Dimethoxycurcumin Related Classifications
HY-100977 Related Classifications
 Powered by Bioz
Keywords
- Dimethoxycurcumin
- 160096-59-3
- DiMC
- CHC 004
- Di-O-methylcurcumin
- CHC004
- CHC 004
- CHC-004
- Androgen Receptor
- Reactive Oxygen Species (ROS)
- Apoptosis
- NF-κB
- CDK
- Fatty Acid Synthase (FASN)
- Acetyl-CoA Carboxylase
- PI3K
- Akt
- AMPK
- ERK
- JNK
- HCT116
- androgen receptor
- 786-O
- Curcuma longa
- Mycobacterium tuberculosis H37Ra
- A549
- RAW264.7
- thioredoxin reductase
- MCF7
- MDA-MB 435S
- Inhibitor
- inhibitor
- inhibit