



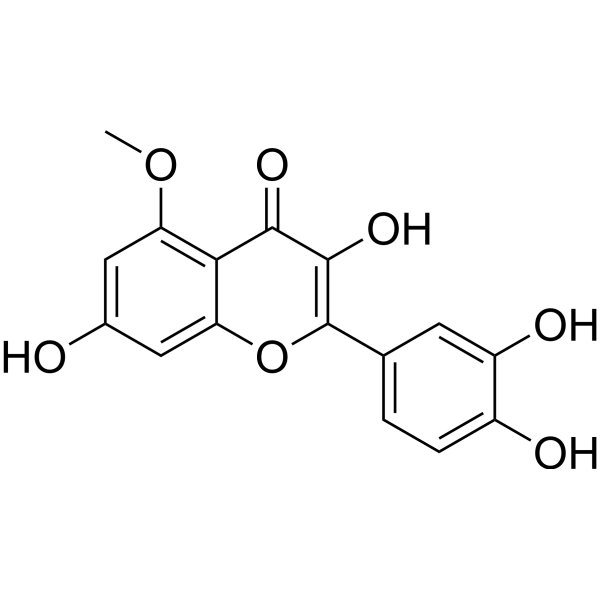
Azaleatin

Based on 1 Customer Validation
Azaleatin is an orally active inhibitor of hQC, NS2B-NS3 protease and E. coli β-glucuronidase, with IC50 values of 1.1 μM, 38.00 μg/mL and 0.57 μM, respectively. Azaleatin inhibits the activities of NF-κB, MyD88, JAK1, TLR4, STAT3, IL-1β, IL-6, COX-2, TNF-α and β-glucuronidase, blocks pro-inflammatory signaling pathways, reduces the levels of ROS, MDA and uric acid, elevates the levels of GPx, GSR, GST, SOD, CAT, HO-1 and GSH, scavenges free radicals and exerts reducing capacity. Azaleatin inhibits the expression of pro-apoptotic proteins Bax, Caspase-9 and Caspase-3, and upregulates the expression of anti-apoptotic protein Bcl-2. Azaleatin reduces the levels of cardiac injury markers, restores cardiac histological structure, inhibits Aβ aggregation, dengue protease activity, hepatic stellate cell proliferation and cancer cell growth, and also exhibits antibacterial activity. Azaleatin can be used in studies related to subchronic cardiotoxicity, Alzheimer's disease, dengue fever, hyperuricemia, liver fibrosis, gastric cancer and bacterial infections.
商品は「研究用試薬」です。人や動物の医療用・臨床診断用・食品用の製品ではありません。
研究用途以外に使用した場合、当社は一切の責任を負いかねます。
- 純度 : 98.86%
- CAS 番号: 529-51-1
- 分子式: C16H12O7
- 分子量:316.26
-
保管条件:Powder -20°C, 3 years , 4°C, 2 years ; In solvent -80°C, 6 months , -20°C, 1 month

To place orders, for customer services and technical support, please contact: MedChemExpress USA
Tel: 609-228-6898 E-mail: [email protected] [email protected]


-
 生物活性
生物活性
-
化学情報
-
溶剤 & 溶解度
- プロトコル
- 純度とドキュメンテーション
- 参考文献
-
 Help & FAQs


-
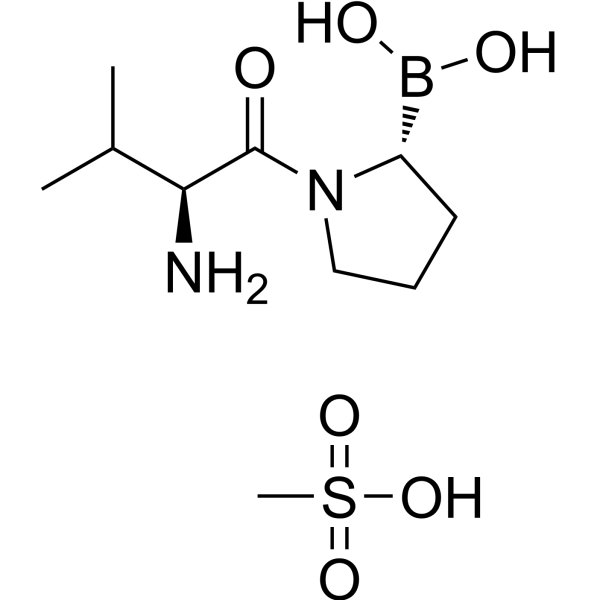
HY-13233A
Talabostat mesylateDipeptidyl Peptidase Inhibitor -
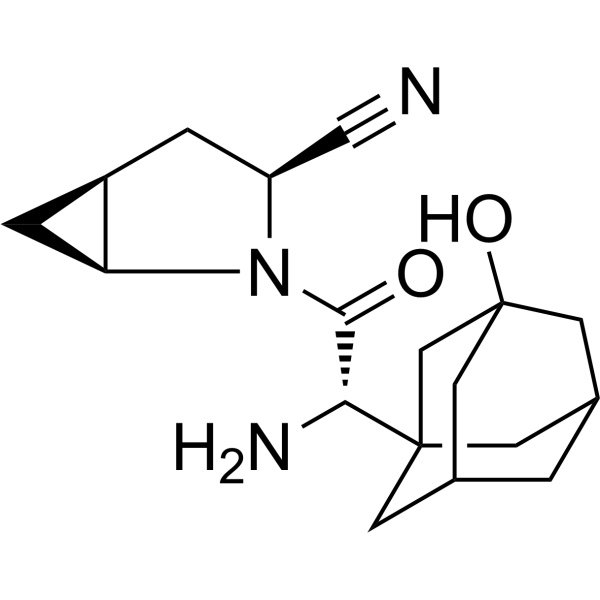
HY-10285
SaxagliptinDPP-4 Inhibitor -
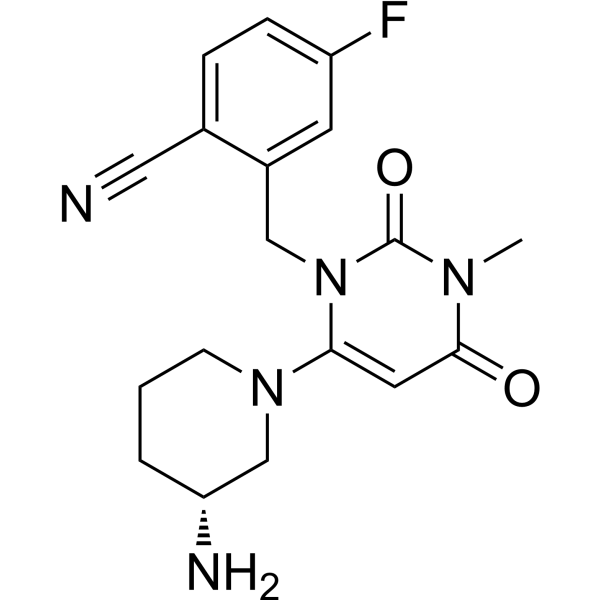
HY-15408
TrelagliptinDPP-4 Inhibitor -
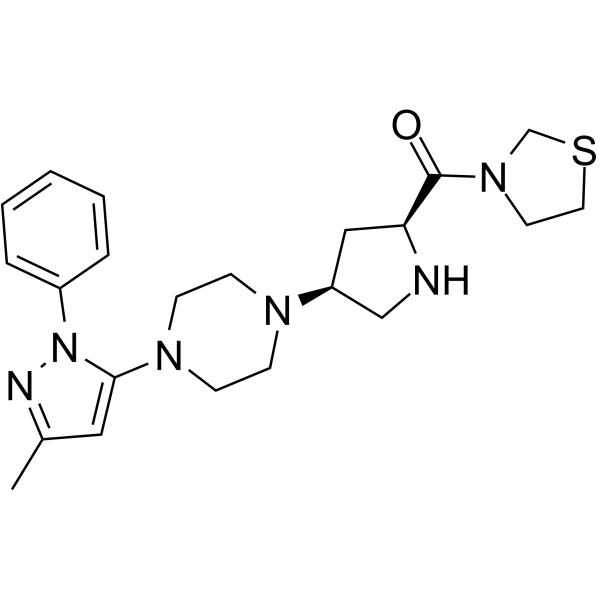
HY-14806
TeneligliptinDPP-4 Inhibitor -
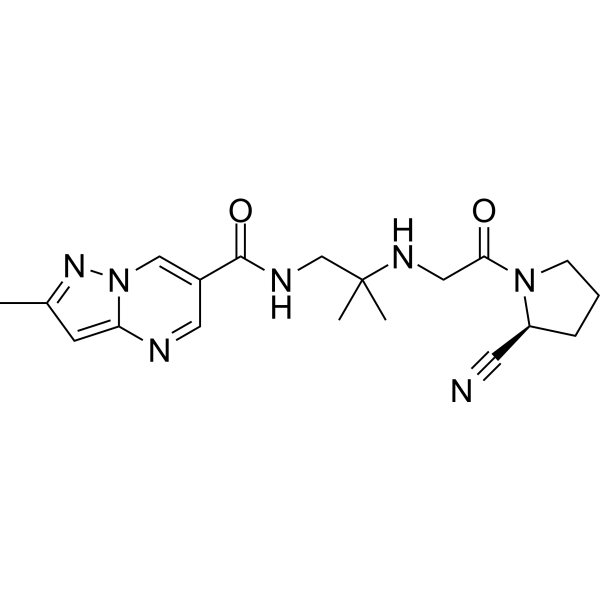
HY-14877
AnagliptinDPP-4 Inhibitor -
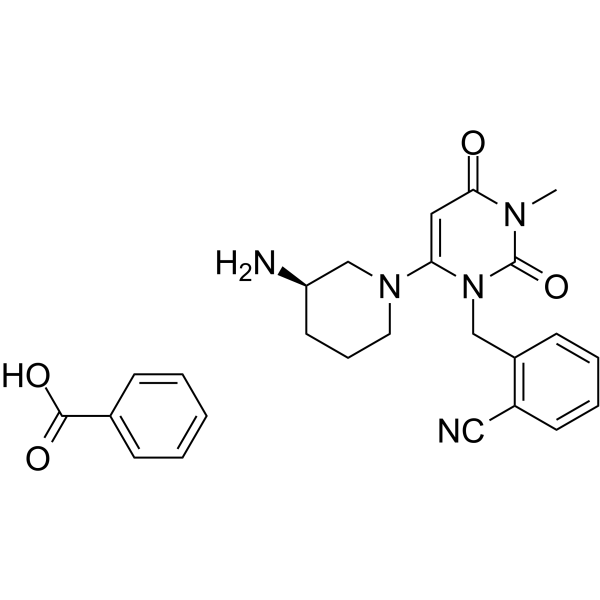
HY-A0023
Alogliptin BenzoateDPP-4 Inhibitor -
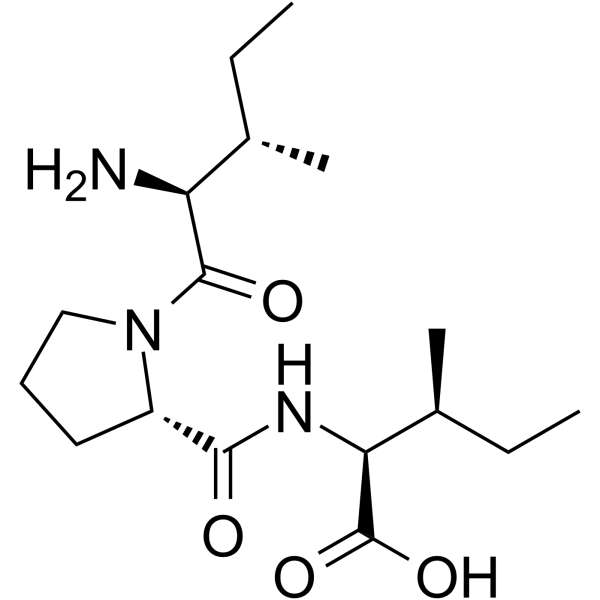
HY-111174
Diprotin ADipeptidyl Peptidase Inhibitor -
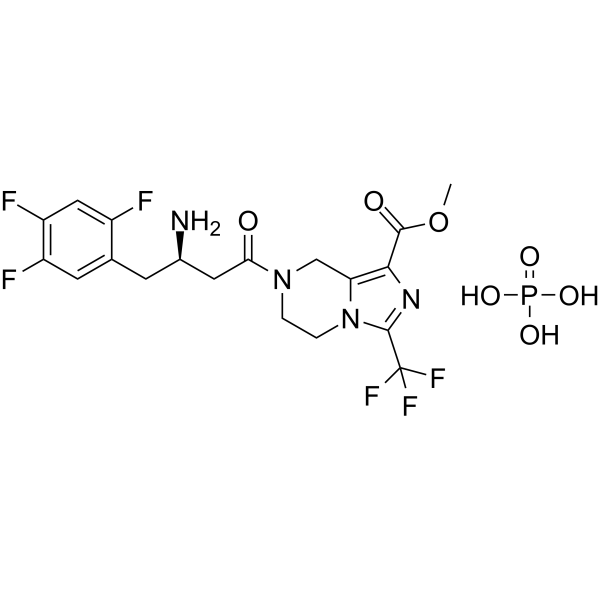
HY-112668
Retagliptin phosphateDPP-4 Inhibitor -
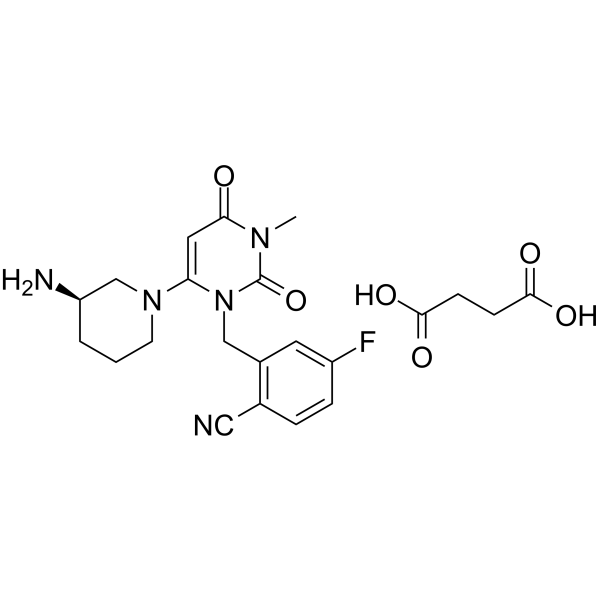
HY-15408A
Trelagliptin succinateDPP-4 Inhibitor -
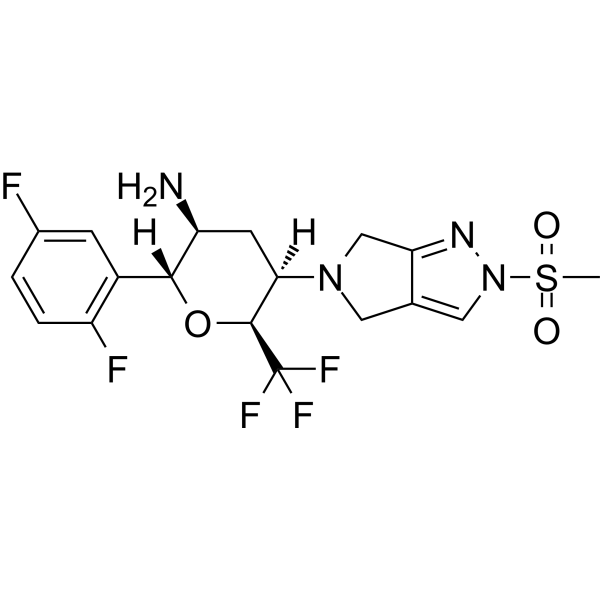
HY-147257
CofrogliptinDPP-4 Inhibitor -
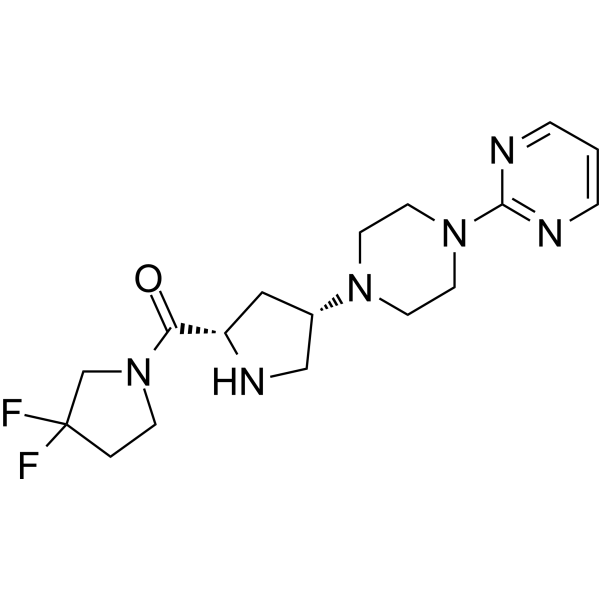
HY-10287
GosogliptinDPP-IV Inhibitor -
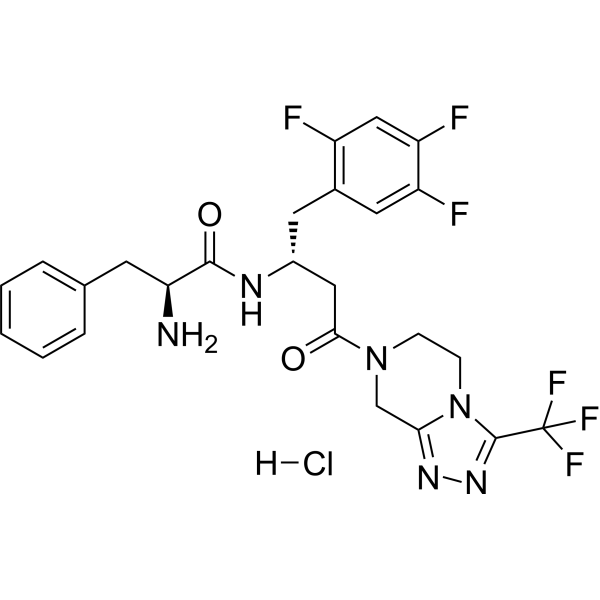
HY-147401A
Sitagliptin fenilalanil hydrochlorideDPP-4 Inhibitor
Caspase アイソフォーム固有の製品をすべて表示
More

生物活性
製品説明
|
DPP-4 |
JAK1 |
TLR4 |
STAT3 |
IL-6 |
IL-1β |
COX-2 |
hQC 1.1 μM (IC50) |
hQC 0.4 nM (Kd) |
GSR |
GST |
Caspase-9 |
Caspase-3 |
Cellular Effect
|
Cell Line

|
Type | Value | Description | References |
|---|---|---|---|---|
| HEK293 | IC50 |
0.74 μM
Compound: 7b
|
Inhibition of NOX4 expressed in HEK293 FS cells assessed as H2O2 production by H2O2/Tyr/LPO assay
Inhibition of NOX4 expressed in HEK293 FS cells assessed as H2O2 production by H2O2/Tyr/LPO assay
|
[PMID: 20731357] |
体外実験
Azaleatin binds strongly to NF-κB, TLR4, and STAT3 proteins, with the highest affinity for NF-κB (-8.5 kcal/mol), indicating its potential to regulate pro-inflammatory signaling pathways[1].
Azaleatin (multiple concentrations; 5 min) potently inhibits human glutaminyl cyclase (hQC) in biochemical assays, with an IC50 of 1.1 μM[2].
Azaleatin (12.5-100 μM) binds to purified human glutaminyl cyclase (hQC) with high affinity, and its KD is determined to be 0.4 nM by surface plasmon resonance[2].
Azaleatin binds to the active site of human glutaminyl cyclase (hQC) via coordination with catalytic zinc ions, hydrogen bonding, anion-π interactions, and hydrophobic interactions with key residues, thereby supporting its inhibitory activity[2].
Azaleatin complies with Lipinski's Rule of Five and possesses favorable pharmacokinetic properties, including good absorbability, non-carcinogenicity, and higher bioavailability compared with quercetin[3].
Azaleatin binds to the central active site of β-glucuronidase (PDB ID: 3K4D) with a binding affinity of -8.5 kcal/mol, and forms polar and hydrophobic interactions with key enzyme residues[4].
Azaleatin forms a stable complex with β-glucuronidase (PDB ID: 3K4D) during a 50 ns MD simulation, exhibiting characteristics of strong electrostatic interactions, stable hydrogen bonding, and reduced enzyme flexibility, which is consistent with its potent in vitro inhibitory activity[4].
Azaleatin (10-30 μM; 2 h) inhibits uric acid production in a concentration-dependent manner in AML12 hepatocytes[5].
Azaleatin (5-80 μM; 6-24 h) inhibits the proliferation of rat hepatic stellate cells (HSC-T6) at a concentration of 80 μM after 24 h of incubation; it promotes cell proliferation in a dose-dependent manner at 6 h, while exerts no effect at low doses within 12 h[6].
Azaleatin (20-40 μM; 24 h) reduces αSMA accumulation in a dose-dependent manner, and effectively inhibits TGFβ-induced type I collagen production in rat hepatic stellate cells (HSC-T6) after 24 h of co-treatment at concentrations of 20 μM and 40 μM[6].
Azaleatin (20 μM; 1-6 h) does not inhibit TGFβ-induced αSMA or Timp1 mRNA expression, but reduces type I collagen mRNA expression in a time-dependent manner in TGFβ-induced rat hepatic stellate cells (HSC-T6) after 6 hours of co-treatment at a concentration of 20 μM[6].
Azaleatin (5-1,000 μg/mL) exhibits in vitro antioxidant activity by scavenging DPPH, superoxide anion and hydroxyl radicals, as well as through its reducing capacity, but shows no metal chelating activity, with EC50 values of 37 μg/mL (DPPH), 90 μg/mL (superoxide anion), 688 μg/mL (hydroxyl radical) and 27 μg/mL (reducing capacity)[7].
Azaleatin is present in the ethanol extract of *Rhododendron anthopogonoides*, and its content is determined to be 0.10 mg/g fresh weight via UPLC quantitative analysis[7].
Azaleatin (5 mg) exists as its 3-O-α-L-rhamnoside derivative (azaleatin-3-O-α-L-rhamnoside) in the ethanolic fruit extract of *Azara dentata*. This compound is identified via UHPLC-ESI-Q-TOF-MS, with a pseudomolecular ion m/z value of 461.1064, corresponding to the product ion m/z value of 287.0555 for azaleatin-3-O-α-L-rhamnoside[8].
Azaleatin (3.125-200 μg/mL; 20-100 μg/mL) acts as a non-competitive inhibitor against dengue NS2B-NS3 serotype 2 protease, with an IC50 of 38 μg/mL and a Ki of 26.82 μg/mL[3].
Azaleatin binds to the allosteric pocket of dengue virus NS2B-NS3 protease (PDB ID: 3U1I) with a docking score of -8.2 kcal/mol, and forms hydrogen bonds and hydrophobic interactions with key functional residues[3].
Azaleatin (100 ns) forms a stable complex with dengue virus NS2B-NS3 protease (PDB ID: 3U1I) during the 100 ns simulation, stabilizes the closed conformation of this enzyme, and supports its non-competitive inhibition mode[3].
Azaleatin (0.001-1000 μM; 30 min) potently inhibits Escherichia coli β-glucuronidase via a non-competitive mechanism, with an IC50 of 0.57 μM and a Ki of 0.66 μM[4].
Azaleatin (10-250 μM; 48 h) inhibits the viability of HGC-27 cells. Its significant growth-inhibitory effect emerges starting at 10 μM, and cell viability drops to approximately 40% of that in the control group at the highest tested concentration. Among the three flavonoids tested, it exhibits the weakest cell growth inhibitory activity[9].
Azaleatin (20-35 μM; 24 h) significantly increases pentoside levels in HGC-27 cells at concentrations of 20 μM and above following 24 h of incubation. It exhibits moderate potency, which is higher than that of kaempferol but lower than that of myricetin[9].
Azaleatin (15-35 μM; 24 h) induces a dose-dependent increase in 3-deoxyglucosone levels in HGC-27 cells, with a significant elevation starting at 15 μM and reaching 2.5 times the control level at the highest tested concentration. Among the tested flavonoids, it exhibits the weakest effect on this indicator[9].
Azaleatin (5-35 μM; 24 h) potently elevates methylglyoxal levels in HGC-27 cells, with an initial effective concentration of 5 μM. At the highest tested concentration, the methylglyoxal level reaches approximately 3.3 times that of the control group. In terms of this indicator, its efficacy is far superior to that of other tested flavonoid compounds[9].
MedChemExpress (MCE) has not independently confirmed the accuracy of these methods. They are for reference only.
-
Cell Line:HSC-T6 (rat hepatic stellate cells)
-
Concentration:5, 10, 20, 40 and 80 μM
-
Incubation Time:6, 12 and 24 h
-
Result:Increased HSC-T6 proliferation in a dose-dependent manner after 6 h treatment.
Decreased proliferation to levels comparable to non-treated controls after 12 h treatment.
Markedly suppressed HSC-T6 proliferation at 80 μM after 24 h incubation; no inhibitory effect was observed at lower doses (5, 10, 20, 40 μM) up to 12 h.
-
Cell Line:HSC-T6 (TGFβ-induced rat hepatic stellate cells)
-
Concentration:20 and 40 μM
-
Incubation Time:24 h
-
Result:Reduced αSMA accumulation compared to TGFβ-induced positive controls, with dose-dependent enhancement from 20 μM to 40 μM; the inhibitory effect was weaker than other methylated quercetin derivatives.
Effectively inhibited collagen I production in TGFβ-induced HSC-T6 cells.
-
Cell Line:HSC-T6 (TGFβ-induced rat hepatic stellate cells)
-
Concentration:20 μM
-
Incubation Time:1 and 6 h
-
Result:Did not inhibit TGFβ-induced augmentation of αSMA mRNA after 1 h co-treatment.
Decreased αSMA mRNA levels after 6 h co-treatment, though levels remained higher than non-treated controls.
Increased collagen I mRNA after 1 h co-treatment but decreased it after 6 h in a time-dependent manner.
Did not inhibit TGFβ-induced increases in Timp1 mRNA expression after 6 h co-treatment.
-
Cell Line:HGC-27 immortalised human-stomach adenocarcinoma cells
-
Concentration:0, 50, 100, 150, 200 and 250 μM
-
Incubation Time:48 h
-
Result:Significantly inhibited HGC-27 cell growth starting at 10 μM.
Reduced cell viability to approximately 40% of control at the highest tested concentration.
Ranked as the least effective cell growth inhibitor among kaempferol, myricetin, and azaleatin.
-
Cell Line:AML12 cells
-
Concentration:0, 3, 10 and 30 μM
-
Incubation Time:2 h
-
Result:Significantly and dose-dependently decreased the uric acid production in the hepatocytes.
At dose of 3 μM did not inhibit uric acid production.
At 10 μM significantly suppressed uric acid production.
At 30 μM significantly suppressed uric acid production .
Showed more notable inhibitory effect at 30 μM than that at lower concentrations.
体内実験
Azaleatin (25 mg/kg; p.o.; daily; 8 weeks) is well-tolerated and does not induce adverse cardiac effects in healthy male Sprague Dawley rats[1].
MedChemExpress (MCE) has not independently confirmed the accuracy of these methods. They are for reference only.
-
Animal Model:Male Sprague-Dawley rats (13-14 weeks old, 225 g) were orally administered sodium arsenite (10 mg/kg) for 8 weeks to induce myocardial injury. Meanwhile, the compound was orally administered to evaluate its cardioprotective effects.
[1] -
Dosage:25 mg/kg
-
Administration:p.o.; daily; 8 weeks
-
Result:Significantly downregulated mRNA expressions of pro-inflammatory genes (NF-κB, MyD88, JAK1, TLR4, STAT3, IL-6, IL-1β, TNF-α) to levels not significantly different from the control group.
Restored cardiac antioxidant enzyme activities: catalase (CAT) increased from 2.27 U/mg protein to 8.50 U/mg protein; superoxide dismutase (SOD) increased from 2.02 U/mg protein to 5.47 U/mg protein; glutathione reductase (GSR) increased from 2.48 nM NADPH oxidized/min/mg tissue to 5.24 nM NADPH oxidized/min/mg tissue; glutathione peroxidase (GPx) increased from 3.49 U/mg protein to 11.81 U/mg protein; glutathione (GSH) increased from 3.06 μmol/g tissue to 9.37 μmol/g tissue; glutathione S-transferase (GST) increased from 4.28 U/mg protein to 14.92 U/mg protein; heme-oxygenase-1 (HO-1) increased from 68.58 pmoles bilirubin/mg protein/h to 231.18 pmoles bilirubin/mg protein/h.
Reduced oxidative stress markers: malondialdehyde (MDA) decreased from 13.61 nmol/g to 5.09 nmol/g; reactive oxygen species (ROS) decreased from 13.28 nmol/g to 4.47 nmol/g.
Reduced cardiac injury marker levels: CK-MB decreased from 83.05 ng/mL to 47.02 ng/mL; CPK decreased from 491.67 mcg/L to 273.89 mcg/L; troponin-I decreased from 5.89 pg/mL to 2.33 pg/mL; troponin-T decreased from 3.67 ng/mL to 1.59 ng/mL; LDH decreased from 42.10 mg/mL to 20.63 mg/mL; BNP decreased from 78.75 pg/mL to 40.89 pg/mL; NT-proBNP decreased from 316.73 pg/mL to 178.14 pg/mL; CRP decreased from 19.38 mg/L to 10.91 mg/L.
Modulated apoptotic markers: Bax decreased from 15.15 pg/mL to 4.97 pg/mL; caspase-9 decreased from 14.19 pg/mL to 6.46 pg/mL; caspase-3 decreased from 12.81 pg/mL to 3.43 pg/mL; Bcl-2 increased from 3.84 ng/mL to 8.34 ng/mL.
Prevented sodium arsenite-induced cardiac damage (myofiber degeneration, hypertrophy, vascular congestion, edema, hemorrhage, inflammation, dysregulated intercalated discs), preserving near-normal cardiac architecture.
Showed values for all measured parameters comparable to the control group in the azaleatin-only group, indicating a safe profile at the tested dose.
-
Animal Model:Sprague Dawley (male, 13-14 weeks old, 225 g)[1]
-
Dosage:25 mg/kg
-
Administration:p.o.; 8 weeks
-
Result:Resulted in mRNA expressions of pro-inflammatory genes (NF-κB, MyD88, JAK1, TLR4, STAT3, IL-6, IL-1β, TNF-α), antioxidant enzyme activities, oxidative stress marker levels, cardiac injury marker levels, apoptotic marker levels, and cardiac histology that were all comparable to the control group, with no significant differences detected.
- RNA extraction experimental
- Collagen: Sirius Red Staining
- Somatic Cell Culture
- Connective Tissue: Masson's Trichrome/Collagen Trichrome Staining
- Alzheimer’s Disease Modeling
- Detection of Apoptosis
- Apoptosis Solutions
- MTT Cell Proliferation Assay
- Pyroptosis Solutions
- Research Protocol for Infectious Diseases
- ROS/oxidative-stress fluorescent staining
- BrdU Incorporation Assay
- CFSE Dye Dilution Proliferation Assay
- Dye-dilution cell tracking and proliferation staining
- CCK-8/WST-8 Cell Proliferation Assay
- Protocol for Cell Cycle
- Research Protocol for Inflammation-related Diseases
- Cell Counting-Based Growth Curve Assay
- Colony Formation (Clonogenic) Assay
- Bacterial live/dead nucleic-acid viability staining
- Cell Viability Determination by MTT Colorimetric Assay
- Liver Histomorphometry
- Fibrosis/Collagen Morphometry
- EdU Incorporation Assay (Click Chemistry-Based DNA Synthesis Measurement)
- Ki-67 Immunostaining Proliferation Assay
- PCNA Immunodetection Proliferation Assay
- Protocol for Cell Counting and Cell Density Analysis


化学情報
-
CAS 番号 529-51-1
-
性状 Solid
-
分子量 316.26
-
分子式 C16H12O7
-
Color Off-white to light yellow
-
SMILES
O=C1C(O)=C(C2=CC=C(O)C(O)=C2)OC3=CC(O)=CC(OC)=C13
-
Structure Classification
-
輸送条件
Room temperature in continental US; may vary elsewhere.
-
保管条件
Powder -20°C 3 years 4°C 2 years In solvent -80°C 6 months -20°C 1 month


溶剤 & 溶解度
体外:
DMSO : 50 mg/mL (158.10 mM; Need ultrasonic; Hygroscopic DMSO has a significant impact on the solubility of product, please use newly opened DMSO)
Please refer to the solubility information to select the appropriate solvent. Once prepared, please aliquot and store the solution to prevent product inactivation from repeated freeze-thaw cycles.
Storage method and period of stock solution: -80°C, 6 months; -20°C, 1 month. When stored at -80°C, please use it within 6 months. When stored at -20°C, please use it within 1 month.
Please refer to the solubility information to select the appropriate solvent. Once prepared, please aliquot and store the solution to prevent product inactivation from repeated freeze-thaw cycles.
Storage method and period of stock solution: -80°C, 6 months; -20°C, 1 month. When stored at -80°C, please use it within 6 months. When stored at -20°C, please use it within 1 month.
濃度 (開始) × 体積 (開始) = 濃度 (終了) × 体積 (終了)
体内:
Select the appropriate dissolution method based on your experimental animal and administration route.
- For the following dissolution methods, please ensure to first prepare a clear stock solution using an In Vitro approach and then sequentially add co-solvents:
- To ensure reliable experimental results, the clarified stock solution can be appropriately stored based on storage conditions. As for the working solution for In Vivo experiments, it is recommended to prepare freshly and use it on the same day.
- The percentages shown for the solvents indicate their volumetric ratio in the final prepared solution. If precipitation or phase separation occurs during preparation, heat and/or sonication can be used to aid dissolution.
Add each solvent one by one: 10% DMSO 40% PEG300 5% Tween-80 45% Saline
Solubility: ≥ 1.25 mg/mL (3.95 mM); Clear solution
This protocol yields a clear solution of ≥ 1.25 mg/mL (saturation unknown).
Taking 1 mL working solution as an example, add 100 μL DMSO stock solution (12.5 mg/mL) to 400 μL PEG300, and mix evenly; then add 50 μL Tween-80 and mix evenly; then add 450 μL Saline to adjust the volume to 1 mL.
Preparation of Saline: Dissolve 0.9 g sodium chloride in ddH₂O and dilute to 100 mL to obtain a clear Saline solution.
Add each solvent one by one: 10% DMSO 90% (20% SBE-β-CD in Saline)
Solubility: ≥ 1.25 mg/mL (3.95 mM); Clear solution
This protocol yields a clear solution of ≥ 1.25 mg/mL (saturation unknown).
Taking 1 mL working solution as an example, add 100 μL DMSO stock solution (12.5 mg/mL) to 900 μL 20% SBE-β-CD in Saline, and mix evenly.
Preparation of 20% SBE-β-CD in Saline (4°C, storage for one week): 2 g SBE-β-CD powder is dissolved in 10 mL Saline, completely dissolve until clear.
In Vivo Dissolution Calculator
Please enter the basic information of animal experiments:
-
-
-
-
Recommended: Prepare an additional quantity of animals to account for potential losses during experiments.
Please enter your animal formula composition:
-
%DMSO +
Recommended: Keep the proportion of DMSO in working solution below 2% if your animal is weak.
-
%+
-
+%Tween-80 + +
-
%Saline +
The co-solvents required include: DMSO, . All of co-solvents are available by MedChemExpress (MCE). , Tween 80. All of co-solvents are available by MedChemExpress (MCE).
Working solution concentration: 0.22 mg/mL
Method for preparing stock solution: mg drug dissolved in μL DMSO. Stock solution concentration: mg/mL.
1. Take μL DMSO stock solution;
2. Add μL .
μL , mix evenly;
3. Then add μL Tween 80, mix evenly;
4. Then add μL
Please ensure that the stock solution in the first step is dissolved to a clear state, and add co-solvents in sequence. You can use ultrasonic heating (ultrasonic cleaner, recommended frequency 20-40 kHz), vortexing, etc. to assist dissolution.


純度とドキュメンテーション
-
データシート (309 KB)
-
SDS (394 KB)
- English - EN (394 KB)
- Français - FR (394 KB)
- Deutsch - DE (394 KB)
- Norwegian - NO (394 KB)
- Español - ES (394 KB)
- Swedish - SV (394 KB)
- Italian - IT (394 KB)
- Korean - KR (394 KB)
- Portuguese - PT (394 KB)
-
取扱説明書 (2659 KB)
参考文献
[1]. Hassan HM, et al. Cardioprotective potential of azaleatin against sodium arsenite instigated sub-chronic cardiotoxicity via targeting TLR4/MyD88, JAK1/STAT3, and NF-κB in Sprague Dawley rats. J Trace Elem Med Biol. 2025;92:127763. [Content Brief]
[2]. Tsai KC, et al. Pharmacophore-driven identification of human glutaminyl cyclase inhibitors from foods, plants and herbs unveils the bioactive property and potential of Azaleatin in the treatment of Alzheimer's disease. Food Funct. 2022;13(24):12632-12647. Published 2022 Dec 13. [Content Brief]
[3]. Mustafa NF, Cheng KK, Nadri MH, Razali SA, Zakaria II, Salin NH, Amran SI. Discovery of azaleatin as a potential allosteric inhibitor for dengue NS2B-NS3 protease using in vitro and in silico studies. Journal of Biomolecular Structure and Dynamics. 2025 Sep 22;43(14):7759-70. [Content Brief]
[4]. Kamel EM, et al. Deciphering molecular mechanisms underlying the inhibition of β-glucuronidase by xanthones from Centaurium spicatum. Bioorg Chem. 2024;150:107609. [Content Brief]
[5]. Adachi SI, et al. Anti-hyperuricemic effect of isorhamnetin in cultured hepatocytes and model mice: structure-activity relationships of methylquercetins as inhibitors of uric acid production. Cytotechnology. 2019;71(1):181-192. [Content Brief]
[6]. Ganbold M, et al. Antifibrotic effect of methylated quercetin derivatives on TGFβ-induced hepatic stellate cells. Biochem Biophys Rep. 2019;20:100678. Published 2019 Aug 16. [Content Brief]
[7]. Dai L, He J, Miao X, Guo X, Shang X, Wang W, Li B, Wang Y, Pan H, Zhang J. Multiple biological activities of Rhododendron przewalskii Maxim. extracts and UPLC-ESI-Q-TOF/MS characterization of their phytochemical composition. Frontiers in Pharmacology. 2021 Feb 10;12:599778. [Content Brief]
[8]. Ramos LC, Palacios J, Barrientos RE, Gómez J, Castagnini JM, Barba FJ, Tapia A, Paredes A, Cifuentes F, Simirgiotis MJ. UHPLC-MS phenolic fingerprinting, aorta endothelium relaxation effect, antioxidant, and enzyme inhibition activities of azara dentata ruiz & pav berries. Foods. 2023 Feb 2;12(3):643. [Content Brief]


Complete Stock Solution Preparation Table
Please refer to the solubility information to select the appropriate solvent. Once prepared, please aliquot and store the solution to prevent product inactivation from repeated freeze-thaw cycles.
Storage method and period of stock solution: -80°C, 6 months; -20°C, 1 month. When stored at -80°C, please use it within 6 months. When stored at -20°C, please use it within 1 month.
| Optional Solvent | Concentration Solvent Mass | 1 mg | 5 mg | 10 mg | 25 mg |
|---|---|---|---|---|---|
| DMSO | 1 mM | 3.1620 mL | 15.8098 mL | 31.6196 mL | 79.0489 mL |
| 5 mM | 0.6324 mL | 3.1620 mL | 6.3239 mL | 15.8098 mL | |
| 10 mM | 0.3162 mL | 1.5810 mL | 3.1620 mL | 7.9049 mL | |
| 15 mM | 0.2108 mL | 1.0540 mL | 2.1080 mL | 5.2699 mL | |
| 20 mM | 0.1581 mL | 0.7905 mL | 1.5810 mL | 3.9524 mL | |
| 25 mM | 0.1265 mL | 0.6324 mL | 1.2648 mL | 3.1620 mL | |
| 30 mM | 0.1054 mL | 0.5270 mL | 1.0540 mL | 2.6350 mL | |
| 40 mM | 0.0790 mL | 0.3952 mL | 0.7905 mL | 1.9762 mL | |
| 50 mM | 0.0632 mL | 0.3162 mL | 0.6324 mL | 1.5810 mL | |
| 60 mM | 0.0527 mL | 0.2635 mL | 0.5270 mL | 1.3175 mL | |
| 80 mM | 0.0395 mL | 0.1976 mL | 0.3952 mL | 0.9881 mL | |
| 100 mM | 0.0316 mL | 0.1581 mL | 0.3162 mL | 0.7905 mL |


Azaleatin 関連分類
HY-N7653 関連分類
 Powered by Bioz
Keywords
- Azaleatin
- 529-51-1
- Dipeptidyl Peptidase
- NF-κB
- MyD88
- JAK
- Toll-like Receptor (TLR)
- STAT
- Interleukin Related
- COX
- Reactive Oxygen Species (ROS)
- Glutathione S-transferase
- SOD
- Bcl-2 Family
- Caspase
- Apoptosis
- Dengue Virus
- HSC-T6
- human glutaminyl cyclase
- Staphylococcus aureus
- TLR4
- Alzheimer’s disease
- Escherichia coli
- HGC-27
- STAT3
- dengue NS2B-NS3 protease
- Inhibitor
- inhibitor
- inhibit