



AS2034178 free base
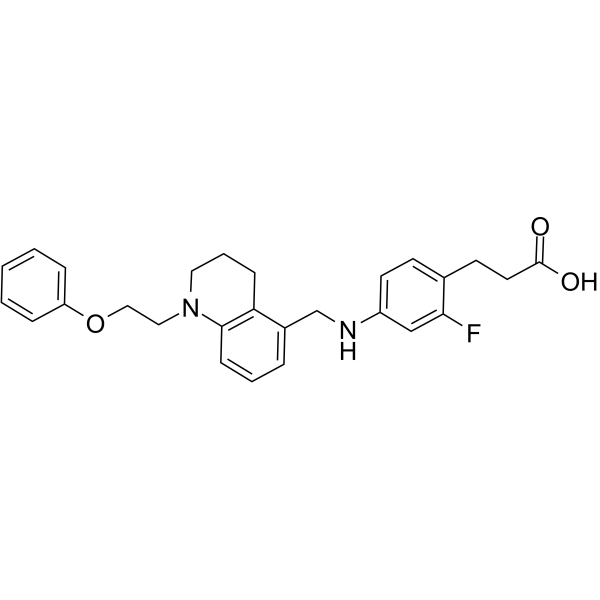
AS2034178 free base is an orally active GPR40/FFAR1 agonist. AS2034178 free base elevates intracellular calcium through the Gq/PLC/PKC pathway, stimulates glucose-dependent insulin secretion, and activates GLP-2 production in intestinal L cells. AS2034178 free base inhibits transient, late, and persistent sodium currents, and blocks the delayed rectifier potassium current. AS2034178 free base activates c-Src, AKT, NF-κB, and cyclooxygenase signaling pathways, inhibits EGFR/ERK and STAT signaling pathways, modulates EMT markers, promotes tumor cell proliferation and growth, and inhibits migration and invasion. AS2034178 free base can be used for research on type 2 diabetes, DSS-induced colitis, and papillary renal cell carcinoma.
For research use only. We do not sell to patients.
- CAS No.: 1030846-42-4
- Formula: C27H29FN2O3
- Molecular Weight:448.53
-
Storage:
Please store the product under the recommended conditions in the Certificate of Analysis.

To place orders, for customer services and technical support, please contact: MedChemExpress USA
Tel: 609-228-6898 E-mail: [email protected] [email protected]


-
 Biological Activity
-
Chemical Information
- Protocols
- Purity & Documentation
- References
-
 Help & FAQs


-
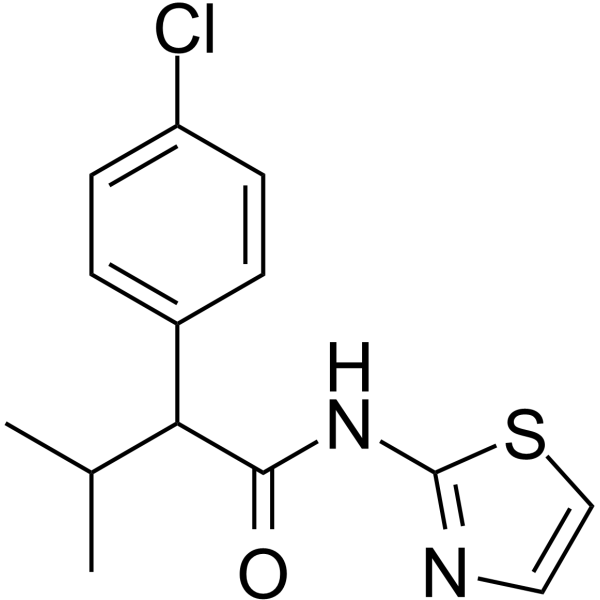
HY-P1125
4-CMTBFFA2 Agonist -
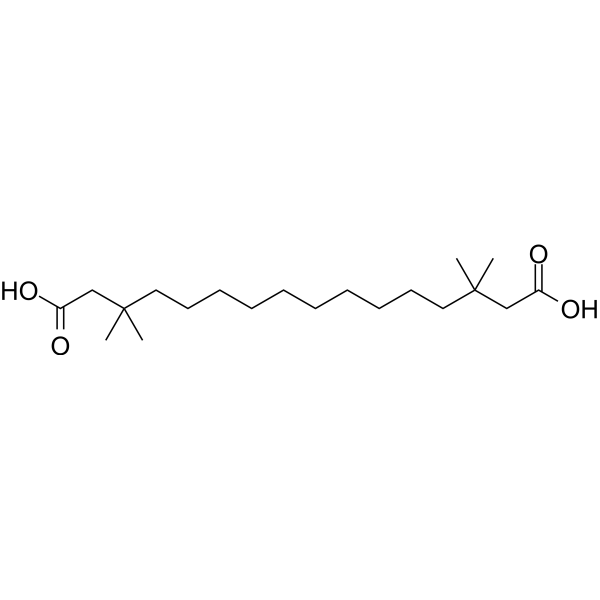
HY-P1123
MEDICA16Acetyl-CoA Carboxylase/ATP-Citrate Lyase Inhibitor -
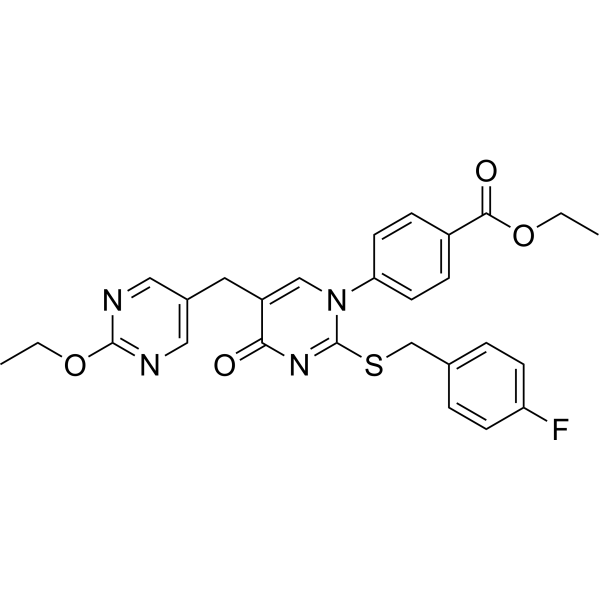
HY-50691
GW-1100Free Fatty Acid Receptor Antagonist -
HY-19996
AH-7614FFA4 Antagonist -
HY-15697
TUG-770GPR40/FFA1 Agonist -
HY-116263
CATPBFFA2R Antagonist -

HY-P1123R
MEDICA16 (Standard)Free Fatty Acid Receptor Agonist -
HY-14363
TUG-424Free Fatty Acid Receptor Agonist -
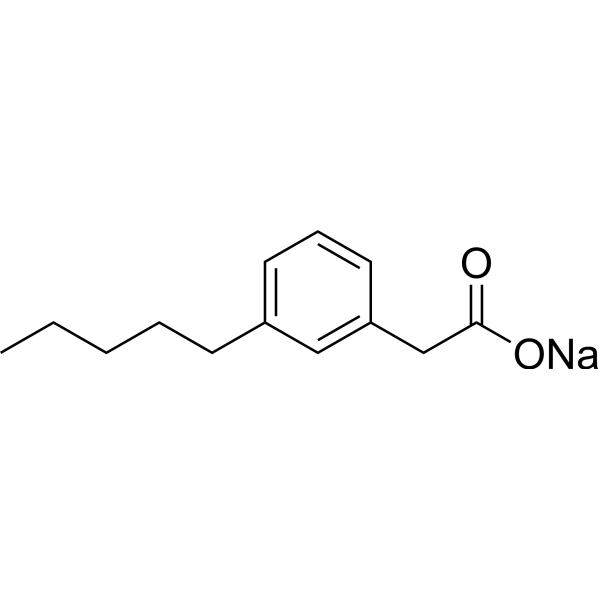
HY-100775
Fezagepras sodiumGPR40/GPR84 Modulator -
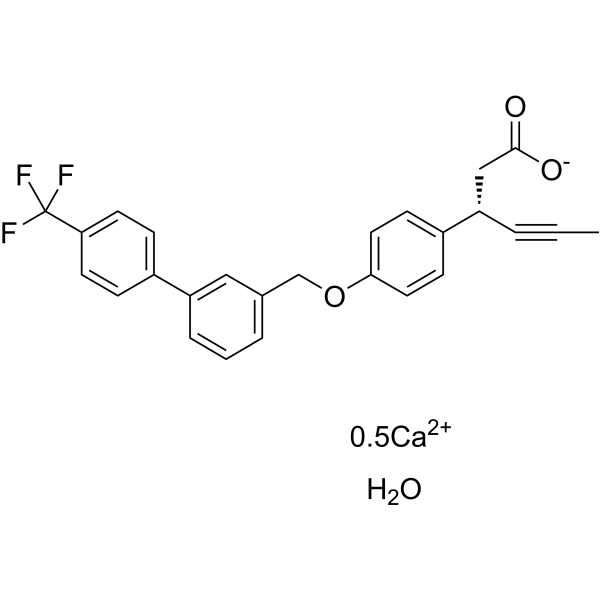
HY-13967B
AMG 837 calcium hydrateGPR40/FFA1 Agonist -
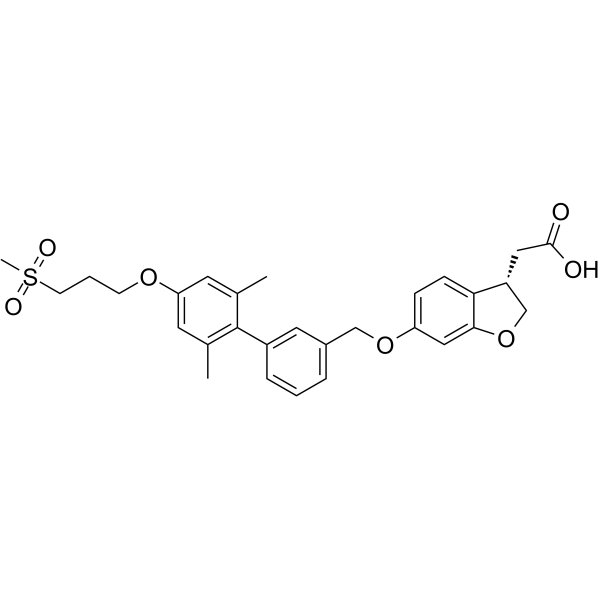
HY-10480
FasiglifamGPR40 Agonist -
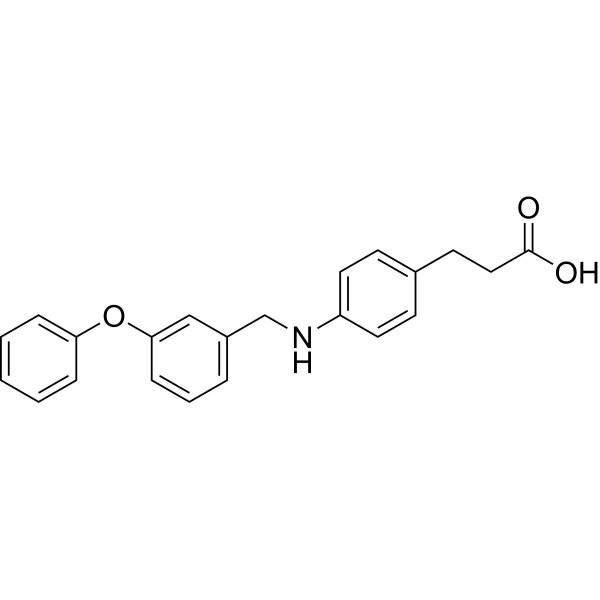
HY-15589
GW9508GPR40 Agonist
All EGFR Isoforms
More

Biological Activity
Description
|
Akt |
NF-κB |
COX-2 |
PI3K |
C-src |
erk1 |
ERK2 |
EGFR |
STAT3 |
In Vitro
AS2034178 (10 µM) free base-driven ACHN proliferation depends on the AKT, NF-κB, and COX-2 signaling pathways, and MK2206 (HY-108232) and BAY 11-7082 (HY-13453) reduce this effect by approximately 70% and 80%, respectively[3].
AS2034178 (10 µM; 24 h) free base inhibits ACHN scratch wound healing/migration, and GW1100 (HY-50691) reverses this effect[3].
AS2034178 (10 µM; 24 h) free base reduces ACHN Matrigel invasion and partially blocks EGF-stimulated invasion[3].
AS2034178 (0-24 h) free base activates the c-Src/PI3K/AKT/NF-κB/COX-2 signaling pathway in ACHN pRCC cells[3].
AS2034178 (10 μM; 0-24 h) free base inhibits EGFR Tyr1068 and ERK1/2 phosphorylation in ACHN pRCC cells and partially blocks EGF-induced EGFR/ERK signaling[3].
AS2034178 (10 μM; 0-24 h) free base inhibits STAT3 Tyr705 phosphorylation in ACHN pRCC cells in an EGFR- and β-arrestin-independent manner[3].
AS2034178 (0-24 h) free base reduces E-cadherin, vimentin, and fibronectin-1 levels in ACHN pRCC cells without affecting N-cadherin, and the regulation of fibronectin-1 involves β-arrestin signaling[3].
AS2034178 (1-100 μM) free base inhibits transient and delayed voltage-gated Na+ currents in GH3 pituitary prolactin cells, with IC50 values of 29.8 μM and 5.3 μM for INa (T) and INa (L), respectively[4].
MedChemExpress (MCE) has not independently confirmed the accuracy of these methods. They are for reference only.
-
Cell Line:ACHN human papillary RCC cells
-
Concentration:10 µM
-
Incubation Time:every 24 h for 6 days; cell counts every 24 h
-
Result:Increased ACHN cell proliferation on days 5 and 6 compared with vehicle-treated cells.
GW1100 blocked the increase on days 5 and 6.
-
Cell Line:ACHN human papillary RCC cells
-
Concentration:10 µM
-
Incubation Time:24 h
-
Result:Wider wounds than control cells were observed after 24 h, indicating inhibition of migration.
GW1100 blocked the negative effect on wound closure and increased wound healing.
-
Cell Line:ACHN human papillary RCC cells
-
Concentration:10 µM
-
Incubation Time:24 h
-
Result:Reduced ACHN invasion through Matrigel.
Partially inhibited EGF-induced invasion in EGF-stimulated cells.
-
Cell Line:ACHN human papillary RCC cells
-
Concentration:10 µM
-
Incubation Time:24 h
-
Result:Inhibited EGFR Tyr1068 and ERK1/2 phosphorylation in ACHN pRCC cells.
Partially blocked EGF-induced EGFR/ERK signaling.
Inhibited STAT3 Tyr705 phosphorylation in ACHN pRCC cells in an EGFR- and β-arrestin-independent manner.
In Vivo
AS2034178 (1 mg/kg; p.o.; once daily for 10 consecutive days) free base repeated administration improves insulin sensitivity in ob/ob mice[1].
MedChemExpress (MCE) has not independently confirmed the accuracy of these methods. They are for reference only.
-
Animal Model:ICR (male; 5 weeks at purchase)[1]
-
Dosage:0.3, 1, 3, and 10 mg/kg
-
Administration:p.o.; single dose 30 minutes before oral glucose
-
Result:Dose-dependently suppressed the rise in plasma glucose after oral glucose; plasma glucose AUC was decreased at doses over 1 mg/kg.
Plasma insulin after oral glucose increased dose-dependently, with the 5-minute plasma insulin increase reported at doses over 3 mg/kg.
-
Animal Model:ob/ob (male; 7 weeks)[1]
-
Dosage:0.03, 0.1, 0.3, and 1 mg/kg
-
Administration:p.o.; once daily; repeated for 4 weeks
-
Result:Plasma glucose decreased dose-dependently and reached maximum efficacy at dosages over 0.1 mg/kg; efficacy was observed from 0.03 mg/kg.
HbA1c decreased dose-dependently by approximately 1.5%.
Plasma insulin decreased dose-dependently.
Pancreatic insulin content increased dose-dependently and reached maximum efficacy at dosages over 0.1 mg/kg.
Plasma triglyceride levels were unchanged.
Body weight decreased at 1 mg/kg, with no body weight effect at the other doses.
-
Animal Model:ob/ob (male; 7 weeks)[1]
-
Dosage:1 mg/kg
-
Administration:p.o.; once daily for 10 days
-
Result:At both insulin doses, plasma glucose decreased at 30 and 60 minutes after insulin administration compared with vehicle.
-
Animal Model:C57BL/6 (male, 9-12 weeks, 22-26 g)[2]
-
Dosage:1 mg/kg; 3 mg/kg; 10 mg/kg
-
Administration:p.o.; once daily; days 0-6
-
Result:DSS increased the disease activity index from day 4, peaking on day 7.
Attenuated the increase in disease activity index in a dose-dependent manner, with reductions at 3 and 10 mg/kg relative to DSS alone.
Restored DSS-reduced colon length dose-dependently, with the 10 mg/kg group differing from DSS control.
Histological damage was mitigated at 3 and 10 mg/kg, with lower histological scores than DSS controls.
Blocked the DSS-induced increase in colonic MPO activity and reduced TNF-α mRNA expression.
IL-1β and IL-6 mRNA showed a decreasing tendency at 3 and 10 mg/kg.
Colonic tissue GLP-2 was decreased by DSS and was increased dose-dependently, with an increase at 10 mg/kg.
Plasma GLP-2 was not affected compared with DSS control.
-
Animal Model:homozygous athymic nude (strain code 490; male; 3-4 weeks old)[3]
-
Dosage:10 mg/kg
-
Administration:i.p.; daily; 28 days
-
Result:Tumors were larger than vehicle-control tumors beginning at day 16 of administration and remained larger through the 28-day administration period.
Final average tumor weight was higher than in the vehicle-control group.
- BrdU Incorporation Assay
- Cell migration
- Somatic Cell Culture
- Human Islet Cell Culture
- CFSE Dye Dilution Proliferation Assay
- Dye-dilution cell tracking and proliferation staining
- CCK-8/WST-8 Cell Proliferation Assay
- Protocol for Cell Cycle
- Ca2+ Staining Technique
- Research Protocol for Inflammation-related Diseases
- Cell Counting-Based Growth Curve Assay
- Colony Formation (Clonogenic) Assay
- Research Protocol for Metabolic Diseases
- Cell Viability Determination by MTT Colorimetric Assay
- EdU Incorporation Assay (Click Chemistry-Based DNA Synthesis Measurement)
- Ki-67 Immunostaining Proliferation Assay
- PCNA Immunodetection Proliferation Assay
- Protocol for Cell Counting and Cell Density Analysis
- Research Protocol for Endocrine Diseases
- DSS-Induced Colitis
- TNBS-Induced Colitis
- Calcium Spark Assay
- Cell invasion
- MTT Cell Proliferation Assay


Chemical Information
-
CAS No. 1030846-42-4
-
Molecular Weight 448.53
-
Formula C27H29FN2O3
-
SMILES
O=C(O)CCC1=CC=C(NCC2=CC=CC3=C2CCCN3CCOC4=CC=CC=C4)C=C1F
-
Shipping
Room temperature in continental US; may vary elsewhere.
-
Storage
Please store the product under the recommended conditions in the Certificate of Analysis.


Purity & Documentation
References

Calculators
Concentration (start) × Volume (start) = Concentration (final) × Volume (final)


AS2034178 free base Related Classifications
HY-P1124 Related Classifications
 Powered by Bioz
Keywords
- AS2034178
- 1030846-42-4
- AS 2034178
- AS-2034178
- Free Fatty Acid Receptor
- PKC
- Src
- Akt
- NF-κB
- PI3K
- COX
- EGFR
- STAT
- Sodium Channel
- Potassium Channel
- FFAR
- Protein kinase C
- PKB
- Protein kinase B
- Nuclear factor-κB
- Nuclear factor-kappaB
- Phosphoinositide 3-kinase
- Cyclooxygenase
- Epidermal growth factor receptor
- ErbB-1
- HER1
- Na channels
- Na+ channels
- KcsA
- DSS-induced colitis
- EGFR/ERK signaling
- GLP-2
- GPR40/FFAR1
- delayed-rectifier potassium current
- epithelial-mesenchymal transition
- insulin secretion
- papillary renal cell carcinoma
- sodium current
- type 2 diabetes mellitus
- Inhibitor
- inhibitor
- inhibit