



Cardanol monoene

Based on 1 Customer Validation
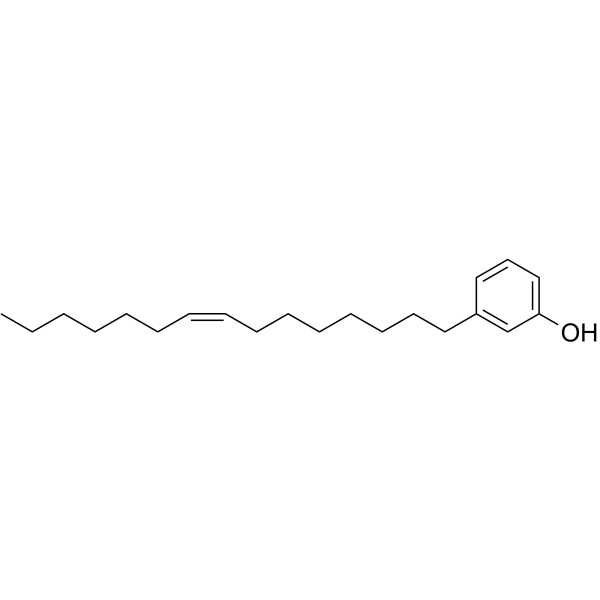
Cardanol monoene (Cardanol C15:1) is a phenolic compound which can be found in cashew nut shell liquid. Cardanol monoene can inhibit cancer cells proliferation, migration, cause S phase arrest, induce apoptosis, ROS production and mitochondrial depolarization. Cardanol monoene downregulates MMP-2, MMP-9, cyclinA1 expression, regulates CDK2, p53, Bax, cytochrome c, cleaved caspase-3, cleaved PARP, Apaf-1 expression and Bax/Bcl-2 ratio. Cardanol monoene shows weak DPPH radical scavenging activity and AChE inhibition activity. Cardanol monoene is lethal to Artemia salina nauplii. Cardanol monoene. Cardanol monoene can be used for the research of cancer, infection and inflamation.
For research use only. We do not sell to patients.
- Purity : 99.51%
- CAS No.: 501-26-8
- Formula: C21H34O
- Molecular Weight:302.49
-
Storage:Pure form -20°C, 3 years , 4°C, 2 years ; In solvent -80°C, 6 months , -20°C, 1 month

To place orders, for customer services and technical support, please contact: MedChemExpress USA
Tel: 609-228-6898 E-mail: [email protected] [email protected]


-
 Biological Activity
-
Chemical Information
-
Solvent & Solubility
- Protocols
- Purity & Documentation
- References
-
 Help & FAQs


-
HY-13426S
Roxadustat-d5Stable Isotope -
HY-126983
6',7'-EpoxybergamottinFungal Metabolite -
HY-W013331
DeoxyartemisininAnti-inflammatory and Analgesic Agent -
HY-113612A
Cytostatin sodiumPP2A Inhibitor -

HY-N12261
Benastatin BGST Inhibitor -
HY-B0223S2
Albendazole-d7Stable Isotope -
HY-N2687
5-n-TricosylresorcinolFlavonoid Compound -

HY-125322
Reveromycin CPolyketide
All Caspase Isoforms
More

Biological Activity
Description
IC50 & Target
[1]|
MMP-2 |
MMP-9 |
cdk2/cyclin A |
Caspase 3 |
Bcl-2 |
Bax |
AChE |
Cellular Effect
|
Cell Line

|
Type | Value | Description | References |
|---|---|---|---|---|
| A549 | IC50 |
9.09 μg/mL
Compound: 1, cardanol C15:1
|
Growth inhibition of human A549 cells after 2 days by SRB assay
Growth inhibition of human A549 cells after 2 days by SRB assay
|
[PMID: 9677265] |
| CCD-18Co | IC50 |
54.58 μg/mL
Compound: 1, cardanol C15:1
|
Growth inhibition of human CCD-18Co cells after 2 days by SRB assay
Growth inhibition of human CCD-18Co cells after 2 days by SRB assay
|
[PMID: 9677265] |
| HCT-15 | IC50 |
29.9 μg/mL
Compound: 1, cardanol C15:1
|
Growth inhibition of human HCT15 cells after 2 days by SRB assay
Growth inhibition of human HCT15 cells after 2 days by SRB assay
|
[PMID: 9677265] |
| HT1197 | IC50 |
18.81 μg/mL
Compound: 1, cardanol C15:1
|
Growth inhibition of human HT1197 cells after 2 days by SRB assay
Growth inhibition of human HT1197 cells after 2 days by SRB assay
|
[PMID: 9677265] |
| MCF7 | IC50 |
5.56 μg/mL
Compound: 1, cardanol C15:1
|
Growth inhibition of human MCF7 cells after 2 days by SRB assay
Growth inhibition of human MCF7 cells after 2 days by SRB assay
|
[PMID: 9677265] |
| SK-OV-3 | IC50 |
12.9 μg/mL
Compound: 1, cardanol C15:1
|
Growth inhibition of human SKOV3 cells after 2 days by SRB assay
Growth inhibition of human SKOV3 cells after 2 days by SRB assay
|
[PMID: 9677265] |
In Vitro
Cardanol monoene (2.5-40 μM; 24-48 h) inhibits human M14 melanoma cell proliferation with IC50 values of 23.15 ± 2.42 μM at 24 h and 12.30 ± 1.67 μM at 48 h, acting in a dose-dependent and time-dependent manner[1].
Cardanol monoene (10-50 μM; 2 weeks) dose-dependently reduces the colony-formation ability of human M14 melanoma cells, with 40 μM treatment lowering efficiency to 5.46% over 7 days[1].
Cardanol monoene (10-40 μM; 48 h) dose-dependently inhibits human M14 melanoma cell migration over 48 h by down-regulating MMP-2 and MMP-9 protein expression[1].
Cardanol monoene (10-40 μM; 24 h) induces dose-dependent S phase arrest in human M14 melanoma cells after 24 h treatment, reducing cyclinA1 mRNA expression and increasing CDK2 mRNA expression to inhibit cell proliferation[1].
Cardanol monoene (10-50 μM; 24-48 h) induces dose-dependent caspase-mediated apoptosis in human M14 melanoma cells via up-regulating pro-apoptotic proteins (p53, Bax, cytochrome c, cleaved caspase-3, cleaved PARP, Apaf-1), increasing the Bax/Bcl-2 ratio, and down-regulating anti-apoptotic Bcl-2, with 40 μM treatment causing 43.46% apoptotic cells after 24 h[1].
Cardanol monoene (10-40 μM; 24 h) dose-dependently increases intracellular ROS levels in human M14 melanoma cells after 24 h treatment, with 40 μM causing a 65.27% increase relative to control[1].
Cardanol monoene (10-40 μM; 24 h) dose-dependently induces mitochondrial depolarization in human M14 melanoma cells after 24 h treatment, with 40 μM reducing the red/green JC-1 fluorescence ratio to 50.37% of control[1].
Cardanol monoene (40 μM; 24 h) alters the expression of 2527 genes in human M14 melanoma cells, with DEGs enriched in cancer-related pathways including Pathways in cancer, PI3K-Akt, MAPK, and p53 signaling pathways[1].
Cardanol monoene shows weak DPPH radical scavenging and AChE inhibition activity[2].
MedChemExpress (MCE) has not independently confirmed the accuracy of these methods. They are for reference only. Further protocols information, click here.
-
Cell Line:human M14 melanoma cells
-
Concentration:2.5, 5, 10, 20, 30, 40 μM
-
Incubation Time:24 h; 48 h
-
Result:Inhibited M14 cell growth in a dose-dependent and time-dependent manner.
Reached IC50 values of 23.15 ± 2.42 μM after 24 h and 12.30 ± 1.67 μM after 48 h of treatment.
-
Cell Line:human M14 melanoma cells
-
Concentration:10, 20, 30, 40 μM
-
Incubation Time:48 h
-
Result:Dose-dependently reduced M14 cell migration ability, with wound gap size increasing as cardanol monoene concentration increased.
Dose-dependently down-regulated the expression levels of MMP-2 and MMP-9 proteins.
-
Cell Line:human M14 melanoma cells
-
Concentration:10, 20, 30, 40 μM
-
Incubation Time:24 h
-
Result:Induced dose-dependent S phase arrest: increased the proportion of cells in S phase from 16.1% (control) to 37.9% (40 μM).
Reduced cyclinA1 mRNA expression and increased CDK2 mRNA expression via Real Time qPCR.
-
Cell Line:human M14 melanoma cells
-
Concentration:10, 20, 30, 40, 50 μM (AO/EB, Hoechst 33258 staining); 10, 20, 30, 40 μM (Annexin V-FITC/PI staining, western blotting); 30 μM (apoptosis inhibition assay with Z-VAD-FMK (HY-16658B))
-
Incubation Time:24 h (Annexin V-FITC/PI staining, western blotting, apoptosis inhibition assay); 24 h, 48 h (AO/EB, Hoechst 33258 staining)
-
Result:Dose-dependently increased M14 cell apoptosis rate; raised the proportion of early and late apoptotic cells to 43.46% with 40 μM treatment, compared to 1.85% in the control.
Reduced cardanol monoene (30 μM)-induced M14 cell apoptosis ratio from 30.56% to 13.17% when combined with 40 μM Z-VAD-FMK.
Induced apoptotic morphological changes including nuclear condensation, bright staining, and fragmentation, which were reduced by Z-VAD-FMK treatment.
Dose-dependently up-regulated the expression of p53, cytochrome c, cleaved caspase-3, cleaved PARP, and Apaf-1, increased the Bax/Bcl-2 ratio, and down-regulated Bcl-2 expression at 20, 30, 40 μM.
Increased cytochrome c release from mitochondria to cytosol in a dose-dependent manner.
Elevated mRNA expression levels of Bax, p53, and p21, down-regulated Bcl-2 mRNA expression, and increased the Bax/Bcl-2 ratio dose-dependently via Real Time qPCR.
In Vivo
MedChemExpress (MCE) has not independently confirmed the accuracy of these methods. They are for reference only.
-
Animal Model:Artemia salina nauplii[2]
-
Dosage:1, 10, 100, 1000 ppm
-
Administration:24 h
-
Result:Showed an LC50 of 43,186.00 ± 1991.00 μg/mL.


Chemical Information
-
CAS No. 501-26-8
-
Appearance Oil
-
Molecular Weight 302.49
-
Formula C21H34O
-
Color Colorless to light yellow
-
SMILES
OC1=CC=CC(CCCCCCC/C=C\CCCCCC)=C1
-
Synonyms
Cardanol C15:1
-
Structure Classification
-
Initial Source
-
Shipping
Room temperature in continental US; may vary elsewhere.
-
Storage
Pure form -20°C 3 years 4°C 2 years In solvent -80°C 6 months -20°C 1 month


Solvent & Solubility
In Vitro:
DMSO : 100 mg/mL (330.59 mM; Need ultrasonic; Hygroscopic DMSO has a significant impact on the solubility of product, please use newly opened DMSO)
Please refer to the solubility information to select the appropriate solvent. Once prepared, please aliquot and store the solution to prevent product inactivation from repeated freeze-thaw cycles.
Storage method and period of stock solution: -80°C, 6 months; -20°C, 1 month. When stored at -80°C, please use it within 6 months. When stored at -20°C, please use it within 1 month.
Please refer to the solubility information to select the appropriate solvent. Once prepared, please aliquot and store the solution to prevent product inactivation from repeated freeze-thaw cycles.
Storage method and period of stock solution: -80°C, 6 months; -20°C, 1 month. When stored at -80°C, please use it within 6 months. When stored at -20°C, please use it within 1 month.
Concentration (start) × Volume (start) = Concentration (final) × Volume (final)
In Vivo:
Select the appropriate dissolution method based on your experimental animal and administration route.
- For the following dissolution methods, please ensure to first prepare a clear stock solution using an In Vitro approach and then sequentially add co-solvents:
- To ensure reliable experimental results, the clarified stock solution can be appropriately stored based on storage conditions. As for the working solution for In Vivo experiments, it is recommended to prepare freshly and use it on the same day.
- The percentages shown for the solvents indicate their volumetric ratio in the final prepared solution. If precipitation or phase separation occurs during preparation, heat and/or sonication can be used to aid dissolution.
Add each solvent one by one: 10% DMSO 40% PEG300 5% Tween-80 45% Saline
Solubility: ≥ 2.5 mg/mL (8.26 mM); Clear solution
This protocol yields a clear solution of ≥ 2.5 mg/mL (saturation unknown).
Taking 1 mL working solution as an example, add 100 μL DMSO stock solution (25.0 mg/mL) to 400 μL PEG300, and mix evenly; then add 50 μL Tween-80 and mix evenly; then add 450 μL Saline to adjust the volume to 1 mL.
Preparation of Saline: Dissolve 0.9 g sodium chloride in ddH₂O and dilute to 100 mL to obtain a clear Saline solution.
In Vivo Dissolution Calculator
Please enter the basic information of animal experiments:
-
-
-
-
Recommended: Prepare an additional quantity of animals to account for potential losses during experiments.
Please enter your animal formula composition:
-
%DMSO +
Recommended: Keep the proportion of DMSO in working solution below 2% if your animal is weak.
-
%+
-
+%Tween-80 + +
-
%Saline +
The co-solvents required include: DMSO, . All of co-solvents are available by MedChemExpress (MCE). , Tween 80. All of co-solvents are available by MedChemExpress (MCE).
Working solution concentration: 0.22 mg/mL
Method for preparing stock solution: mg drug dissolved in μL DMSO. Stock solution concentration: mg/mL.
1. Take μL DMSO stock solution;
2. Add μL .
μL , mix evenly;
3. Then add μL Tween 80, mix evenly;
4. Then add μL
Please ensure that the stock solution in the first step is dissolved to a clear state, and add co-solvents in sequence. You can use ultrasonic heating (ultrasonic cleaner, recommended frequency 20-40 kHz), vortexing, etc. to assist dissolution.

Protocols
-
RNA extraction experimental
By lysing cells, releasing RNA, and removing impurities such as proteins and DNA, high-purity RNA products are finally obtained. The commonly used traditional method is the guanidine isothiocyanate/phenol/chloroform method (Trizol), which is suitable for a variety of animal materials including animal tissues, microorganisms, cultured cells, etc., and most plant materials.
-
Research Protocol for Infectious Diseases
Infectious-disease experiments test how pathogens interact with host barriers, innate immune receptors, inflammatory signaling, pathogen replication, and tissue injury; pattern-recognition receptors such as TLRs, RIG-I-like receptors, NOD-like receptors, and inflammasomes detect microbial molecules and activate NF-κB, interferon, and cytokine responses. The central hypothesis is that infection severity reflects the balance between pathogen burden and host response: protective inflammation restricts pathogen growth, whereas excessive or mislocalized inflammation contributes to tissue damage and disease phenotype. Unresolved questions include which host pathways are protective versus pathogenic, why some infection models fail to translate to human disease, and which combined readouts best predict clinically relevant infection outcomes.
-
Mitochondrial membrane-potential fluorescent assay
Mitochondrial membrane potential fluorescent assays estimate ΔΨm in living cells using lipophilic cationic dyes such as TMRM, TMRE, rhodamine 123, and JC-1, which accumulate in mitochondria according to membrane polarization; loss of signal after FCCP or CCCP treatment is interpreted as mitochondrial depolarization. TMRM/TMRE and rhodamine 123 are commonly used for semi-quantitative live-cell microscopy or flow cytometry, while JC-1 can report a shift from red aggregate fluorescence to green monomer fluorescence during depolarization; interpretation requires controls because dye concentration, quenching mode, cell type, dye efflux, and mitochondrial mass can affect fluorescence independently of ΔΨm.
-
Annexin V plus membrane-impermeant dye apoptosis staining
Annexin V-based apoptosis assays rely on the detection of phosphatidylserine (PS) externalization from the inner leaflet of the plasma membrane to the outer leaflet, an early biochemical hallmark of apoptosis. Fluorescently labeled Annexin V binds PS in a calcium-dependent manner, enabling identification of early apoptotic cells by flow cytometry or fluorescence microscopy. When combined with a membrane-impermeant DNA-binding dye (e. g. , propidium iodide), this approach allows discrimination between viable (Annexin V−/dye−), early apoptotic (Annexin V+/dye−), and late apoptotic or necrotic (Annexin V+/dye+) cell populations by assessing membrane integrity and PS exposure.
-
Cell migration
Cell migration is a method that plays an important role in wound healing, cell differentiation, embryonic development, etc.
-
BrdU Incorporation Assay
Bromodeoxyuridine (BrdU) incorporation assay is based on the principle that BrdU, a thymidine analog, is incorporated into newly synthesized DNA during the S phase of the cell cycle, thereby serving as a marker of DNA replication and cellular proliferation. Incorporated BrdU can be detected using anti-BrdU antibodies following DNA denaturation, enabling visualization or quantification of proliferating cells through immunochemical detection methods such as immunofluorescence or immunohistochemistry.
-
ROS/oxidative-stress fluorescent staining
ROS/oxidative-stress fluorescent staining uses cell-permeant fluorogenic probes that become fluorescent after oxidation inside cells or tissues; commonly used examples include DCFH-DA/DCFDA for broad cellular oxidant detection, DHE for superoxide-related signal detection, MitoSOX for mitochondrial superoxide-related signal detection, and CellROX probes for oxidative-stress-associated fluorescence readouts. The assay detects probe oxidation rather than a single ROS species unless the probe and analysis method have been chemically validated for that species. DCFH-DA enters cells, is deacetylated by intracellular esterases to DCFH, and produces fluorescent DCF after oxidation, so the readout is used as an operational measure of total cellular oxidative stress rather than a species-specific ROS measurement. DHE and MitoSOX can report superoxide-related oxidation, but red fluorescence alone can include non-specific ethidium-like oxidation products; HPLC or optimized spectral approaches are
-
Protocol for Cell Cycle
Cell-cycle analysis by flow cytometry measures DNA content in single cells to estimate the fraction of cells in G0/G1, S, and G2/M phases. Propidium iodide intercalates into DNA, and after RNA removal with RNase, fluorescence intensity reflects cellular DNA content: 2N cells are assigned to G0/G1, cells between 2N and 4N to S phase, and 4N cells to G2/M. DNA-content analysis alone cannot reliably separate G0 from G1 or G2 from M. Ki-67 can distinguish quiescent G0 cells from cycling cells, EdU or BrdU incorporation marks active DNA synthesis in S phase, and phospho-histone H3 staining identifies mitotic cells within the 4N population.
-
Cell Viability Determination by MTT Colorimetric Assay
The following protocol uses the MTT colorimetric assay as a classic literature-established method for assessing cell viability/metabolic activity in cultured mammalian cells. MTT[3-(4,5-dimethylthiazol-2-yl)-2,5-diphenyltetrazolium bromide] is reduced by metabolically active cells to a colored formazan product; the amount of formazan is quantified spectrophotometrically and provides an indirect measure of metabolically active viable cells. Importantly, MTT reduction reflects cellular oxidoreductase/metabolic activity rather than an absolute direct count of living cells, so changes in cellular metabolism can alter the signal independently of cell number.
-
EdU Incorporation Assay (Click Chemistry-Based DNA Synthesis Measurement)
The EdU incorporation assay measures DNA synthesis by adding the thymidine analog 5-ethynyl-2′-deoxyuridine to cells or tissues, where it is incorporated into newly synthesized DNA during S phase. Incorporated EdU is detected by copper-catalyzed azide-alkyne cycloaddition, in which a fluorescent azide covalently reacts with the ethynyl group on EdU, allowing S-phase cells to be detected by fluorescence microscopy, flow cytometry, or high-content imaging. EdU detection does not require DNA denaturation or anti-BrdU antibody access, which preserves sample structure and improves compatibility with immunostaining and multiparameter cytometry compared with BrdU-based detection. EdU can be cytotoxic in a cell-type- and exposure-dependent manner, so pulse duration, concentration, and continuous-labeling designs should be validated for each cell type.
-
Apoptosis
Apoptosis, also called programmed cell death, is generally characterized by distinct morphological characteristics.
-
TUNEL staining for apoptotic DNA fragmentation
TUNEL staining detects DNA strand breaks by using terminal deoxynucleotidyl transferase to add labeled nucleotides to exposed 3′-OH DNA termini, generating either microscopic staining in fixed cells or tissue sections, or fluorescence/cytometric signal in cell suspensions. TUNEL positivity reflects DNA fragmentation but should not be interpreted alone as definitive apoptosis, because TUNEL can also label necrotic, autolytic, mechanically damaged, or DNA-repair-associated DNA breaks.
-
Flow cytometric DNA-content cell-cycle staining
Flow cytometric DNA-content cell-cycle staining measures the fluorescence intensity of DNA-bound fluorochromes in single cells or nuclei to estimate DNA content distributions, allowing assignment of populations to G0/G1, S, and G2/M phases by DNA histogram deconvolution. Propidium iodide (PI) intercalates into DNA, and PI fluorescence is proportional to cellular DNA content when staining is performed under conditions that make DNA accessible and minimize non-DNA signal. Cells with G2/M DNA content are expected to show approximately twice the fluorescence intensity of G0/G1 cells, while S-phase cells occupy intermediate fluorescence values. PI-based DNA-content analysis can also detect cells with fractional DNA content, often reported as sub-G1, when DNA fragmentation and extraction during staining reduce retained DNA signal in apoptotic cells. DAPI is an alternative DNA fluorochrome for univariate DNA-content analysis, while bivariate approaches combining DNA content with proliferation
-
Mitochondrial membrane-potential and mitochondrial mass staining
Mitochondrial membrane potential staining measures the electrochemical polarization across the mitochondrial inner membrane in live cells using lipophilic cationic fluorescent probes; early rhodamine-based work showed that selective mitochondrial dye accumulation is lost when the mitochondrial transmembrane potential is dissipated. JC-1 reports mitochondrial polarization by shifting from green monomer fluorescence to red J-aggregate fluorescence as dye concentration increases within energized mitochondria; therefore, the red/green fluorescence ratio is used as a relative readout of mitochondrial membrane potential. TMRE or TMRM staining provides a single-channel relative readout because these cationic rhodamine esters accumulate in polarized mitochondria, and lower fluorescence indicates reduced mitochondrial polarization when acquisition and dye-loading conditions are controlled. Mitochondrial mass staining is commonly performed with MitoTracker Green FM or related MitoTracker dyes as
-
Apoptosis Solutions
Apoptosis is a regulated, generally non-lytic cell-death pathway that removes unwanted, damaged, infected, or abnormal cells through coordinated morphological changes, caspase activation, DNA fragmentation, and membrane remodeling. The intrinsic apoptosis pathway is controlled mainly by mitochondrial outer membrane permeabilization, BCL-2 family proteins, cytochrome c release, apoptosome formation, caspase-9 activation, and downstream executioner caspase-3/7 activation. The extrinsic apoptosis pathway is initiated by death receptors such as Fas, TNFR, and TRAIL receptors, which recruit adaptor proteins and activate caspase-8 before engaging executioner caspases or mitochondrial amplification through BID cleavage. Apoptosis is linked to many phenotypes, including cancer cell killing, tissue homeostasis, immune regulation, neurodegeneration, infection response, and treatment-induced cytotoxicity; unresolved questions include how apoptosis interacts with necroptosis, pyroptosis, ferroptos


Purity & Documentation
-
Data Sheet (274 KB)
-
SDS (254 KB)
- English - EN (254 KB)
- Français - FR (254 KB)
- Deutsch - DE (254 KB)
- Norwegian - NO (254 KB)
- Español - ES (254 KB)
- Swedish - SV (254 KB)
- Italian - IT (254 KB)
- Korean - KR (254 KB)
- Portuguese - PT (254 KB)
-
Handling Instructions (2659 KB)
References
[1]. Su WC, et al. Mitochondria-Associated Apoptosis in Human Melanoma Cells Induced by Cardanol Monoene from Cashew Nut Shell Liquid. J Agric Food Chem. 2017;65(28):5620-5631. [Content Brief]
[2]. Rodrigues Valério RB, et al. Unsaturation-Driven Modulation of Antioxidant and Acetylcholinesterase Inhibitory Activities of Cardanol Derivatives. Bioengineering (Basel). 2025;12(12):1316. Published 2025 Dec 1. [Content Brief]


Complete Stock Solution Preparation Table
Please refer to the solubility information to select the appropriate solvent. Once prepared, please aliquot and store the solution to prevent product inactivation from repeated freeze-thaw cycles.
Storage method and period of stock solution: -80°C, 6 months; -20°C, 1 month. When stored at -80°C, please use it within 6 months. When stored at -20°C, please use it within 1 month.
| Optional Solvent | Concentration Solvent Mass | 1 mg | 5 mg | 10 mg | 25 mg |
|---|---|---|---|---|---|
| DMSO | 1 mM | 3.3059 mL | 16.5295 mL | 33.0589 mL | 82.6474 mL |
| 5 mM | 0.6612 mL | 3.3059 mL | 6.6118 mL | 16.5295 mL | |
| 10 mM | 0.3306 mL | 1.6529 mL | 3.3059 mL | 8.2647 mL | |
| 15 mM | 0.2204 mL | 1.1020 mL | 2.2039 mL | 5.5098 mL | |
| 20 mM | 0.1653 mL | 0.8265 mL | 1.6529 mL | 4.1324 mL | |
| 25 mM | 0.1322 mL | 0.6612 mL | 1.3224 mL | 3.3059 mL | |
| 30 mM | 0.1102 mL | 0.5510 mL | 1.1020 mL | 2.7549 mL | |
| 40 mM | 0.0826 mL | 0.4132 mL | 0.8265 mL | 2.0662 mL | |
| 50 mM | 0.0661 mL | 0.3306 mL | 0.6612 mL | 1.6529 mL | |
| 60 mM | 0.0551 mL | 0.2755 mL | 0.5510 mL | 1.3775 mL | |
| 80 mM | 0.0413 mL | 0.2066 mL | 0.4132 mL | 1.0331 mL | |
| 100 mM | 0.0331 mL | 0.1653 mL | 0.3306 mL | 0.8265 mL |


Cardanol monoene Related Classifications
HY-119979 Related Classifications
 Powered by Bioz
Keywords