



Flavokawain C
Based on 4 publication(s) in Google Scholar
Flavokawain C is an orally active natural chalcone. Flavokawain C inhibits the proliferation of various cancer cells. Flavokawain C upregulates GADD153 in cancer cells, inhibits the phosphorylation of Akt and JNK, suppresses early ERK phosphorylation, activates late ERK phosphorylation, activates caspase related subtypes, induces PARP-1 cleavage, causes upregulation of p21 and p27, downregulation of mutant p53 and anti-apoptotic IAP proteins, elevates intracellular ROS levels, reduces SOD activity, and induces apoptosis. Flavokawain C downregulates FABP4, induces autophagy in cancer cells, and activates the AMPK/mTOR pathway. Flavokawain C decreases the expression of glycolysis-related proteins GLUT1 and HK2, and inhibits glycolysis in nasopharyngeal carcinoma cells. Flavokawain C inhibits the activation of the EGFR/PI3K/Akt/mTOR signaling pathway and reduces the expression of HSP90B1. Flavokawain C inhibits angiogenesis by decreasing the expression of angiogenic proteins Ang-1 and VEGF in human umbilical vein endothelial cells. Flavokawain C increases γ-H2AX levels in cells, inhibits the phosphorylation of FAK, PI3K and AKT in cells, and induces DNA damage in cells. Flavokawain C exerts anti-tumor activity in multiple tumor xenograft mouse models. Flavokawain C is applicable to research related to colorectal cancer, colon adenocarcinoma, nephroblastoma, nasopharyngeal carcinoma and liver cancer.
For research use only. We do not sell to patients.
- Purity : 99.53%
- CAS No.: 37308-75-1
- Formula: C17H16O5
- Molecular Weight:300.31
-
Storage:
4°C, protect from light
* The compound is unstable in solutions, freshly prepared is recommended.

To place orders, for customer services and technical support, please contact: MedChemExpress USA
Tel: 609-228-6898 E-mail: [email protected] [email protected]


-
 Biological Activity
-
Chemical Information
-
Solvent & Solubility
- Protocols
- Purity & Documentation
- References
-
 Help & FAQs


-
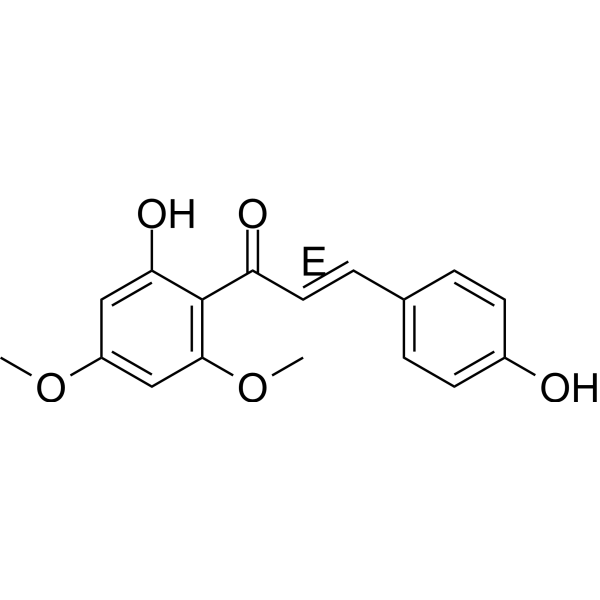
HY-N2420
Flavokawain AAnti-tumor Agent -
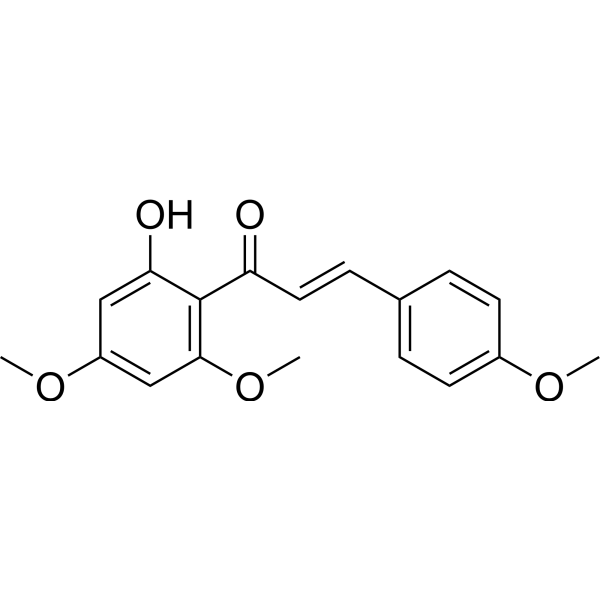
HY-N1378
(E)-CardamoninhTRPA1 Antagonist -
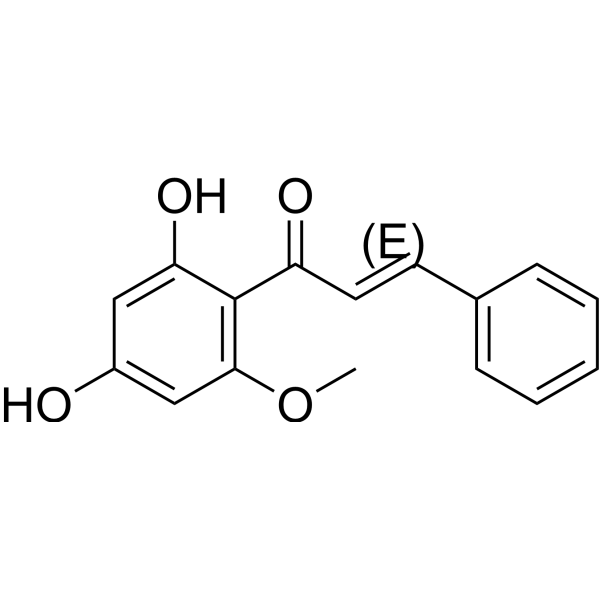
HY-N2132
Flavokawain BAnti-tumor Agent -
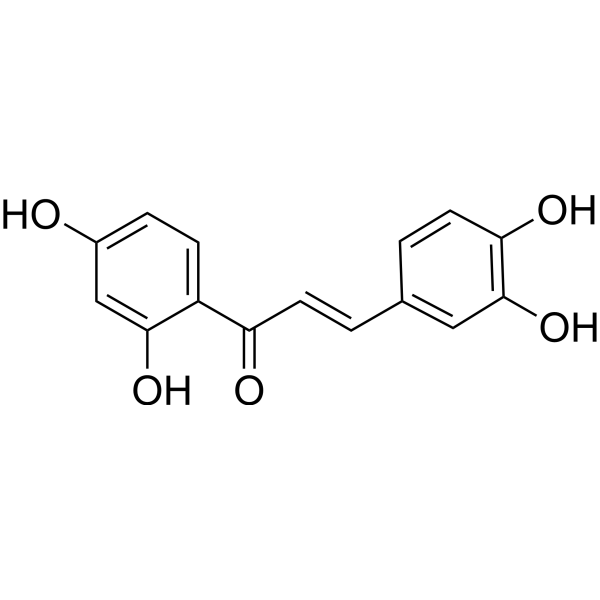
HY-16558
ButeinEGFR/PDE Inhibitor -
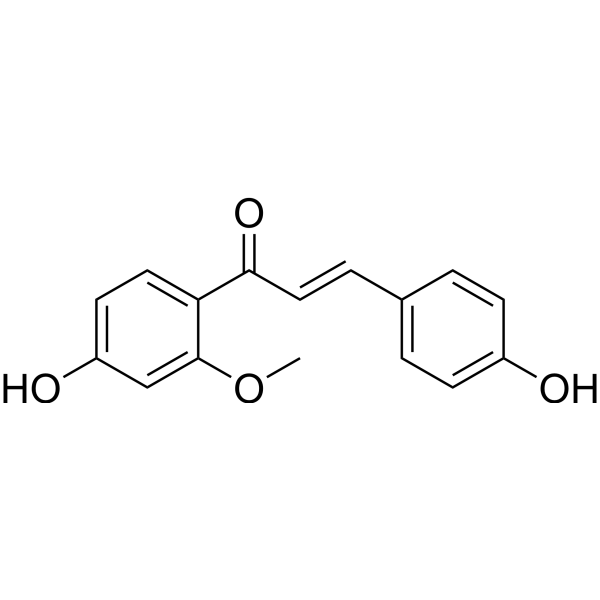
HY-N1745
2'-O-MethylisoliquiritigeninGABA Receptor Activator -
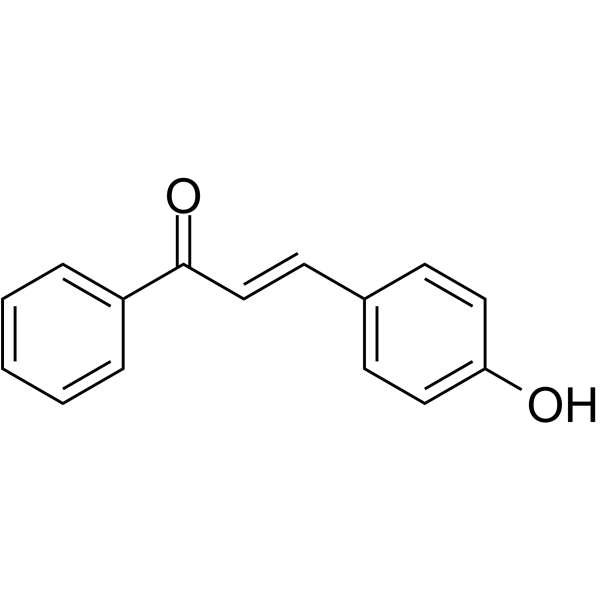
HY-107818
4-HydroxychalconeAkt/ERK-1/-2 Inhibitor -
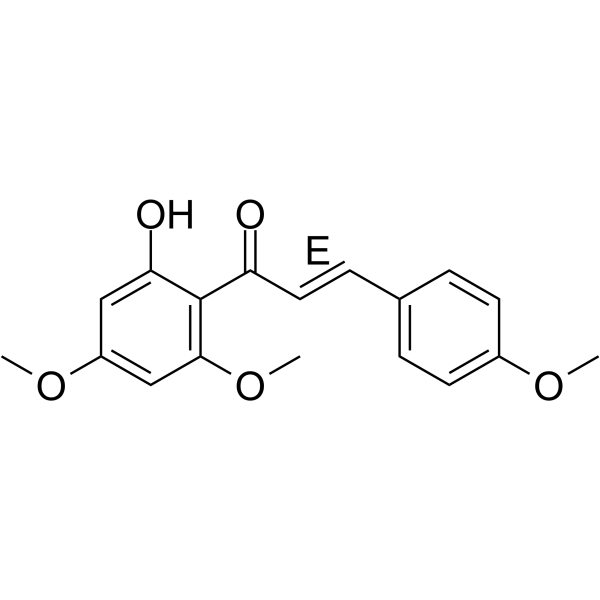
HY-N5106
(E)-Flavokawain AApoptosis Inducer -
HY-N7056
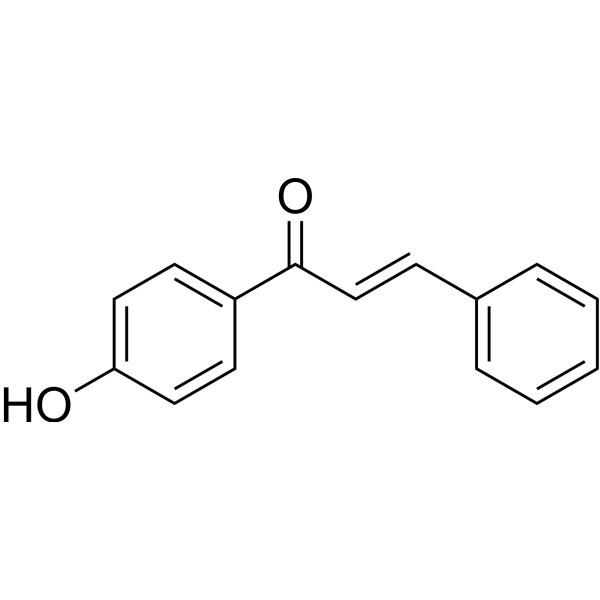
4'-HydroxychalconeChalcone -
HY-N7516
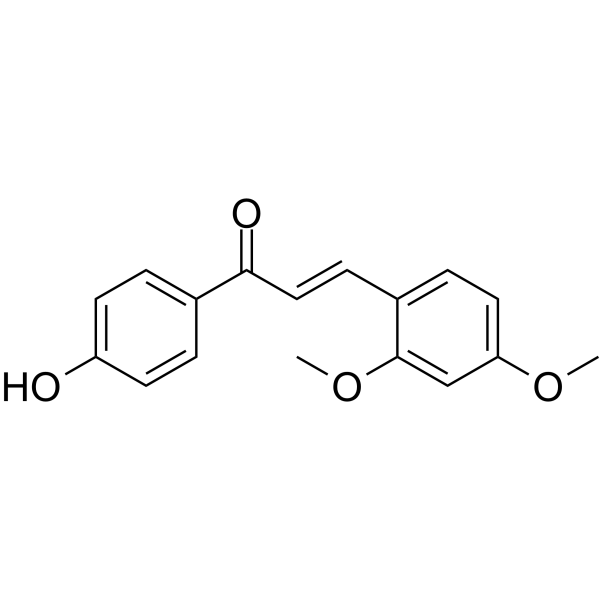
4'-Hydroxy-2,4-dimethoxychalconeChalcone Derivative -

HY-N2445R
Flavokawain C (Standard)Apoptosis Inducer -

HY-N1378R
(E)-Cardamonin (Standard)hTRPA1 Antagonist
Publications Citing Use of MedChemExpress (MCE) Flavokawain C
More Customer Validation & Images

-
Cell Proliferation/Viability Assay
-
Cell Proliferation/Viability Assay
-
WB
-
Cell Migration/Invasion Assay
-
Cell Autophagy Assay
All Caspase Isoforms
MoreAll AMPK Isoforms
MoreAll EGFR Isoforms
MoreAll VEGFR Isoforms
More

Biological Activity
Description
Cellular Effect
|
Cell Line

|
Type | Value | Description | References |
|---|---|---|---|---|
| A549 | IC50 |
8.1 μg/mL
Compound: Flavokawain C
|
Inhibition of TNF-alpha-induced NF-kappaB expressed in human A549 cells treated 1 hr after TNFalpha challenge measured after 6 hrs by luciferase reporter gene assay
Inhibition of TNF-alpha-induced NF-kappaB expressed in human A549 cells treated 1 hr after TNFalpha challenge measured after 6 hrs by luciferase reporter gene assay
|
[PMID: 19716299] |
| B16-F10 | IC50 |
6.9 μM
Compound: 1d
|
Antimelanogenic activity in mouse B16F10 cells assessed as inhibition of melanin production after 4 days
Antimelanogenic activity in mouse B16F10 cells assessed as inhibition of melanin production after 4 days
|
[PMID: 25597012] |
| HeLa | IC50 |
19.2 μM
Compound: 5, flavokawin
|
Cytotoxicity against human HeLa cells by MTT assay after 72 hrs
Cytotoxicity against human HeLa cells by MTT assay after 72 hrs
|
[PMID: 18611049] |
| K562 | IC50 |
8 μM
Compound: Flavokawain C
|
Inhibition of NF-kappaB transactivation in TNF-alpha-stimulated human K562 cells preincubated for 2 hrs followed by TNF-alpha challenge measured after 6 hrs by dual luciferase reporter gene assay
Inhibition of NF-kappaB transactivation in TNF-alpha-stimulated human K562 cells preincubated for 2 hrs followed by TNF-alpha challenge measured after 6 hrs by dual luciferase reporter gene assay
|
[PMID: 24775915] |
| NIH3T3 | IC50 |
3.1 μM
Compound: 2c
|
Inhibition of cobalt chloride-induced HIF-1 activation expressed in mouse NIH3T3 cells after 8 hrs by luciferase reporter gene assay
Inhibition of cobalt chloride-induced HIF-1 activation expressed in mouse NIH3T3 cells after 8 hrs by luciferase reporter gene assay
|
[PMID: 21112783] |
In Vitro
Flavokawain C (60 μM; 6-48 h) upregulates the endoplasmic reticulum stress marker GADD153, inhibits Akt phosphorylation, suppresses early ERK phosphorylation and late JNK phosphorylation, and activates late ERK phosphorylation in HCT 116 cells[1].
Flavokawain C (40-80 μM; 6-72 h) reduces the viability of HT-29 cells, induces apoptotic morphological and nuclear changes, triggers DNA fragmentation, increases the proportion of apoptotic cells, decreases mitochondrial membrane potential, and induces G2/M cell cycle arrest[2].
Flavokawain C (40-80 μM; 0-48 h) activates caspase-3, -8, and -9, induces PARP-1 cleavage, triggers p53-independent upregulation of p21 and p27, downregulation of mutant p53, upregulation of the endoplasmic reticulum stress marker GADD153, and downregulation of anti-apoptotic IAP proteins (XIAP, c-IAP1, c-IAP2), increases intracellular ROS levels, and decreases SOD activity in HT-29 cells[2].
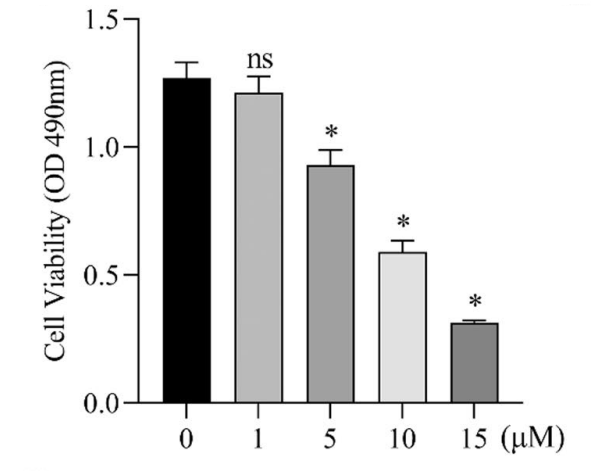
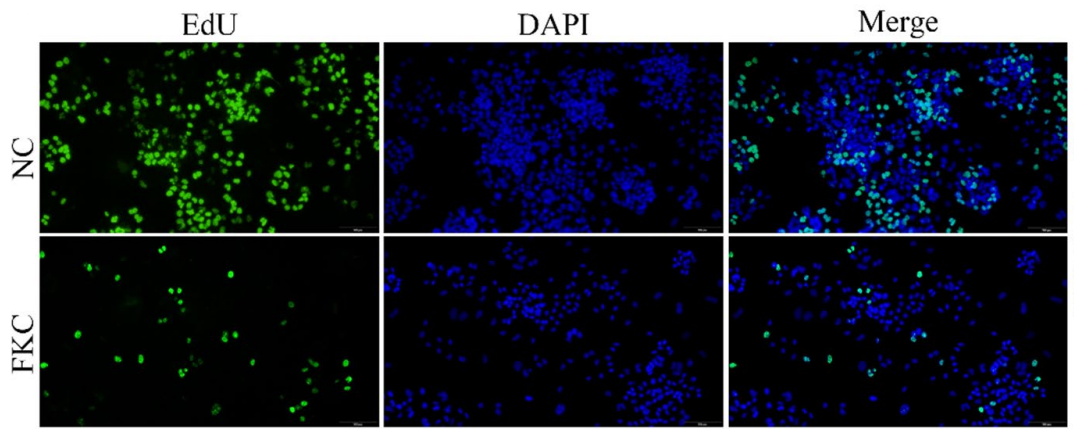
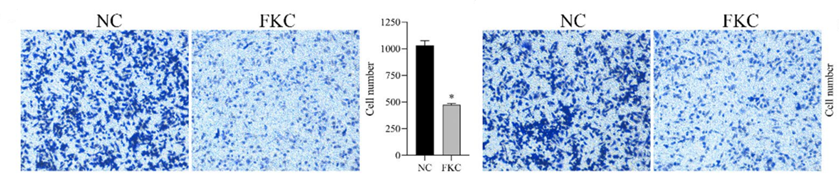
Flavokawain C (1-15 μM; 24-72 h) inhibits the viability and proliferation of G401 cells, suppresses their colony-forming ability, and inhibits cell migration and invasion[3].
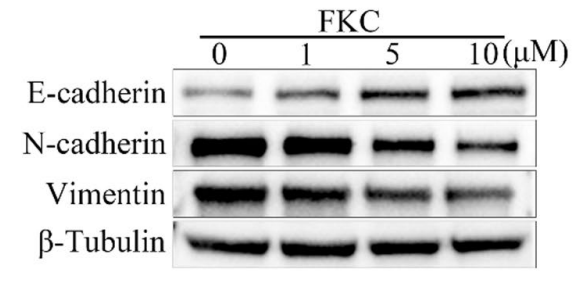
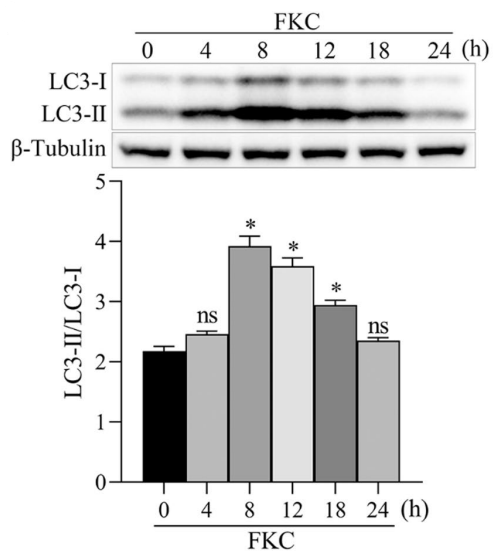
Flavokawain C (1-10 μM; 0-24 h) regulates the expression of EMT markers, downregulates FABP4, induces complete autophagic flux, and activates the AMPK/mTOR pathway in G401 cells[3].
Flavokawain C (0.5-4 μM; 48 h) inhibits the proliferation of human nasopharyngeal carcinoma HNE1 and CNE2 cells and increases the apoptotic rate of these cells[4].
Flavokawain C (4 μM; 48 h) inhibits glycolysis in human nasopharyngeal carcinoma HNE1 and CNE2 cells by reducing the extracellular acidification rate, glucose consumption and lactate production, as well as downregulating the expression of glycolysis-related proteins GLUT1 and HK2[4].
Flavokawain C (4 μM; 48 h) inhibits the activation of the EGFR/PI3K/Akt/mTOR signaling pathway and reduces the expression of HSP90B1 in human nasopharyngeal carcinoma HNE1 and CNE2 cells[4].
Flavokawain C (4 μM; 48 h) inhibits angiogenesis in human nasopharyngeal carcinoma HNE1 and CNE2 cells by impairing the tube formation and migration capacities of human umbilical vein endothelial cells (HUVECs) and reducing the expression of angiogenic proteins Ang-1 and VEGF in HUVECs[4].
Flavokawain C (48 h) selectively inhibits the viability of Huh-7, Hep3B and HepG2 hepatocellular carcinoma cells, with IC50 values ranging from 23.42 μM to 30.71 μM; while it exhibits low toxicity to normal MIHA hepatocytes, with an IC50 of 53.95 μM[5].
Flavokawain C (2.0-8.0 μM; 2 weeks) inhibits colony formation of Huh-7, Hep3B and HepG2 hepatocellular carcinoma cells[5].
Flavokawain C (4.0-16.0 μM; 48 h) inhibits DNA replication, induces apoptosis, downregulates the expression of anti-apoptotic protein Bcl2, upregulates the expression of pro-apoptotic protein Bax, and promotes apoptosis by reducing the Bcl2/Bax ratio in Huh-7 and Hep3B hepatocellular carcinoma cells[5].
Flavokawain C (4.0-16.0 μM; 48 h) increases the level of γ-H2AX, a marker of DNA damage response, in Huh-7 and Hep3B cells, inhibits the phosphorylation of FAK, PI3K and AKT in cells, and induces DNA damage[5].
Flavokawain C (4.0-16.0 μM; 48 h) reduces extracellular matrix adhesion of Huh-7 and Hep3B cells and inhibits cell migration[5].
MedChemExpress (MCE) has not independently confirmed the accuracy of these methods. They are for reference only. Further protocols information, click here.
-
Cell Line:HCT 116 human colon carcinoma cells
-
Concentration:60 μM
-
Incubation Time:6, 12, 18, 24, 48 h
-
Result:Induced time-dependent upregulation of GADD153 protein levels.
Showed no GADD153 expression was detected in untreated control cells.\nCaused a transient increase in phosphorylated Akt levels at 6 hours.
Induced time-dependent decrease in phosphorylated Akt levels through 48 hours.
Showed no significant changes in total Akt protein levels were observed.\nCaused time-dependent decreases in phosphorylated ERK levels at 6, 12, and 18 hours.
Induced dramatic increases in phosphorylated ERK levels at 24 and 48 hours.
Showed total ERK levels remained unchanged.
Caused small reductions in phosphorylated JNK levels at 24 and 48 hours.
Showed no significant changes in total JNK, phosphorylated p38, or total p38 levels.
-
Cell Line:human colon adenocarcinoma HT-29 cells
-
Concentration:40, 60, 80 μM
-
Incubation Time:0, 6, 12, 24, 48, 72 h
-
Result:Reduced HT-29 cell viability in a dose- and time-dependent manner.
Decreased cell viability from 644.51% (control) to 185.17%, 111.81%, and 104.94% at 40, 60, and 80 μM respectively after 72 h.
Showed comparable inhibitory effect between 60 and 80 μM.
-
Cell Line:human colon adenocarcinoma HT-29 cells
-
Concentration:40, 60, 80 μM
-
Incubation Time:48 h
-
Result:Induced dose-dependent apoptotic morphological changes, including cell shrinkage, surface blebbing, cytoplasmic vacuolation, chromatin condensation/fragmentation, and late apoptotic cells (pink fluorescence from propidium iodide staining).\nCaused a concentration-dependent increase in DNA fragmentation.
Increased TUNEL-positive cells to 11.6% at 80 μM relative to control.
-
Cell Line:human colon adenocarcinoma HT-29 cells
-
Concentration:40-80 μM
-
Incubation Time:24-48 h
-
Result:Caused a dose- and time-dependent increase in Annexin V-FITC-positive apoptotic cells.
-
Cell Line:human colon adenocarcinoma HT-29 cells
-
Concentration:40-80 μM
-
Incubation Time:24-48 h
-
Result:At 24 h, dose-dependently increased G2/M phase cell population (with a small G1 phase accumulation) and decreased S phase population.
At 48 h, caused a marked dose-dependent increase in G2/M phase cell population, with the highest increase at 80 μM.
-
Cell Line:G401 nephroblastoma cells
-
Concentration:10 μM
-
Incubation Time:12 h
-
Result:Increased the number of both yellow (autophagosomes) and red (autolysosomes) puncta per cell compared to control, indicating enhanced autophagic initiation and maturation.
-
Cell Line:Huh-7, Hep3B
-
Concentration:4.0 μM, 8.0 μM, 16.0 μM
-
Incubation Time:48 h
-
Result:Dose-dependently increased the number of 53BP1 foci (a marker of DNA damage response) in both cell lines.
Increased average 53BP1 foci per cell to >15 in both cell lines at 16.0 μM, compared to ~1.5 foci per cell in untreated controls.
In Vivo
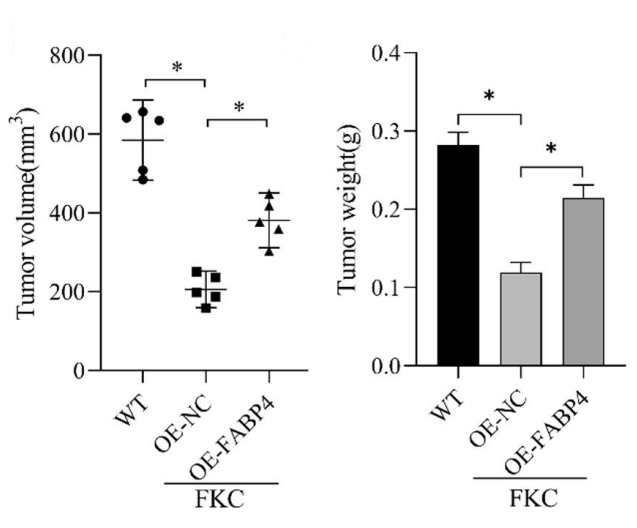
Flavokawain C (3 mg/kg; i.p.; 4 weeks (subcutaneous tumor model); 8 weeks (liver metastasis model)) reduces subcutaneous nasopharyngeal carcinoma tumor volume and weight, inhibits liver metastasis, and downregulates glycolysis, angiogenesis, and EGFR/PI3K/Akt/mTOR pathway activation in vivo, with effects enhanced by HSP90B1 knockdown and reversed by HSP90B1 overexpression[4].
Flavokawain C (16 mg/kg; i.p.; daily; 14 days) significantly inhibits Huh-7 liver cancer xenograft growth in nude mice without causing notable body weight loss, via reduced tumor cell proliferation and induced DNA damage[5].
Flavokawain C (1-3 mg/kg; i.p.; thrice weekly; 19 days) dose-dependently inhibits HCT 116 colon carcinoma xenograft growth in BALB/c nude mice, with the 3 mg/kg dose achieving up to 52.17% tumor volume inhibition, via induction of apoptosis and reduction of cell proliferation, without causing significant organ toxicity[6].
MedChemExpress (MCE) has not independently confirmed the accuracy of these methods. They are for reference only.
-
Animal Model:BALB/c nude (5-week-old male, weight range 19.0g to 22.3g at euthanasia, subcutaneous nephroblastoma xenograft model)[3]
-
Dosage:3 mg/kg
-
Administration:i.p.; thrice weekly; 4 weeks
-
Result:Significantly reduced tumor volume and tumor weight compared to the control group.
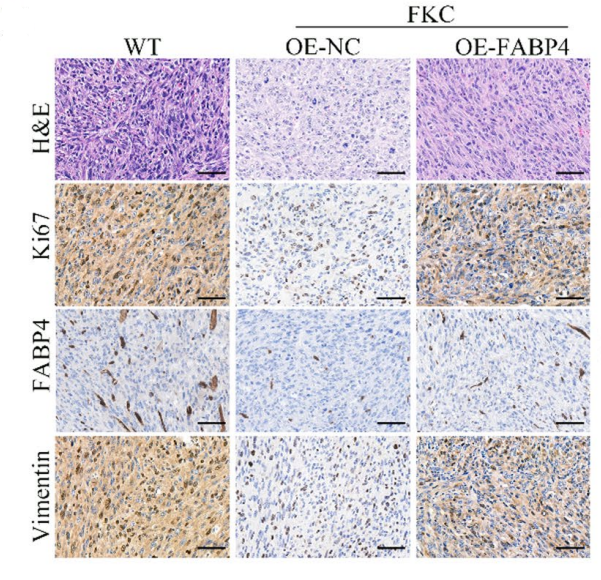
Reduced expression of Ki67, FABP4, and Vimentin in tumor tissues.
Increased expression of E-cadherin in tumor tissues.
Induced loose tumor structure and increased inflammatory cell infiltration in tumor samples.
Had its tumor growth inhibition effect partially reversed by FABP4 overexpression.
-
Animal Model:BALB/C nude (male, 5-6 weeks old)[4]
-
Dosage:3 mg/kg
-
Administration:i.p.; 4 weeks (subcutaneous tumor model); 8 weeks (liver metastasis model)
-
Result:Reduced subcutaneous tumor volume and weight compared to vehicle control.
Downregulated the expression of HSP90B1, GLUT1, HK2, Ang-1, and VEGF in tumor tissues.
Inhibited the phosphorylation of EGFR, PI3K, Akt, and mTOR in tumor tissues.
Inhibited liver metastasis of NPC tumors, as measured by reduced bioluminescence signal from luciferase-expressing tumor cells.
Enhanced inhibitory effect on tumor growth and pathway suppression was observed with HSP90B1 knockdown.
Reversed inhibitory effect on tumor growth and pathway suppression was observed with HSP90B1 overexpression.
-
Animal Model:BALB/c nude mice (6-week-old)[5]
-
Dosage:16 mg/kg
-
Administration:i.p.; daily; 14 days
-
Result:Significantly reduced tumor growth rate, final tumor volume, and final tumor weight relative to controls.
Caused no significant changes in mouse body weight during treatment.
Induced cytoplasmic-nuclear separation and nuclear fragmentation (cell death) in tumor tissues via H&E staining.
Reduced Ki67 (proliferation marker) levels in treated tumor tissues.
Increased γ-H2AX (DNA damage marker) levels in treated tumor tissues.
-
Animal Model:BALB/c nude (female, 6 weeks old)[6]
-
Dosage:1 mg/kg; 3 mg/kg
-
Administration:i.p.; thrice weekly; 19 days
-
Result:Reduced final mean tumor volume to 658.19 mm3 (600% growth from initial 84.48 mm3) with 18.73-23.99% tumor volume inhibition (%T/C) over days 3-19 at 1 mg/kg.
Reduced final mean tumor volume to 411.31 mm3 (300% growth from initial 86.56 mm3) with 23.43-52.17% tumor volume inhibition (%T/C) over days 3-19 at 3 mg/kg.
Increased tumor necrotic area significantly (p < 0.05 vs control) at 3 mg/kg.
Increased TUNEL-positive cells significantly (p < 0.05 vs control) at 3 mg/kg.
Increased cleaved caspase-3 immunoreactivity score significantly (p < 0.05 vs control) at 3 mg/kg.
Decreased Ki67 immunoreactivity score significantly (p < 0.05 vs control) at 3 mg/kg.
Up-regulated Ig mu chain C region (secreted form) and down-regulated GRP78, hemopexin, kininogen-1, and apolipoprotein E compared to vehicle controls, with levels returning to near normal ranges at 3 mg/kg.
Caused no significant body weight loss in either dose group; kept serum liver (AST, ALT, ALP) and kidney (creatine, urea) function parameters within normal limits, with only mild urea elevation in the 1 mg/kg group; caused no pathological damage to major organs (heart, spleen, liver, lungs, kidneys).


Chemical Information
-
CAS No. 37308-75-1
-
Appearance Solid
-
Molecular Weight 300.31
-
Formula C17H16O5
-
Color Light yellow to orange
-
SMILES
O=C(C1=C(OC)C=C(OC)C=C1O)/C=C/C2=CC=C(O)C=C2
-
Structure Classification
-
Initial Source
-
Shipping
Room temperature in continental US; may vary elsewhere.
-
Storage
4°C, protect from light
* The compound is unstable in solutions, freshly prepared is recommended.


Publications (4)
-
Journal Impact Factor
-
Most Recent
-
Phytomedicine
The kava chalcone flavokawain B exerts inhibitory activity and synergizes with BCL-2 inhibition in malignant B-cell lymphoma. [Abstract]2023 Nov:120:155074. PMID: 37716033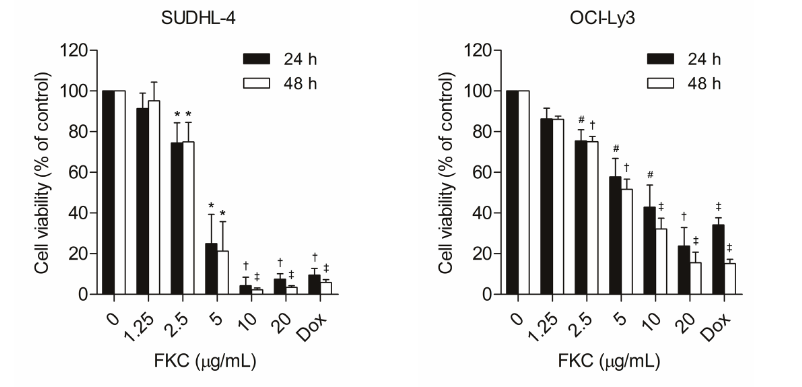
Flavokawain C purchased from MedChemExpress. Usage Cited in: Phytomedicine. 2023 Nov:120:155074. [Abstract]
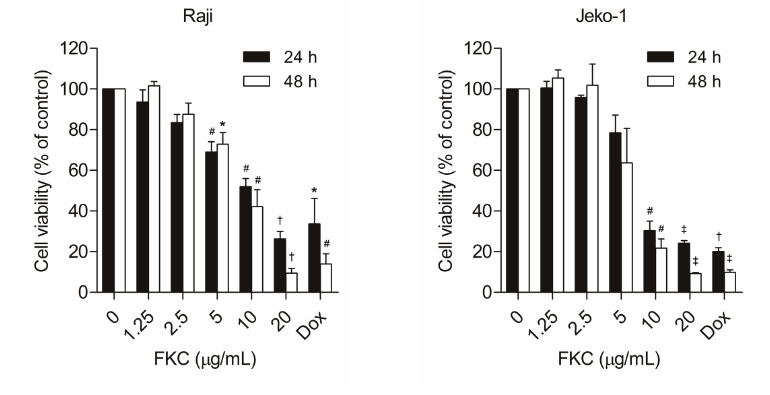
SUDHL-4 and OCI-Ly3 cells were treated with FKC (Flavokawain C; HY-N2445; 1.25-20 µg/mL) or Doxorubicin (HY-15142A; 10 µM) for 24 and 48 h. Cell viability was measured using the MTS assay. *P < 0.05, #P < 0.01, †P < 0.001, and ‡P < 0.0001 versus control at corresponding time points.SUDHL-4 (A), OCI-Ly3 (B), Raji (C), and Jeko-1 (D) cells were treated with FKA (1.25-20 µg/mL) or doxorubicin (10 µM) for 24 and 48 h. Cell viability was measured using the MTS assay. *P < 0.05, #P < 0.01, †P < 0.001, and ‡P < 0.0001 versus control at corresponding time points.
Flavokawain C purchased from MedChemExpress. Usage Cited in: Phytomedicine. 2023 Nov:120:155074. [Abstract]
Raji and Jeko-1 cells were treated with FKC (Flavokawain C; HY-N2445; 1.25-20 µg/mL) or Doxorubicin (HY-15142A; 10 µM) for 24 and 48 h. Cell viability was measured using the MTS assay. *P < 0.05, #P < 0.01, †P < 0.001, and ‡P < 0.0001 versus control at corresponding time points.SUDHL-4 (A), OCI-Ly3 (B), Raji (C), and Jeko-1 (D) cells were treated with FKA (1.25-20 µg/mL) or doxorubicin (10 µM) for 24 and 48 h. Cell viability was measured using the MTS assay. *P < 0.05, #P < 0.01, †P < 0.001, and ‡P < 0.0001 versus control at corresponding time points.
-
Food Chem
Effects of sun drying combined with baking processes on the flavor quality of Chongqing Tuocha raw tea. [Abstract]2025 Dec 30:497:146992. PMID: 41285060 -
Food Chem
Flavonoid-mediated metabolic underpinning quality variation in red bud-sport pear mutants. [Abstract]2025 Oct 15:489:144992. PMID: 40466530 -
Sci Rep
Flavokawain C suppresses nephroblastoma growth by inducing autophagy-mediated downregulation of FABP4 via AMPK/mTOR pathway. [Abstract]2026 Mar 4. PMID: 41781551
Flavokawain C purchased from MedChemExpress. Usage Cited in: Sci Rep. 2026 Mar 4. [Abstract]
FKC (Flavokawain C) inhibited the growth of G401 cells. The cell viability of G401 treated with different concentrations of FKC (0, 1, 5, 10, and 15 μM) was detected by CCK-8 assay.
Flavokawain C purchased from MedChemExpress. Usage Cited in: Sci Rep. 2026 Mar 4. [Abstract]
The proliferation of G401 cells treated with or without FKC (Flavokawain C; 10 μM) was examined by EdU assay.
Flavokawain C purchased from MedChemExpress. Usage Cited in: Sci Rep. 2026 Mar 4. [Abstract]
G401 cells were treated with different concentrations of FKC (Flavokawain C; 0, 1, 5, and 10 μM), and the expression of epithelial-mesenchymal transition (EMT) markers was detected by western blot analysis.
Flavokawain C purchased from MedChemExpress. Usage Cited in: Sci Rep. 2026 Mar 4. [Abstract]
The inhibitory effect of FKC (Flavokawain C; 10 μM) on the migration and invasion of G401 cells was detected by transwell assay. The bar graphs show the relative protein expression levels normalized to β-tubulin.
Flavokawain C purchased from MedChemExpress. Usage Cited in: Sci Rep. 2026 Mar 4. [Abstract]
FKC (Flavokawain C) induced autophagy in G401 cells. G401 cells were treated with 10 μM FKC for different time (0, 4, 8, 12, 18, and 24 h), and the expression of LC3 was detected by western blot.
Flavokawain C purchased from MedChemExpress. Usage Cited in: Sci Rep. 2026 Mar 4. [Abstract]
FKC (Flavokawain C) inhibited the growth and metastasis of nephroblastoma in vivo. Nude mice were subcutaneously injected with normal and oeNC or oeFABP4 infected G401 cells. One week after cell injection, mice in the treatment group were intraperitoneally administered 3 mg/kg FKC thrice a week for 4 weeks; control mice received the same volume of normal saline. The value of tumor volume and weight was quantified in each group.
Flavokawain C purchased from MedChemExpress. Usage Cited in: Sci Rep. 2026 Mar 4. [Abstract]
FKC (Flavokawain C) inhibited the growth and metastasis of nephroblastoma in vivo. Nude mice were subcutaneously injected with normal and oeNC or oeFABP4 infected G401 cells. One week after cell injection, mice in the treatment group were intraperitoneally administered 3 mg/kg FKC thrice a week for 4 weeks; control mice received the same volume of normal saline. Tumor tissue sections stained with hematoxylin–eosin, the expression of Ki67, FABP4 and Vimentin by immunohistochemistry.


Solvent & Solubility
In Vitro:
DMSO : 125 mg/mL (416.24 mM; Need ultrasonic; Hygroscopic DMSO has a significant impact on the solubility of product, please use newly opened DMSO)
Please refer to the solubility information to select the appropriate solvent. The compound is unstable in solutions, freshly prepared is recommended.
Please refer to the solubility information to select the appropriate solvent. The compound is unstable in solutions, freshly prepared is recommended.
Concentration (start) × Volume (start) = Concentration (final) × Volume (final)
In Vivo:
Select the appropriate dissolution method based on your experimental animal and administration route.
- For the following dissolution methods, please ensure to first prepare a clear stock solution using an In Vitro approach and then sequentially add co-solvents:
- To ensure reliable experimental results, the clarified stock solution can be appropriately stored based on storage conditions. As for the working solution for In Vivo experiments, it is recommended to prepare freshly and use it on the same day.
- The percentages shown for the solvents indicate their volumetric ratio in the final prepared solution. If precipitation or phase separation occurs during preparation, heat and/or sonication can be used to aid dissolution.
Add each solvent one by one: 10% DMSO 40% PEG300 5% Tween-80 45% Saline
Solubility: ≥ 1.25 mg/mL (4.16 mM); Clear solution
This protocol yields a clear solution of ≥ 1.25 mg/mL (saturation unknown).
Taking 1 mL working solution as an example, add 100 μL DMSO stock solution (12.5 mg/mL) to 400 μL PEG300, and mix evenly; then add 50 μL Tween-80 and mix evenly; then add 450 μL Saline to adjust the volume to 1 mL.
Preparation of Saline: Dissolve 0.9 g sodium chloride in ddH₂O and dilute to 100 mL to obtain a clear Saline solution.
Add each solvent one by one: 10% DMSO 90% (20% SBE-β-CD in Saline)
Solubility: ≥ 1.25 mg/mL (4.16 mM); Clear solution
This protocol yields a clear solution of ≥ 1.25 mg/mL (saturation unknown).
Taking 1 mL working solution as an example, add 100 μL DMSO stock solution (12.5 mg/mL) to 900 μL 20% SBE-β-CD in Saline, and mix evenly.
Preparation of 20% SBE-β-CD in Saline (4°C, storage for one week): 2 g SBE-β-CD powder is dissolved in 10 mL Saline, completely dissolve until clear.
In Vivo Dissolution Calculator
Please enter the basic information of animal experiments:
-
-
-
-
Recommended: Prepare an additional quantity of animals to account for potential losses during experiments.
Please enter your animal formula composition:
-
%DMSO +
Recommended: Keep the proportion of DMSO in working solution below 2% if your animal is weak.
-
%+
-
+%Tween-80 + +
-
%Saline +
The co-solvents required include: DMSO, . All of co-solvents are available by MedChemExpress (MCE). , Tween 80. All of co-solvents are available by MedChemExpress (MCE).
Working solution concentration: 0.22 mg/mL
Method for preparing stock solution: mg drug dissolved in μL DMSO. Stock solution concentration: mg/mL. * The compound is unstable in solutions, freshly prepared is recommended.
1. Take μL DMSO stock solution;
2. Add μL .
μL , mix evenly;
3. Then add μL Tween 80, mix evenly;
4. Then add μL
Please ensure that the stock solution in the first step is dissolved to a clear state, and add co-solvents in sequence. You can use ultrasonic heating (ultrasonic cleaner, recommended frequency 20-40 kHz), vortexing, etc. to assist dissolution.

Protocols
-
Western Blot
Western blotting (WB) is a commonly used experimental method in molecular biology, biochemistry, and immunogenetics for identifying and quantifying target proteins. It combines gel electrophoresis with immunoassay, enabling researchers to analyze protein expression, post-translational modifications, and molecular weight.
-
RNA extraction experimental
By lysing cells, releasing RNA, and removing impurities such as proteins and DNA, high-purity RNA products are finally obtained. The commonly used traditional method is the guanidine isothiocyanate/phenol/chloroform method (Trizol), which is suitable for a variety of animal materials including animal tissues, microorganisms, cultured cells, etc., and most plant materials.
-
Human pluripotent stem cell endothelial-cell differentiation
Human pluripotent stem cell endothelial differentiation is based on stepwise developmental patterning: early activation of WNT/GSK3β inhibition promotes mesodermal or vascular progenitor entry, followed by endothelial specification using VEGF-related signaling, BMP4, FGF2, Notch modulation, or cAMP depending on the published protocol. Endothelial differentiation is read out by acquisition of CD31, CD34, VE-cadherin/CD144, KDR/VEGFR2, vWF, Tie2, NOS3, acetylated LDL uptake, tube/network formation, barrier function, and in vivo vessel-forming capacity where tested.
-
Vascular/Branching Fractal Analysis
Vascular/branching fractal analysis quantifies the geometric complexity of vessel trees or vascular networks from segmented 2D images, commonly by converting vessels into binary and/or skeletonized maps and estimating fractal dimension using box-counting or related approaches. Fractal dimension is interpreted as an image-derived readout of vascular branching complexity, space filling, or density, and has been applied to retinal photographs, fluorescein angiography, OCT angiography, capillary perfusion maps, and in vitro Matrigel angiogenesis networks. The assay readout is generated from vessel-positive pixels after image preprocessing, vessel segmentation, binarization, and optional skeletonization; reported outputs include fractal dimension, vessel density, branchpoint density, endpoint density, vessel length density, tortuosity, and generation-based branching metrics when VESGEN-style analysis is used. The biological interpretation is limited to quantitative vascular patterning and s
-
Annexin V plus membrane-impermeant dye apoptosis staining
Annexin V-based apoptosis assays rely on the detection of phosphatidylserine (PS) externalization from the inner leaflet of the plasma membrane to the outer leaflet, an early biochemical hallmark of apoptosis. Fluorescently labeled Annexin V binds PS in a calcium-dependent manner, enabling identification of early apoptotic cells by flow cytometry or fluorescence microscopy. When combined with a membrane-impermeant DNA-binding dye (e. g. , propidium iodide), this approach allows discrimination between viable (Annexin V−/dye−), early apoptotic (Annexin V+/dye−), and late apoptotic or necrotic (Annexin V+/dye+) cell populations by assessing membrane integrity and PS exposure.
-
ROS/oxidative-stress fluorescent staining
ROS/oxidative-stress fluorescent staining uses cell-permeant fluorogenic probes that become fluorescent after oxidation inside cells or tissues; commonly used examples include DCFH-DA/DCFDA for broad cellular oxidant detection, DHE for superoxide-related signal detection, MitoSOX for mitochondrial superoxide-related signal detection, and CellROX probes for oxidative-stress-associated fluorescence readouts. The assay detects probe oxidation rather than a single ROS species unless the probe and analysis method have been chemically validated for that species. DCFH-DA enters cells, is deacetylated by intracellular esterases to DCFH, and produces fluorescent DCF after oxidation, so the readout is used as an operational measure of total cellular oxidative stress rather than a species-specific ROS measurement. DHE and MitoSOX can report superoxide-related oxidation, but red fluorescence alone can include non-specific ethidium-like oxidation products; HPLC or optimized spectral approaches are
-
Liver Cancer Modeling
Liver cancer can be classified into primary liver cancer and secondary liver cancer. Secondary liver cancer is the metastatic liver cancer. Primary liver cancer includes hepatocellular carcinoma (HCC), intrahepatic cholangiocarcinoma (ICC) and fibrolamellar HCC, of which HCC is the most common form, accounting for approximately 90% of primary liver cancers[1]. HCC mouse models include chemical agent-induced models, transplanted tumor models, and genetic engineered models.
-
Cell Viability Determination by MTT Colorimetric Assay
The following protocol uses the MTT colorimetric assay as a classic literature-established method for assessing cell viability/metabolic activity in cultured mammalian cells. MTT[3-(4,5-dimethylthiazol-2-yl)-2,5-diphenyltetrazolium bromide] is reduced by metabolically active cells to a colored formazan product; the amount of formazan is quantified spectrophotometrically and provides an indirect measure of metabolically active viable cells. Importantly, MTT reduction reflects cellular oxidoreductase/metabolic activity rather than an absolute direct count of living cells, so changes in cellular metabolism can alter the signal independently of cell number.
-
Kinase activity and phosphorylation assays
Kinase activity assays measure the ability of kinases to transfer phosphate groups from ATP to specific substrates, while phosphorylation assays detect the presence and levels of phosphorylated proteins. Common methods include radiolabeled ATP incorporation (e. g. ,), ADP release detection via bioluminescence (e. g. ,[3]), enzyme-linked immunosorbent assays (ELISA) for phospho-specific epitopes (e. g. ,[6]), and microtiter-based formats for high-throughput screening (e. g. ,[8]). The ADP-Glo assay quantifies kinase activity by measuring ADP produced during phosphorylation using a luciferase-based system. Radiometric assays involve autoradiography or scintillation counting after incorporation of 32P-labeled ATP into substrate proteins. ELISA-based approaches rely on phospho-specific antibodies to detect activated kinases in cell lysates or purified samples.
-
Apoptosis
Apoptosis, also called programmed cell death, is generally characterized by distinct morphological characteristics.
-
TUNEL staining for apoptotic DNA fragmentation
TUNEL staining detects DNA strand breaks by using terminal deoxynucleotidyl transferase to add labeled nucleotides to exposed 3′-OH DNA termini, generating either microscopic staining in fixed cells or tissue sections, or fluorescence/cytometric signal in cell suspensions. TUNEL positivity reflects DNA fragmentation but should not be interpreted alone as definitive apoptosis, because TUNEL can also label necrotic, autolytic, mechanically damaged, or DNA-repair-associated DNA breaks.
-
Autophagy
Autophagy is a process in which eukaryotic cells use lysosomes to degrade their own cytoplasmic proteins and damaged organelles under the regulation of autophagy related gene (Atg). Microtubule-associated proteins light chain 3 (LC3) is recognized as autophagy marker, which transfers from cytoplasmic LC3 (LC3-I) to membrane type (LC3-II). LC3-II/I ratio could be detected by Western Blot and fluorescence microscopy.
-
Endothelial Tube Formation Assay
Endothelial tube formation assay evaluates the ability of endothelial cells to attach, migrate, align, and organize into capillary-like networks when cultured on gelled basement membrane extract or Matrigel; the readout is the morphology and quantity of tube-like networks, which reflects an in vitro endothelial morphogenesis step related to angiogenesis. Basement membrane extract/Matrigel provides laminin-rich extracellular matrix cues that support endothelial differentiation into capillary-like structures, but it can contain biologically active growth factors, so growth-factor-reduced matrix is preferred when testing defined angiogenic stimulators or inhibitors.
-
Patient-Derived Xenograft (PDX)
Patient-derived xenograft (PDX) models are generated by engrafting primary human tumor tissue directly into immunodeficient mice, allowing in vivo propagation of patient tumor biology without initial in vitro adaptation. These models are used to preserve key histopathological and molecular characteristics of the original tumor and enable assessment of tumor growth dynamics and therapeutic response in a living organism. The biological readout is tumor engraftment and subsequent growth in the murine host, which reflects the ability of human tumor cells to survive, vascularize, and expand in an immunocompromised microenvironment.
-
Apoptosis Solutions
Apoptosis is a regulated, generally non-lytic cell-death pathway that removes unwanted, damaged, infected, or abnormal cells through coordinated morphological changes, caspase activation, DNA fragmentation, and membrane remodeling. The intrinsic apoptosis pathway is controlled mainly by mitochondrial outer membrane permeabilization, BCL-2 family proteins, cytochrome c release, apoptosome formation, caspase-9 activation, and downstream executioner caspase-3/7 activation. The extrinsic apoptosis pathway is initiated by death receptors such as Fas, TNFR, and TRAIL receptors, which recruit adaptor proteins and activate caspase-8 before engaging executioner caspases or mitochondrial amplification through BID cleavage. Apoptosis is linked to many phenotypes, including cancer cell killing, tissue homeostasis, immune regulation, neurodegeneration, infection response, and treatment-induced cytotoxicity; unresolved questions include how apoptosis interacts with necroptosis, pyroptosis, ferroptos
-
Splenic/Portal-Vein Liver Metastasis Xenograft
Splenic and portal-vein liver metastasis xenograft models deliver tumor cells into the portal circulation so that cells reach the liver first and form hepatic metastatic lesions; splenic injection uses the spleen as an access route to the portal system, while direct portal-vein injection introduces cells into the portal vein without requiring splenectomy. The assay detects liver colonization, intrahepatic tumor growth, tumor distribution, treatment response, survival, and liver-metastasis microenvironment changes; readouts include bioluminescence or fluorescence imaging, gross liver nodule counts, liver weight or tumor burden, histology, and survival.
-
Protocol for Kinase activity and phosphorylation assays
Kinase activity assays measure transfer of phosphate from ATP to a protein or peptide substrate, generating phosphorylated substrate, ADP, or incorporated radiolabeled phosphate as the readout; phosphorylation assays measure site-specific phosphorylation in cells or tissues as a proxy for kinase-pathway activation, inhibition, or substrate regulation. Phosphorylation can be detected by phospho-specific Western blot, immunoprecipitation kinase assay, phospho-immunofluorescence, phospho-flow cytometry, luminescent ADP detection, radiolabeled ATP incorporation, or reporter-based pathway assays, and these readouts can be applied to cancer cells, primary neurons, mouse tumors, organoids, inflammatory macrophages, ferroptosis studies, and mitophagy studies when the kinase target is biologically relevant.
-
Lysosome and acidic-vesicle live-cell staining
Lysosome and acidic-vesicle live-cell staining detects acidic intracellular compartments by using membrane-permeant acidotropic probes that accumulate in low-pH vesicles, including lysosomes, late endosomes, autolysosomes, and acidic phagosomes. LysoTracker staining is commonly used as an intensity-based readout of acidic lysosomal compartment abundance or enlargement, while acridine orange produces green fluorescence in less concentrated compartments and red fluorescence after concentration-dependent accumulation in acidic vesicular organelles. Loss or reduction of acridine-orange red signal can be used as a readout of lysosomal membrane permeabilization or reduced acidic-vesicle integrity. This protocol is designed for live cultured cells and can be adapted for fluorescence microscopy, high-content imaging, plate-reader readout, or flow cytometry when the selected literature supports the readout. Because these dyes report acidotropic accumulation rather than lysosome identity alone,
-
Subcutaneous Cell-Line-Derived Xenograft
Subcutaneous cell-line-derived xenograft (CDX) models are established by implanting cultured human cancer cell lines into immunodeficient mice, where the injected cells form localized tumors that can be monitored in vivo as a measure of tumorigenic potential, growth kinetics, and treatment response. These models are widely used in oncology research because they allow reproducible tumor formation and enable comparative assessment of tumor growth between different cell lines or genetic manipulations in a controlled in vivo microenvironment. Subcutaneous implantation of cancer cells in immunodeficient mice is a standard approach for evaluating tumor growth behavior and therapeutic response across multiple cancer types, including prostate, esophageal, pancreatic, and colon cancer models.
-
Macroautophagy Solutions
Macroautophagy is a conserved lysosome-dependent degradation pathway in which cytoplasmic material is sequestered into double-membrane autophagosomes and delivered to lysosomes for degradation and recycling. The pathway supports cellular homeostasis during nutrient limitation, organelle stress, protein-aggregate accumulation, infection, differentiation, and tissue remodeling by coupling cargo sequestration, autophagosome maturation, lysosomal fusion, and degradation of cargo-derived macromolecules. The core molecular sequence includes initiation by nutrient- and stress-regulated autophagy machinery, autophagosome nucleation, LC3/ATG8-family conjugation to autophagosomal membranes, cargo selection through receptors such as SQSTM1/p62, autophagosome-lysosome fusion, and lysosomal degradation. LC3 was identified as a mammalian homolog of yeast Atg8 that localizes to autophagosomal membranes after processing, and p62/SQSTM1 was shown to connect ubiquitinated cargo with autophagic degradati
-
Endothelial Cell Migration/Angiogenic Sprouting Assay
Endothelial cell migration and angiogenic sprouting assays are in vitro (and partially ex vivo-adapted) functional models that quantify the ability of endothelial cells to undergo coordinated migration, extracellular matrix invasion, and multicellular organization into capillary-like sprouts in response to pro-angiogenic stimuli such as VEGF, bFGF, or conditioned microenvironments. These assays are used to model early angiogenic events including tip-cell formation, directional migration, and lumen-like sprout extension, which collectively reflect angiogenic activation and vascular morphogenesis processes observed in vivo.
-
Genotoxicity/Mutagenicity Study
The bacterial reverse mutation assay detects point mutations that restore amino-acid prototrophy in auxotrophic Salmonella typhimurium or Escherichia coli tester strains; after exposure to a test article, mutagenic activity is read out as an increased number of revertant colonies on minimal agar compared with the vehicle control. The assay uses tester strains with different mutation targets so that base-substitution and frameshift mutagens can be detected, and testing is performed with and without exogenous mammalian metabolic activation because some chemicals require biotransformation to become mutagenic.
-
Orthotopic Cell-Line Xenograft
Orthotopic cell-line xenograft models involve implantation of human cancer cell lines into the anatomically corresponding organ of immunodeficient mice to reproduce tumor growth within a native microenvironment, enabling more clinically relevant tumor behavior compared with subcutaneous models. These models are widely used because orthotopic placement better recapitulates tumor progression, including invasion and metastatic spread, which are often underrepresented in heterotopic implantation systems. Compared with conventional xenografts, orthotopic implantation is described as more technically complex but provides improved simulation of tumor-microenvironment interactions and metastatic behavior, making it particularly valuable for translational oncology research. Surgical orthotopic implantation approaches have been emphasized as enabling faithful reproduction of clinical cancer features, including metastasis and disease progression patterns that align with the tumor’s organ of origi
-
Intraperitoneal/Peritoneal Dissemination Xenograft
Intraperitoneal (IP) or peritoneal dissemination xenograft models are based on the introduction of human cancer cells into the peritoneal cavity of immunodeficient mice, where they attach to peritoneal surfaces, form multicellular aggregates or spheroids, and progressively generate disseminated tumor nodules that mimic advanced peritoneal metastatic disease. These models are widely used to study ovarian cancer progression, tumor-microenvironment interactions, and intraperitoneal therapeutic responses, often incorporating bioluminescence or fluorescence imaging to longitudinally monitor tumor burden in vivo. The biological principle relies on the capacity of tumor cells such as SKOV3 or related ovarian carcinoma lines to survive in suspension, aggregate within ascites-like fluid, adhere to mesothelial surfaces, and invade peritoneal organs, thereby recapitulating human peritoneal carcinomatosis patterns observed in advanced disease.


Purity & Documentation
-
Data Sheet (295 KB)
-
SDS (254 KB)
- English - EN (254 KB)
- Français - FR (254 KB)
- Deutsch - DE (254 KB)
- Norwegian - NO (254 KB)
- Español - ES (254 KB)
- Swedish - SV (254 KB)
- Italian - IT (254 KB)
- Korean - KR (254 KB)
- Portuguese - PT (254 KB)
-
Handling Instructions (2659 KB)
References
[1]. Phang CW, et al. Flavokawain C Inhibits Cell Cycle and Promotes Apoptosis, Associated with Endoplasmic Reticulum Stress and Regulation of MAPKs and Akt Signaling Pathways in HCT 116 Human Colon Carcinoma Cells. PLoS One. 2016;11(2):e0148775. Published 2016 Feb 9. [Content Brief]
[2]. Phang CW, et al. Induction of Apoptosis and Cell Cycle Arrest by Flavokawain C on HT-29 Human Colon Adenocarcinoma via Enhancement of Reactive Oxygen Species Generation, Upregulation of p21, p27, and GADD153, and Inactivation of Inhibitor of Apoptosis Proteins. Pharmacogn Mag. 2017;13(Suppl 2):S321-S328. [Content Brief]
[3]. Liu Q, et al. Flavokawain C suppresses nephroblastoma growth by inducing autophagy-mediated downregulation of FABP4 via AMPK/mTOR pathway. Sci Rep. Published online March 4, 2026. [Content Brief]
[4]. Hu Y, et al. Flavokawain C inhibits glucose metabolism and tumor angiogenesis in nasopharyngeal carcinoma by targeting the HSP90B1/STAT3/HK2 signaling axis. Cancer Cell Int. 2024;24(1):158. Published 2024 May 6. [Content Brief]
[5]. Wang R, et al. Flavokawain C inhibits proliferation and migration of liver cancer cells through FAK/PI3K/AKT signaling pathway. J Cancer Res Clin Oncol. 2024;150(3):117. Published 2024 Mar 9. [Content Brief]
[6]. Phang CW, et al. Flavokawain C exhibits anti-tumor effects on in vivo HCT 116 xenograft and identification of its apoptosis-linked serum biomarkers via proteomic analysis. Biomed Pharmacother. 2021;137:110846. [Content Brief]
[7]. Phang CW, et al. Proteomic analysis of flavokawain C-induced cell death in HCT 116 colon carcinoma cell line. Eur J Pharmacol. 2019;853:388-399. [Content Brief]


Complete Stock Solution Preparation Table
Please refer to the solubility information to select the appropriate solvent. The compound is unstable in solutions, freshly prepared is recommended.
| Optional Solvent | Concentration Solvent Mass | 1 mg | 5 mg | 10 mg | 25 mg |
|---|---|---|---|---|---|
| DMSO | 1 mM | 3.3299 mL | 16.6495 mL | 33.2989 mL | 83.2473 mL |
| 5 mM | 0.6660 mL | 3.3299 mL | 6.6598 mL | 16.6495 mL | |
| 10 mM | 0.3330 mL | 1.6649 mL | 3.3299 mL | 8.3247 mL | |
| 15 mM | 0.2220 mL | 1.1100 mL | 2.2199 mL | 5.5498 mL | |
| 20 mM | 0.1665 mL | 0.8325 mL | 1.6649 mL | 4.1624 mL | |
| 25 mM | 0.1332 mL | 0.6660 mL | 1.3320 mL | 3.3299 mL | |
| 30 mM | 0.1110 mL | 0.5550 mL | 1.1100 mL | 2.7749 mL | |
| 40 mM | 0.0832 mL | 0.4162 mL | 0.8325 mL | 2.0812 mL | |
| 50 mM | 0.0666 mL | 0.3330 mL | 0.6660 mL | 1.6649 mL | |
| 60 mM | 0.0555 mL | 0.2775 mL | 0.5550 mL | 1.3875 mL | |
| 80 mM | 0.0416 mL | 0.2081 mL | 0.4162 mL | 1.0406 mL | |
| 100 mM | 0.0333 mL | 0.1665 mL | 0.3330 mL | 0.8325 mL |


Flavokawain C Related Classifications
HY-N2445 Related Classifications
 Powered by Bioz
Keywords
- Flavokawain C
- 37308-75-1
- Apoptosis
- Akt
- JNK
- PERK
- Caspase
- PARP
- MDM-2/p53
- IAP
- Reactive Oxygen Species (ROS)
- SOD
- FABP
- Autophagy
- AMPK
- mTOR
- GLUT
- EGFR
- PI3K
- HSP
- VEGFR
- FAK
- natural chalcone
- HCT 116 cells
- HT-29 cells
- G401 cells
- HNE1 cells
- CNE2 cells
- Huh-7 cells
- Hep3B cells
- HepG2cells
- BALB/c nude mice
- colorectal cancer
- colon adenocarcinoma
- nephroblastoma
- nasopharyngeal carcinoma
- liver cancer
- Inhibitor
- inhibitor
- inhibit