



ARV-825
Based on 37 publication(s) in Google Scholar
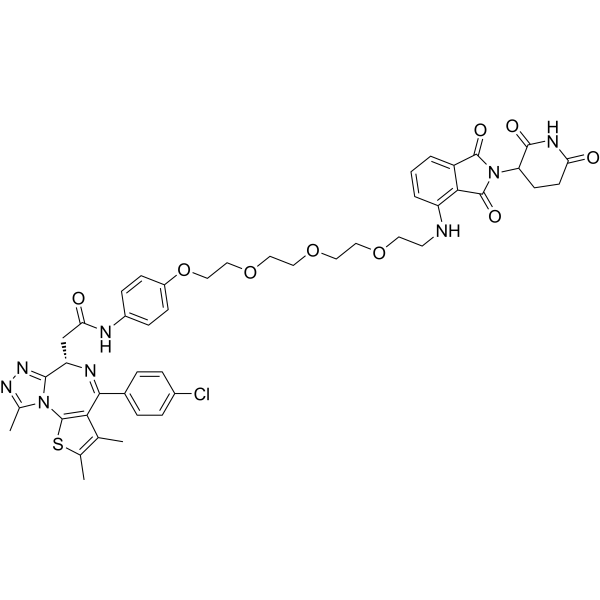
ARV-825 is a BET protein PROTAC degrader that recruits cereblon, and it targets BRD2, BRD3, and BRD4 for degradation via the ubiquitin-proteasome pathway. ARV-825 downregulates c-MYC, PLK1, MYCN, CDK4/6, JAK2, pSTAT3/5, PIM1, and Bcl-xL, upregulates p21 and p27, and modulates H3K27Ac-mediated transcription, the G2/M checkpoint, the Wnt/β-catenin pathway, and amino acid transport pathways. ARV-825 induces G1 phase cell cycle arrest, caspase 3/PARP-mediated apoptosis, DNA damage, and reactive oxygen species (ROS) production, reduces mitochondrial respiration, and simultaneously inhibits cell proliferation, clonogenic growth, and cell migration. ARV-825 is used in research on gastric cancer, leukemia, neuroblastoma, and cholangiocarcinoma.
(Pink: BRD4 ligand (HY-15743); Blue: E3 ligase ligand; Black: linker).
For research use only. We do not sell to patients.
- Purity : 99.21%
- CAS No.: 1818885-28-7
- Formula: C46H47ClN8O9S
- Molecular Weight:923.43
-
Storage:Powder -20°C, 3 years , 4°C, 2 years ; In solvent -80°C, 1 year , -20°C, 6 months

To place orders, for customer services and technical support, please contact: MedChemExpress USA
Tel: 609-228-6898 E-mail: [email protected] [email protected]


-
 Biological Activity
-
Chemical Information
-
Solvent & Solubility
- Protocols
- Purity & Documentation
- References
-
 Help & FAQs


-
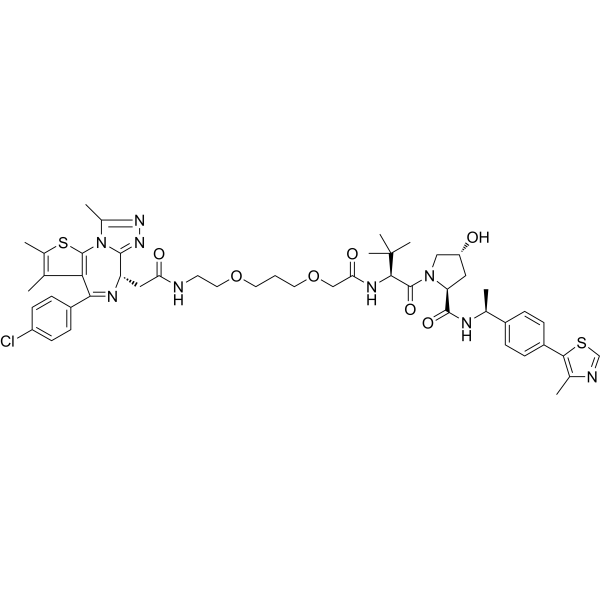
HY-100972
ARV-771BET PROTAC Degrader -
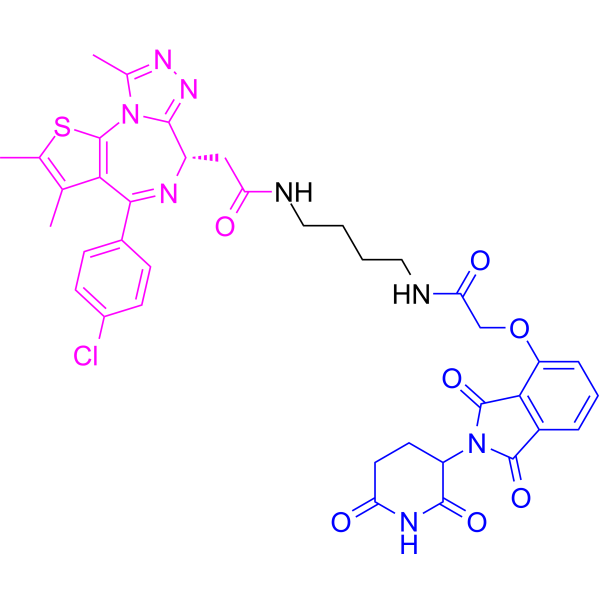
HY-101838
dBET1PROTAC BRD4 Degrader -
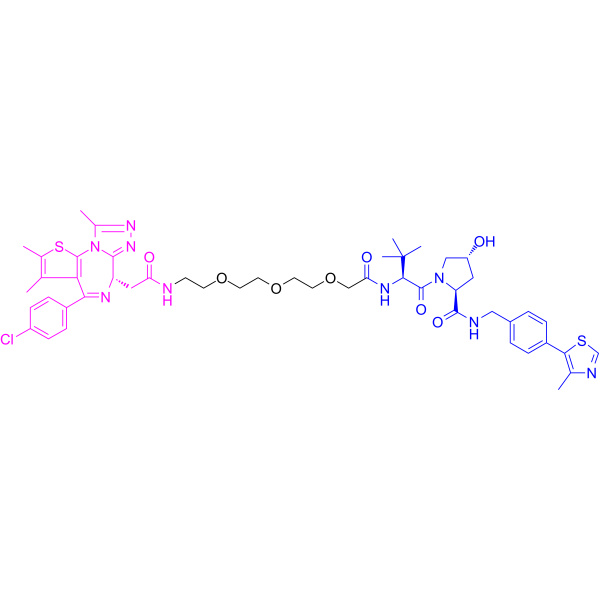
HY-107425
MZ 1PROTAC BRD4 Degrader -
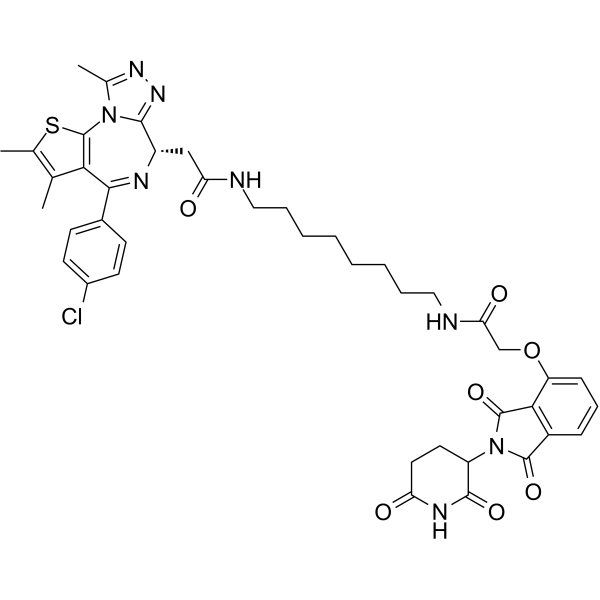
HY-112588
dBET6PROTAC BET Degrader -
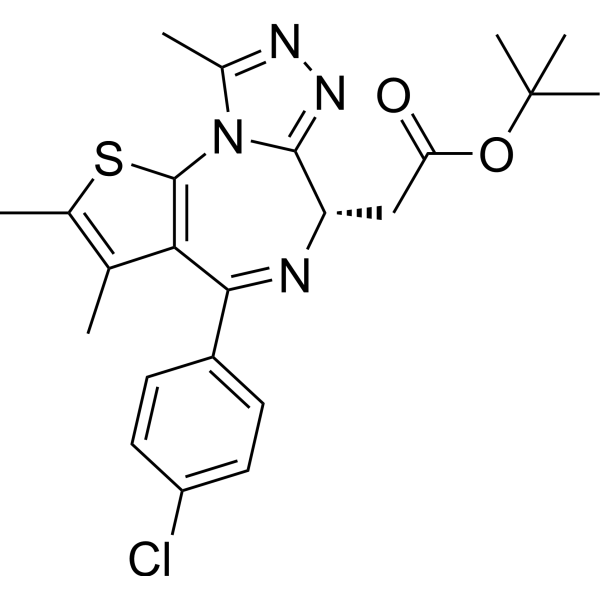
HY-13030
(+)-JQ-1BET Inhibitor -
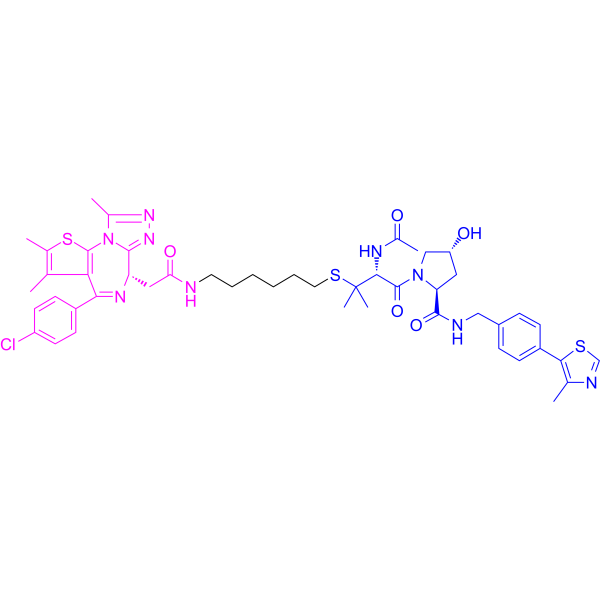
HY-111433
BRD4 degrader AT1BRD4 PROTAC Degrader -
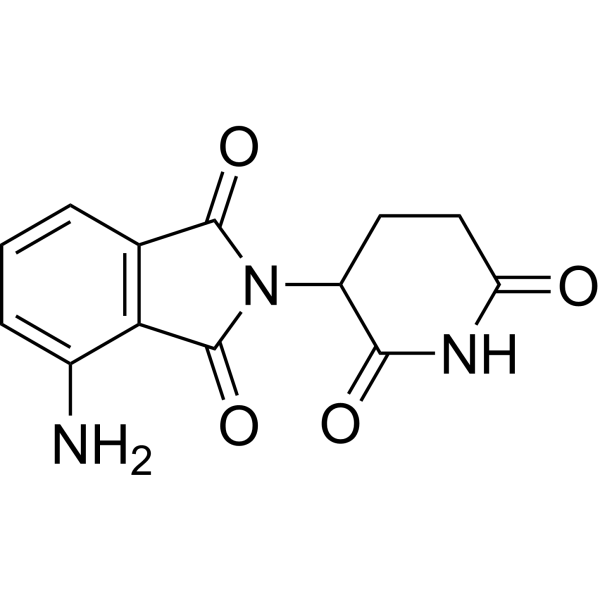
HY-10984
PomalidomideImmunomodulatory Agent -
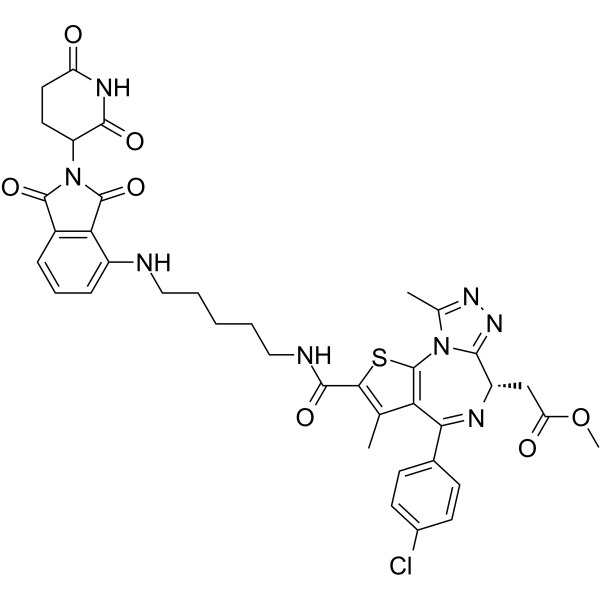
HY-122826
ZXH-3-26BRD4 PROTAC Degrader -
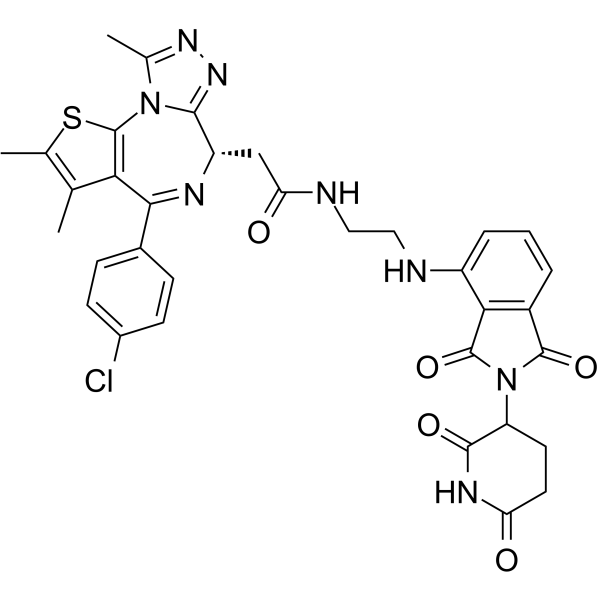
HY-123844
dBET57BRD4 PROTAC Degrader -
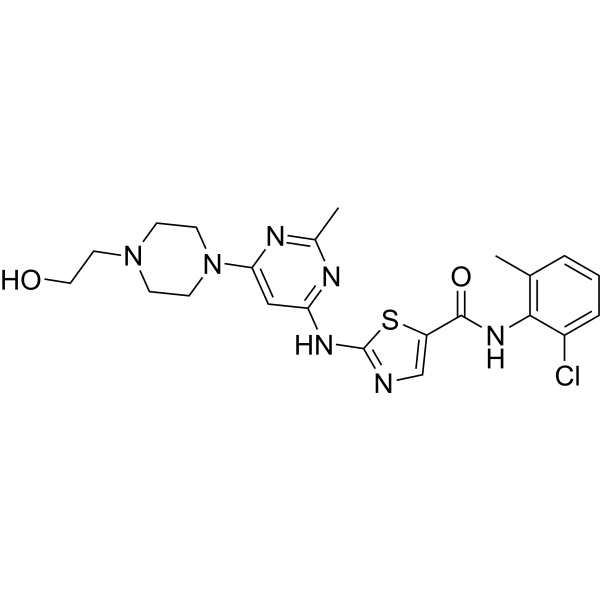
HY-10181
DasatinibSrc/Bcr-Abl Inhibitor -
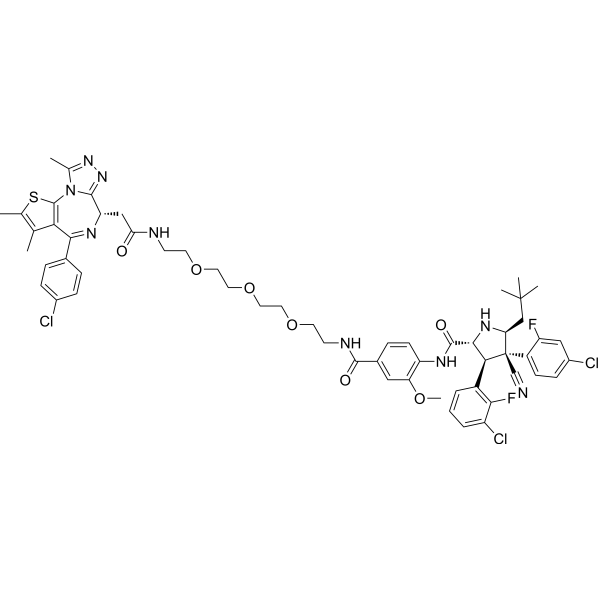
HY-114305
A1874BRD4 PROTAC Degrader -
HY-10087
NavitoclaxBcl-2 Inhibitor
Publications Citing Use of MedChemExpress (MCE) ARV-825
More- Nat Aging. 2026 Feb;6(2):316-328. [Abstract]
- Nat Aging. 2022 Feb;2(2):115-124. [Abstract]
- Nat Commun. 2022 Jul 18;13(1):4157. [Abstract]
- Nat Commun. 2022 Jan 10;13(1):183. [Abstract]
- Nat Commun. 2020 Aug 14;11(1):4083. [Abstract]
- Nat Commun. 2020 Apr 22;11(1):1935. [Abstract]
- J Adv Res. 2025 Jul 4:S2090-1232(25)00504-1. [Abstract]
- Acta Pharm Sin B. 2026 May 19.
- Biomaterials. 2025 Nov:322:123387. [Abstract]
- Cell Commun Signal. 2024 Aug 27;22(1):415. [Abstract]
- Cell Commun Signal. 2023 Nov 3;21(1):315. [Abstract]
- Mater Today Bio. 2025 Jan 24:31:101523. [Abstract]
- Clin Cancer Res. 2019 Jun 1;25(11):3404-3416. [Abstract]
- J Med Chem. 2026 Mar 19. [Abstract]
- Anal Chem. 2025 Dec 2;97(47):26097-26107. [Abstract]
- Mol Cancer Ther. 2025 Jul 2. [Abstract]
- JCI Insight. 2022 May 9;7(9):e150871. [Abstract]
- Biochem Pharmacol. 2025 Nov:241:117159. [Abstract]
- Int J Mol Sci. 2025 Aug 21;26(16):8074. [Abstract]
- Cancer Sci. 2026 Jun;117(6):1608-1622. [Abstract]
- Sci Rep. 2018 Sep 5;8(1):13225. [Abstract]
- Cancers (Basel). 2023 Aug 11;15(16):4066. [Abstract]
- J Cell Mol Med. 2026 Apr;30(7):e71101. [Abstract]
- Structure. 2024 Dec 5;32(12):2352-2363.e8. [Abstract]
- Hum Gene Ther. 2023 Jan;34(1-2):42-55. [Abstract]
- J Biol Chem. 2022 Apr;298(4):101794. [Abstract]
- Invest New Drugs. 2025 Jun;43(3):621-633. [Abstract]
- J Pharm Biomed Anal. 2025 Jun 15:258:116746. [Abstract]
- bioRxiv. 2025 Sep 7.
- Indiana University Indianapolis. 2025.
- bioRxiv. 2025 April 30.
- bioRxiv. 2024 Mar 21.
- Environ Toxicol. 2024 Feb;39(2):669-679. [Abstract]
- University of Texas. 2023 Jun 13.
- Research Square Print. November 18th, 2022
- Martin-Luther-Universität Halle-Wittenberg. 2020 Dec.
- Aging. 2020 Mar 12;12(5):4547-4557. [Abstract]
 Customer Validation & Images

-
IF
-
WB
-
WB
All PROTACs Isoforms
MoreAll Caspase Isoforms
More

Biological Activity
Description
|
BRD2 |
BRD3 |
BRD4 |
PLK1 |
c-Myc |
MYCN |
CDK4 |
CDK6 |
JAK2 |
p-STAT3 |
STAT5 |
PIM1 |
Bcl-xL |
p21 |
P27 |
H3K27Ac |
Wnt |
β-catenin |
Caspase 3 |
PARP |
Cellular Effect
|
Cell Line

|
Type | Value | Description | References |
|---|---|---|---|---|
| SK-N-SH | IC50 |
146.9 nM
|
Inhibition of cell viability in human SK-N-SH neuroblastoma cells incubated for 72 h measured by CCK8 assay with absorbance read at 450 nm.
Inhibition of cell viability in human SK-N-SH neuroblastoma cells incubated for 72 h measured by CCK8 assay with absorbance read at 450 nm.
|
33324552 |
| SH-SY5Y | IC50 |
53.71 nM
|
Inhibition of cell viability in human SH-SY5Y neuroblastoma cells incubated for 72 h measured by CCK8 assay with absorbance read at 450 nm.
Inhibition of cell viability in human SH-SY5Y neuroblastoma cells incubated for 72 h measured by CCK8 assay with absorbance read at 450 nm.
|
33324552 |
| IMR-32 | IC50 |
7.024 nM
|
Inhibition of cell viability in human IMR-32 neuroblastoma cells incubated for 72 h measured by CCK8 assay with absorbance read at 450 nm.
Inhibition of cell viability in human IMR-32 neuroblastoma cells incubated for 72 h measured by CCK8 assay with absorbance read at 450 nm.
|
33324552 |
| SK-N-BE(2) | IC50 |
232.8 nM
|
Inhibition of cell viability in human SK-N-BE(2) neuroblastoma cells incubated for 72 h measured by CCK8 assay with absorbance read at 450 nm.
Inhibition of cell viability in human SK-N-BE(2) neuroblastoma cells incubated for 72 h measured by CCK8 assay with absorbance read at 450 nm.
|
33324552 |
| SET-2 | IC50 |
14.5 nM
|
Apoptosis induction in post-MPN sAML SET2 cells assessed by annexin-V and TO-PRO-3 iodide staining and flow cytometry.
Apoptosis induction in post-MPN sAML SET2 cells assessed by annexin-V and TO-PRO-3 iodide staining and flow cytometry.
|
28042144 |
| MGC-803 | IC50 |
91.4 nM
|
Inhibits MGC8003 cells viability.
Inhibits MGC8003 cells viability.
|
34733788 |
| SGC-7901 | IC50 |
188.7 nM
|
Inhibits SGC7901 cells viability.
Inhibits SGC7901 cells viability.
|
34733788 |
| AGS | IC50 |
163.6 nM
|
Inhibits AGS cells viability.
Inhibits AGS cells viability.
|
34733788 |
| HGC-27 | IC50 |
35.9 nM
|
Inhibits HGC27 cells viability.
Inhibits HGC27 cells viability.
|
34733788 |
| BGC-823 | IC50 |
116.1 nM
|
Inhibits BGC823 cells viability.
Inhibits BGC823 cells viability.
|
34733788 |
| MOLT-4 | IC50 |
0.534 μM
|
Inhibits MOLT-4 cells viability.
Inhibits MOLT-4 cells viability.
|
33888130 |
| Jurkat | IC50 |
0.254 μM
|
Inhibits Jurkat cells viability.
Inhibits Jurkat cells viability.
|
33888130 |
In Vitro
ARV-825 (1-10000 nM; 72 h) potently suppresses viability of multiple human gastric cancer cell lines, with MGC803 and HGC27 cells showing higher sensitivity than AGS, SGC7901, BGC823, and SNU-216 cells[1].
ARV-825 (62.5-1000 nM; 2 weeks) dose-dependently inhibits long-term clonogenic growth of MGC803, HGC27, AGS, and SGC7901 gastric cancer cells[1].
ARV-825 (62.5-500 nM; 72 h) dose-dependently reduces c-Myc and PLK1 protein levels in MGC803, HGC27, AGS, and SGC7901 gastric cancer cells[1].
ARV-825 (72 h) CRBN expression level modulates the antiproliferative potency of ARV-825 in gastric cancer cells, with CRBN knockdown decreasing and CRBN overexpression increasing ARV-825 sensitivity[1].
ARV-825 (12.5-200 nM; 4-24 h) induces rapid, dose- and time-dependent, proteasome-mediated BRD4 degradation that persists for at least 24 h after compound removal in HuCCT1, HuH28, and OZ human cholangiocarcinoma cells[4].
ARV-825 (25-100 nM; 96 h) reduces viability of HuCCT1 and HuH28 human cholangiocarcinoma cells in a dose-dependent manner following 96 h of treatment[4].
ARV-825 (50 nM; 7 days) completely abolishes clonogenic growth of HuCCT1 human cholangiocarcinoma cells over 7 days[4].
ARV-825 (12.5-200 nM; 4-24 h) causes sustained downregulation of c-Myc protein in high c-Myc-expressing HuCCT1 and OZ human cholangiocarcinoma cells but does not affect c-Myc protein levels in low c-Myc-expressing HuH28 cells[4].
ARV-825 (100 nM; 6-24 h) downregulates c-Myc mRNA expression in HuCCT1 and OZ human cholangiocarcinoma cells in a dose-dependent manner[4].
ARV-825 (12.5-200 nM; 24 h) upregulates p21 protein expression in HuCCT1, HuH28, and OZ human cholangiocarcinoma cells in a dose-dependent manner after 24 h of treatment[4].
ARV-825 (62.5-1000 nM) induces G1 phase cell cycle arrest in MGC803, HGC27, AGS, and SGC7901 gastric cancer cells[1].
ARV-825 (1 μM; 48 h) induces G1-phase cell cycle arrest in Jurkat, CCRF-CEM, Molt4, and 6T-CEM T-ALL cells after 48 h of treatment[2].
ARV-825-induced growth inhibition in Jurkat, 6T-CEM, and Molt4 T-ALL cells is CRBN-mediated, as CRBN overexpression decreases and CRBN knockdown increases the IC50 of ARV-825[2].
ARV-825 (10-10000 nM; 72 h) potently suppresses proliferation of human cholangiocarcinoma cells in a dose-dependent manner[4].
ARV-825 (25-100 nM; 24-72 h) induces G1 phase cell cycle arrest in HuCCT1, HuH28, and OZ human cholangiocarcinoma cells[4].
ARV-825 (62.5-250 nM; 72 h) dose-dependently induces apoptosis in MGC803, HGC27, AGS, and SGC7901 gastric cancer cells after 72 h of treatment[1].
ARV-825 (62.5-500 nM; 72 h) induces dose-dependent degradation of BRD2, BRD3, and BRD4 and activates apoptotic caspase 3 and PARP cleavage in MGC803, HGC27, AGS, and SGC7901 gastric cancer cells[1].
ARV-825 (1 μM; 48 h) induces apoptosis in Jurkat, CCRF-CEM, Molt4, and 6T-CEM T-ALL cells after 48 h of treatment, as measured by Annexin V/PI flow cytometry[2].
ARV-825 (0.5-4 μM; 48 h) potently degrades BRD2, BRD3, and BRD4 proteins in 6T-CEM, Molt4, Jurkat, and CCRF T-ALL cells in a concentration-dependent manner at 48 h, with DC50 values in the low nanomolar range for most cell lines and BET isoforms, and concomitantly increases cleaved caspase 3 and PARP protein levels[2].
ARV-825 (50-200 nM; 48 h) induces caspase 3/7 activation in HuCCT1 and HuH28 human cholangiocarcinoma cells after 48 h of treatment[4].
ARV-825 (50-100 nM; 72 h) induces apoptosis in HuCCT1 human cholangiocarcinoma cells after 72 h of treatment, as measured by Annexin V positivity[4].
ARV-825 (1.0 μM; 24 h treatment followed by 24 h drug-free washout) induces profound and sustained depletion of BRD4 and BRD2, including sustained nuclear depletion after drug washout, in post-MPN sAML SET2 cells[6].
ARV-825 (20-500 nM; 48 h) dose-dependently induces apoptosis in post-MPN sAML SET2 cells (IC50 14.5 nM) and UKE1 cells (IC50 256 nM), with greater potency in SET2 cells[6].
ARV-825 dose-dependently induces cell death in patient-derived CD34+ post-MPN sAML cells while relatively sparing normal CD34+ hematopoietic progenitor cells[6].
Co-treatment with ARV-825 and Ruxolitinib (HY-50856) synergistically induces apoptosis in post-MPN sAML SET2 and HEL92.1.7 cells, associated with greater attenuation of p-STAT5, c-Myc, CDK4/6, PIM1, and Bcl-xL[6].
ARV-825 (1 μM; 48 h-7 days) suppresses viability and proliferation of Jurkat, CCRF-CEM, Molt4, and 6T-CEM T-ALL cells in a dose- and time-dependent manner[2].
ARV-825 (1-8 μM; 7 days) inhibits growth and downregulates BET proteins and c-Myc in primary pediatric T-ALL cells[2].
ARV-825 (72 h) potently inhibits the viability of SK-N-SH, SH-SY5Y, IMR-32, and SK-N-BE(2) neuroblastoma cells with IC50 values in the nanomolar range, with IMR-32 being the most sensitive and SK-N-BE(2) the least sensitive cell line[3].
ARV-825 (0.01-1000 nM) suppresses long-term clonogenic proliferation of SK-N-SH, SH-SY5Y, IMR-32, and SK-N-BE(2) neuroblastoma cells in a dose-dependent manner[3].
ARV-825 (1-500 nM) triggers G2/M cell cycle arrest in SK-N-SH, SH-SY5Y, IMR-32, and SK-N-BE(2) neuroblastoma cells, accompanied by an increased G1 phase proportion and decreased S and G2 phase proportions[3].
ARV-825 (5-1000 nM; 72 h) induces dose-dependent apoptosis in SK-N-SH, SH-SY5Y, IMR-32, and SK-N-BE(2) neuroblastoma cells after 72 h of treatment[3].
ARV-825 (0.1-1000 nM) induces cleavage of PARP and Caspase-3 in SK-N-SH, SH-SY5Y, IMR-32, and SK-N-BE(2) neuroblastoma cells in a dose-dependent manner[3].
ARV-825 (0.1-1000 nM) induces dose-dependent degradation of BRD2, BRD3, and BRD4 proteins in SK-N-SH, SH-SY5Y, IMR-32, and SK-N-BE(2) neuroblastoma cells[3].
ARV-825 (0.1-1000 nM) downregulates protein levels of MYCN in MYCN-amplified IMR-32 and SK-N-BE(2) cells and c-Myc in MYCN non-amplified SK-N-SH and SH-SY5Y neuroblastoma cells in a dose- and time-dependent manner[3].
ARV-825 downregulates mRNA levels of MYCN in MYCN-amplified SK-N-BE(2) cells and c-Myc in MYCN non-amplified SK-N-SH neuroblastoma cells[3].
ARV-825 downregulates the expression of MYCN-associated super enhancer genes (ISL1, PHOX2B, HAND2, GATA3, TBX2) in both MYCN-amplified SK-N-BE(2) and MYCN non-amplified SK-N-SH neuroblastoma cells[3].
MedChemExpress (MCE) has not independently confirmed the accuracy of these methods. They are for reference only. Further protocols information, click here.
-
Cell Line:MGC803, HGC27, AGS, SGC7901, BGC823, SNU-216 human gastric cancer cell lines
-
Concentration:1-10000 nM
-
Incubation Time:72 h
-
Result:Induced a dose-dependent decrease in cell viability across all gastric cancer cell lines.
Decreased cell number and cell shrinkage were observed after 500 nM ARV-825 relative to untreated control cells.
-
Cell Line:MGC803, HGC27, AGS, SGC7901 human gastric cancer cell lines
-
Concentration:62.5-1000 nM
-
Incubation Time:2 weeks
-
Result:Dose-dependently suppressed clonal formation in all four gastric cancer cell lines.
Markedly reduced the number of clones compared with untreated control groups.
-
Cell Line:MGC803, HGC27, AGS, SGC7901 human gastric cancer cell lines
-
Concentration:62.5-1000 nM
-
Incubation Time:72 h
-
Result:Increased the percentage of apoptotic cells in a dose-dependent manner compared with control groups.
-
Cell Line:MGC803, HGC27, AGS, SGC7901 human gastric cancer cell lines
-
Concentration:62.5-500nM
-
Incubation Time:72 h
-
Result:Efficiently degraded BRD4 protein in all four gastric cancer cell lines.
Reduced BRD2 and BRD3 protein levels in parallel with BRD4.
Increased cleavage of caspase 3 and PARP, consistent with the induction of apoptosis.\nDecreased c-Myc and PLK1 protein levels in a dose-dependent manner in all four gastric cancer cell lines.
-
Cell Line:Jurkat, CCRF-CEM, Molt4, 6T-CEM human T-ALL cell lines
-
Concentration:1 μM
-
Incubation Time:48 h
-
Result:Increased the apoptotic rates of T-ALL cell lines, especially CCRF, Jurkat, and Molt4 cells, after 48 h of treatment.
-
Cell Line:Jurkat, CCRF-CEM, Molt4, 6T-CEM human T-ALL cell lines
-
Concentration:0.5 μM; 1 μM; 2 μM; 4 μM
-
Incubation Time:48 h
-
Result:Induced almost complete BRD4 protein degradation in T-ALL cell lines.
Reduced BRD2 and BRD3 protein expression levels.
Was more potent in degrading BRD2 than BRD4 in Jurkat and CCRF cells.
Exhibited DC50 values at 48 h as follows: 6T-CEM - BRD2: 23.12 nM, BRD3: 16.41 nM, BRD4: 25.64 nM; Molt4 - BRD2: 13.55 nM, BRD3: 5.38 nM, BRD4: 4.75 nM; Jurkat - all three BET proteins around 5 nM; CCRF - BRD2: 34.28 nM, BRD3: 29.72 nM, BRD4: 225.42 nM.
Decreased CRBN protein levels with increasing concentration.
Increased PARP and cleaved caspase 3 levels in a concentration-dependent manner in most cell lines.
Markedly upregulated cleaved caspase 3 in all treated cells.
Increased PARP in most treated T-ALL cells, except CCRF.
-
Cell Line:SK-N-SH, SH-SY5Y, IMR-32, SK-N-BE(2)
-
Concentration:IMR-32: 5-10 nM; SH-SY5Y: 5-50 nM; SK-N-BE(2): 100-1000 nM
-
Incubation Time:72 h
-
Result:Robustly elicited apoptosis in all four NB cell lines in a dose-dependent manner.
Substantially increased the proportion of apoptotic cells compared with DMSO-treated controls.
-
Cell Line:HuCCT1, HuH28, OZ human cholangiocarcinoma cell lines
-
Concentration:12.5-200 nM (dose-response); 100 nM (time-course); 100 nM (proteasome inhibition); 100 nM (washout/recovery)
-
Incubation Time:24 h (dose-response); 4-24 h (time-course); 12 h (proteasome inhibition); 24 h pre-treatment, 6-24 h post-washout (washout/recovery)
-
Result:Downregulated BRD4 protein levels in a dose- and time-dependent manner across all three CCA cell lines.
Induced BRD4 degradation that was completely blocked by co-treatment with the proteasome inhibitor MG132 (HY-13259).
Suppressed BRD4 protein expression for up to 24 h after compound removal and washout in HuCCT1, OZ, and HuH28 cells.
-
Cell Line:human cholangiocarcinoma cell lines
-
Concentration:10-10000 nM
-
Incubation Time:72 h
-
Result:Potently inhibited CCA cell proliferation in a dose-dependent manner across all tested cell lines.
Exhibited significantly lower IC50 values compared to the BET inhibitors OTX-015 and JQ1.
-
Cell Line:HuCCT1, HuH28 human cholangiocarcinoma cell lines
-
Concentration:25 nM; 50 nM; 100 nM
-
Incubation Time:96 h
-
Result:Dose-dependently inhibited cell viability of HuCCT1 and HuH28 cells after 96 h of treatment.
-
Cell Line:HuCCT1 human cholangiocarcinoma cell line
-
Concentration:50 nM; 100 nM
-
Incubation Time:72 h
-
Result:Caused a significant increase in the percentage of Annexin V-positive HuCCT1 cells after 72 h of treatment.
-
Cell Line:HuCCT1, OZ, HuH28 human cholangiocarcinoma cell lines
-
Concentration:12.5-200 nM
-
Incubation Time:4-24 h
-
Result:Markedly downregulated c-Myc protein levels in HuCCT1 and OZ cells in a dose- and time-dependent manner.
-
Cell Line:HuCCT1, OZ human cholangiocarcinoma cell lines
-
Concentration:100 nM
-
Incubation Time:6 h; 24 h
-
Result:Led to marked downregulation of c-Myc mRNA levels in HuCCT1 and OZ cells in a dose-dependent manner.
-
Cell Line:HuCCT1, HuH28, OZ human cholangiocarcinoma cell lines
-
Concentration:12.5-200 nM
-
Incubation Time:24 h
-
Result:Induced a dose-dependent increase in p21 protein expression across all tested CCA cell lines.
-
Cell Line:HuCCT1, HuH28, OZ human cholangiocarcinoma cell lines
-
Concentration:25 nM; 50 nM; 100 nM; 100 nM
-
Incubation Time:24 h; 48 h; 72 h
-
Result:Suppressed G1/S transition, causing cell cycle arrest at the G1 phase in all tested CCA cell lines.
-
Cell Line:post-MPN sAML SET2 cells
-
Concentration:1.0 μM
-
Incubation Time:24 h treatment; followed by 24 h drug-free washout
-
Result:Caused marked depletion of BRD4 and BRD2 protein levels in SET2 cells.
Significantly depleted nuclear expression of BRD4 in sAML cells as confirmed by confocal immunofluorescence microscopy.
Induced sustained depletion of BRD4 and BRD2 levels following 24-hour washout after 24-hour treatment.
In Vivo
ARV-825 reduces leukemia burden and prolongs survival in a mouse model of disseminated human acute myeloid leukemia[5].
ARV-825 (10 mg/kg; i.p.; daily) effectively suppresses T-ALL xenograft tumor growth by depleting BET and c-Myc proteins, reducing proliferation, and inducing apoptosis[2].
ARV-825 (5 mg/kg; i.p.; daily) effectively suppresses tumor growth, reduces proliferation, and downregulates BRD4 and MYCN protein expression in a MYCN-amplified neuroblastoma subcutaneous xenograft mouse model[3].
MedChemExpress (MCE) has not independently confirmed the accuracy of these methods. They are for reference only.
-
Animal Model:Nude mice (four-week-old male; Lingchang BioTech; n=6 per group)[1]
-
Dosage:10 mg/kg
-
Administration:i.p.; daily
-
Result:Reduced tumor burden compared with the control group.
Lowered the ratio of Ki67-positive cells in treated tumors.
Significantly downregulated BRD4 protein levels in vivo.
Caused no remarkable difference in mouse body weight compared with the control group, and no obvious toxic side effects were detected.
-
Animal Model:Nude mice (female, 4 weeks old, from Lingchang BioTech Co., Ltd.)[2]
-
Dosage:10 mg/kg
-
Administration:i.p.; daily
-
Result:Significantly reduced tumor burden and xenograft tumor weight compared with control.
Downregulated BRD4 and c-Myc protein expression in xenograft tumors.
Reduced Ki67 positive cells in tumors.
Increased the proportion of cleaved-caspase 3 positive cells in tumors.
Showed no significant difference in mouse body weight compared with control group.
-
Animal Model:Nude mice (athymic nude, male, 5 weeks old)[3]
-
Dosage:5 mg/kg
-
Administration:i.p.; daily; until tumors exceeded 1,000 mm3
-
Result:Significantly reduced tumor burden and tumor weight in the SK-N-BE(2) xenograft model compared to vehicle control.
Showed no significant difference in mouse body weight compared to the control group.
Substantially lowered the proportion of Ki-67 positive cells in tumors, indicating reduced tumor proliferative activity.
Downregulated BRD4 and MYCN protein expression in the xenograft tumor tissue.


Chemical Information
-
CAS No. 1818885-28-7
-
Appearance Solid
-
Molecular Weight 923.43
-
Formula C46H47ClN8O9S
-
Color Light yellow to yellow
-
SMILES
CC1=NN=C2N1C(SC(C)=C3C)=C3C(C4=CC=C(Cl)C=C4)=N[C@H]2CC(NC5=CC=C(OCCOCCOCCOCCNC6=C(C(N(C7CCC(NC7=O)=O)C8=O)=O)C8=CC=C6)C=C5)=O
-
Shipping
Room temperature in continental US; may vary elsewhere.
-
Storage
Powder -20°C 3 years 4°C 2 years In solvent -80°C 1 year -20°C 6 months


Publications (37)
-
Journal Impact Factor
-
Most Recent
-
Nat Aging
Comparative analysis of senolytic drugs reveals mitochondrial determinants of efficacy and resistance. [Abstract]2026 Feb;6(2):316-328. PMID: 41611832 -
Nat Aging
SARS-CoV-2 infection triggers paracrine senescence and leads to a sustained senescence-associated inflammatory response. [Abstract]2022 Feb;2(2):115-124. PMID: 37117754 -
Nat Commun
Hepatocyte growth factor derived from senescent cells attenuates cell competition-induced apical elimination of oncogenic cells. [Abstract]2022 Jul 18;13(1):4157. PMID: 35851277 -
Nat Commun
A proximity biotinylation-based approach to identify protein-E3 ligase interactions induced by PROTACs and molecular glues. [Abstract]2022 Jan 10;13(1):183. PMID: 35013300 -
Nat Commun
BRD4 prevents the accumulation of R-loops and protects against transcription-replication collision events and DNA damage. [Abstract]2020 Aug 14;11(1):4083. PMID: 32796829
ARV-825 purchased from MedChemExpress. Usage Cited in: Nat Commun. 2020 Aug 14;11(1):4083. [Abstract]
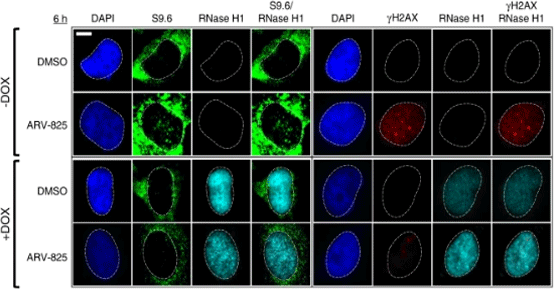
Representative IF images and quantification of nuclear S9.6 intensity, γH2AX foci, and RNase H1 in HeLa cells in the absence (−DOX) or presence (+DOX) of doxycycline-induced FLAG-tagged RNase H1 expression for 24 h, followed by treatment with 100 nM ARV-825 for 6 h.
ARV-825 purchased from MedChemExpress. Usage Cited in: Nat Commun. 2020 Aug 14;11(1):4083. [Abstract]
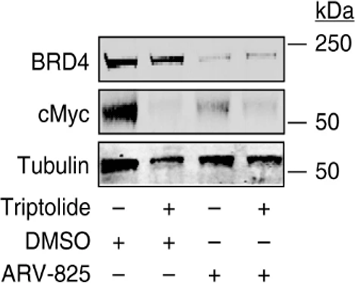
Cells treated with ARV-825 shows marked degradation of BRD4 protein and significantly reduces levels of MYC protein, demonstrating reduced levels of BRD4-driven MYC transcription.
-
Nat Commun
A BET family protein degrader provokes senolysis by targeting NHEJ and autophagy in senescent cells. [Abstract]2020 Apr 22;11(1):1935. PMID: 32321921 -
J Adv Res
2025 Jul 4:S2090-1232(25)00504-1. PMID: 40617410 -
-
Biomaterials
Tumor microenvironment responsive nano-PROTAC for BRD4 degradation enhanced cancer photo-immunotherapy. [Abstract]2025 Nov:322:123387. PMID: 40344878 -
Cell Commun Signal
Inhibition of bromodomain and extra-terminal proteins targets constitutively active NFκB and STAT signaling in lymphoma and influences the expression of the antiapoptotic proteins BCL2A1 and c-MYC. [Abstract]2024 Aug 27;22(1):415. PMID: 39192247 -
Cell Commun Signal
2023 Nov 3;21(1):315. PMID: 37924094 -
Mater Today Bio
A pH-responsive PROTAC-based nanosystem triggers tumor-specific ferroptosis to construct in situ tumor vaccines. [Abstract]2025 Jan 24:31:101523. PMID: 39935894 -
Clin Cancer Res
2019 Jun 1;25(11):3404-3416. PMID: 30796033 -
J Med Chem
2026 Mar 19. PMID: 41852276 -
Anal Chem
Hydrogen/Deuterium Exchange for Chiral Stability Assessment in Acidic Methine-Containing Compounds. [Abstract]2025 Dec 2;97(47):26097-26107. PMID: 41243541 -
Mol Cancer Ther
Harnessing senolytics and PARP inhibition to expand the antitumor activity of CDK4/6 inhibitors in prostate cancer. [Abstract]2025 Jul 2. PMID: 40601842 -
JCI Insight
Inhibition of bromodomain extraterminal histone readers alleviates skin fibrosis in experimental models of scleroderma. [Abstract]2022 May 9;7(9):e150871. PMID: 35349485 -
Biochem Pharmacol
Discovery of a potent BRD4 PROTAC and evaluation of its bioactivity in breast cancer cell lines. [Abstract]2025 Nov:241:117159. PMID: 40659131 -
Int J Mol Sci
BRD4 Mediates Transforming Growth Factor-β-Induced Smooth Muscle Cell Differentiation from Mesenchymal Progenitor Cells. [Abstract]2025 Aug 21;26(16):8074. PMID: 40869394 -
Cancer Sci
MYC Addiction as a Targetable Vulnerability in Nelarabine-Resistant T-Cell Acute Lymphoblastic Leukemia. [Abstract]2026 Jun;117(6):1608-1622. PMID: 41947770 -
Sci Rep
Interplay between interferon regulatory factor 1 and BRD4 in the regulation of PD-L1 in pancreatic stellate cells. [Abstract]2018 Sep 5;8(1):13225. PMID: 30185888
ARV-825 purchased from MedChemExpress. Usage Cited in: Sci Rep. 2018 Sep 5;8(1):13225. [Abstract]
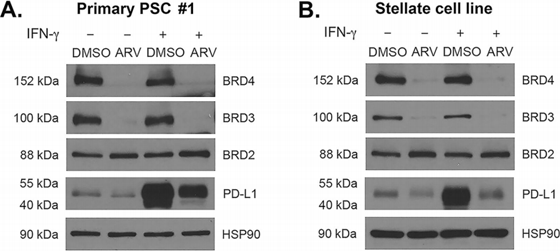
ARV-825 decreases IFN-γ-induced PD-L1 mRNA and protein expression in primary PSCs and in the stellate cell line.
-
Cancers (Basel)
BRD4 Inhibition as a Strategy to Prolong the Response to Standard of Care in Estrogen Receptor-Positive Breast Cancer. [Abstract]2023 Aug 11;15(16):4066. PMID: 37627092 -
J Cell Mol Med
2026 Apr;30(7):e71101. PMID: 41896195 -
Structure
PROTAC-mediated activation, rather than degradation, of a nuclear receptor reveals complex ligand-receptor interaction network. [Abstract]2024 Dec 5;32(12):2352-2363.e8. PMID: 39389062 -
Hum Gene Ther
HIV Tat- conjugated Histone H3 peptides induce tumor cell death via cellular stress responses. [Abstract]2023 Jan;34(1-2):42-55. PMID: 36373826 -
J Biol Chem
Degradation and inhibition of epigenetic regulatory protein BRD4 exacerbate Alzheimer's disease-related neuropathology in cell models. [Abstract]2022 Apr;298(4):101794. PMID: 35248531 -
Invest New Drugs
Targeting Myc through BET-PROTAC elicits potent anti-lymphoma activity in diffuse large B cell lymphoma. [Abstract]2025 Jun;43(3):621-633. PMID: 40307411 -
J Pharm Biomed Anal
Development and optimization of a high-throughput LC-MS/MS method for the simultaneous determination of Exatecan and its Cathepsin B-sensitive prodrug, and ARV-825 in rat plasma: Application to pharmacokinetic study. [Abstract]2025 Jun 15:258:116746. PMID: 39955884 -
-
-
-
-
Environ Toxicol
Transcriptional factor BRD4 promotes the stemness of esophageal cancer by activating the nuclear PD-L1/RelB axis. [Abstract]2024 Feb;39(2):669-679. PMID: 37615218 -
-
-
-
Aging
2020 Mar 12;12(5):4547-4557. PMID: 32163373


Solvent & Solubility
In Vitro:
DMSO : ≥ 50 mg/mL (54.15 mM; Hygroscopic DMSO has a significant impact on the solubility of product, please use newly opened DMSO)
* "≥" means soluble, but saturation unknown.
Please refer to the solubility information to select the appropriate solvent. Once prepared, please aliquot and store the solution to prevent product inactivation from repeated freeze-thaw cycles.
Storage method and period of stock solution: -80°C, 1 year; -20°C, 6 months. When stored at -80°C, please use it within 1 year. When stored at -20°C, please use it within 6 months.
Please refer to the solubility information to select the appropriate solvent. Once prepared, please aliquot and store the solution to prevent product inactivation from repeated freeze-thaw cycles.
Storage method and period of stock solution: -80°C, 1 year; -20°C, 6 months. When stored at -80°C, please use it within 1 year. When stored at -20°C, please use it within 6 months.
Concentration (start) × Volume (start) = Concentration (final) × Volume (final)
In Vivo:
Select the appropriate dissolution method based on your experimental animal and administration route.
- For the following dissolution methods, please ensure to first prepare a clear stock solution using an In Vitro approach and then sequentially add co-solvents:
- To ensure reliable experimental results, the clarified stock solution can be appropriately stored based on storage conditions. As for the working solution for In Vivo experiments, it is recommended to prepare freshly and use it on the same day.
- The percentages shown for the solvents indicate their volumetric ratio in the final prepared solution. If precipitation or phase separation occurs during preparation, heat and/or sonication can be used to aid dissolution.
Add each solvent one by one: 10% DMSO 40% PEG300 5% Tween-80 45% Saline
Solubility: ≥ 2.5 mg/mL (2.71 mM); Clear solution
This protocol yields a clear solution of ≥ 2.5 mg/mL (saturation unknown).
Taking 1 mL working solution as an example, add 100 μL DMSO stock solution (25.0 mg/mL) to 400 μL PEG300, and mix evenly; then add 50 μL Tween-80 and mix evenly; then add 450 μL Saline to adjust the volume to 1 mL.
Preparation of Saline: Dissolve 0.9 g sodium chloride in ddH₂O and dilute to 100 mL to obtain a clear Saline solution.
In Vivo Dissolution Calculator
Please enter the basic information of animal experiments:
-
-
-
-
Recommended: Prepare an additional quantity of animals to account for potential losses during experiments.
Please enter your animal formula composition:
-
%DMSO +
Recommended: Keep the proportion of DMSO in working solution below 2% if your animal is weak.
-
%+
-
+%Tween-80 + +
-
%Saline +
The co-solvents required include: DMSO, . All of co-solvents are available by MedChemExpress (MCE). , Tween 80. All of co-solvents are available by MedChemExpress (MCE).
Working solution concentration: 0.22 mg/mL
Method for preparing stock solution: mg drug dissolved in μL DMSO. Stock solution concentration: mg/mL.
1. Take μL DMSO stock solution;
2. Add μL .
μL , mix evenly;
3. Then add μL Tween 80, mix evenly;
4. Then add μL
Please ensure that the stock solution in the first step is dissolved to a clear state, and add co-solvents in sequence. You can use ultrasonic heating (ultrasonic cleaner, recommended frequency 20-40 kHz), vortexing, etc. to assist dissolution.

Protocols
-
Cell migration
Cell migration is a method that plays an important role in wound healing, cell differentiation, embryonic development, etc.
-
Somatic Cell Culture
A method of simulating the in vivo environment in vitro to maintain the cell growth, differentation and main functions.
-
Apoptosis
Apoptosis, also called programmed cell death, is generally characterized by distinct morphological characteristics.
-
TUNEL staining for apoptotic DNA fragmentation
TUNEL staining detects DNA strand breaks by using terminal deoxynucleotidyl transferase to add labeled nucleotides to exposed 3′-OH DNA termini, generating either microscopic staining in fixed cells or tissue sections, or fluorescence/cytometric signal in cell suspensions. TUNEL positivity reflects DNA fragmentation but should not be interpreted alone as definitive apoptosis, because TUNEL can also label necrotic, autolytic, mechanically damaged, or DNA-repair-associated DNA breaks.
-
Flow cytometric DNA-content cell-cycle staining
Flow cytometric DNA-content cell-cycle staining measures the fluorescence intensity of DNA-bound fluorochromes in single cells or nuclei to estimate DNA content distributions, allowing assignment of populations to G0/G1, S, and G2/M phases by DNA histogram deconvolution. Propidium iodide (PI) intercalates into DNA, and PI fluorescence is proportional to cellular DNA content when staining is performed under conditions that make DNA accessible and minimize non-DNA signal. Cells with G2/M DNA content are expected to show approximately twice the fluorescence intensity of G0/G1 cells, while S-phase cells occupy intermediate fluorescence values. PI-based DNA-content analysis can also detect cells with fractional DNA content, often reported as sub-G1, when DNA fragmentation and extraction during staining reduce retained DNA signal in apoptotic cells. DAPI is an alternative DNA fluorochrome for univariate DNA-content analysis, while bivariate approaches combining DNA content with proliferation
-
Chemotaxis Gradient Chamber Assay 1
The chemotaxis gradient chamber assay is based on the principle of observing directional cell migration in response to a stable, linear or quasi-linear concentration gradient of a chemoattractant formed between two fluid reservoirs separated by a narrow observation chamber. Cells placed within the chamber respond to the gradient by polarized movement toward higher chemoattractant concentrations, allowing quantification of chemotactic behavior in real time under microscopy. The classic Zigmond chamber design enables simultaneous visualization of gradient formation and individual cell trajectories, making it suitable for studying leukocyte chemotaxis and other motile cell types in vitro.
-
Under-Agarose Cell Migration Assay
The under-agarose cell migration assay is a classical in vitro chemotaxis method designed to evaluate directed cell movement through a semi-solid agarose matrix toward soluble chemoattractant gradients, enabling visualization and quantification of leukocyte or motile cell migration in a confined 2D-like environment. In this system, cells and chemoattractants are placed in separate wells cut into an agarose gel, allowing diffusion-driven gradient formation that guides directional migration, which is typically assessed by measuring migration distance, cell morphology changes, and accumulation toward the chemoattractant source. This assay has been widely used to study neutrophil and leukocyte chemotaxis as a simple alternative to filter-based migration systems and allows direct microscopic observation of migrating cells under near-physiological confinement conditions.
-
Transwell/Boyden Chamber Migration Assay
The Transwell/Boyden chamber migration assay measures cell movement through a porous membrane separating an upper and lower chamber, usually after a chemoattractant gradient is established by placing cells in the upper chamber and chemoattractant-containing medium in the lower chamber. The readout is generated by quantifying cells that traverse the membrane and appear on the lower membrane surface or in the lower chamber, depending on whether the cell type is adherent or non-adherent. This assay reflects chemotactic or haptotactic migration rather than matrix invasion unless an extracellular-matrix barrier is added to the membrane.
-
Apoptosis Solutions
Apoptosis is a regulated, generally non-lytic cell-death pathway that removes unwanted, damaged, infected, or abnormal cells through coordinated morphological changes, caspase activation, DNA fragmentation, and membrane remodeling. The intrinsic apoptosis pathway is controlled mainly by mitochondrial outer membrane permeabilization, BCL-2 family proteins, cytochrome c release, apoptosome formation, caspase-9 activation, and downstream executioner caspase-3/7 activation. The extrinsic apoptosis pathway is initiated by death receptors such as Fas, TNFR, and TRAIL receptors, which recruit adaptor proteins and activate caspase-8 before engaging executioner caspases or mitochondrial amplification through BID cleavage. Apoptosis is linked to many phenotypes, including cancer cell killing, tissue homeostasis, immune regulation, neurodegeneration, infection response, and treatment-induced cytotoxicity; unresolved questions include how apoptosis interacts with necroptosis, pyroptosis, ferroptos
-
3D Collagen/Hydrogel Matrix Migration Assay
The 3D collagen/hydrogel matrix migration assay is based on embedding cells within or on top of a fibrillar collagen type I-rich three-dimensional matrix to model in vivo-like extracellular matrix (ECM) architecture, enabling analysis of cell migration through a physically and biochemically relevant scaffold. In contrast to 2D migration systems, cells in 3D matrices interact with fibrillar collagen networks, requiring coordinated adhesion remodeling and proteolytic or non-proteolytic deformation mechanisms to move through confined spaces, thereby providing a more physiologically relevant readout of invasive and migratory behavior in tissue-like environments. Cell movement in 3D collagen matrices is typically quantified by tracking single-cell trajectories, invasion depth, or matrix penetration over time, reflecting combined effects of cytoskeletal dynamics, cell-ECM adhesion turnover, and ECM remodeling. These systems are widely used to study tumor cell invasion and stromal cell motili
-
Soft Agar Colony Formation Assay
Soft agar colony formation assay measures anchorage-independent growth, in which transformed or tumorigenic cells proliferate as colonies in a semisolid agar matrix while many non-transformed adherent cells fail to proliferate without attachment; classic studies showed that growth in semisolid medium correlates with tumorigenicity in nude mice, and later protocol papers describe the method as a stringent in vitro assay for malignant transformation. The readout is the number, size, morphology, or signal intensity of colonies formed within agar after incubation; published formats include manual colony counting after staining, 96-well or 384-well quantitative formats, DNA-binding dye detection, MTT/tetrazolium-based detection, digital image analysis, and PCR-based marker detection from soft agar cultures.
-
MTT Cell Proliferation Assay
The MTT assay is a colorimetric endpoint assay for estimating viable cell number, cell growth, cytotoxicity, or cell activation in cultured mammalian cells. Living cells reduce the yellow tetrazolium salt MTT into purple/blue formazan, while dead cells do not generate the same signal; the resulting color can be quantified with a multiwell spectrophotometer. MTT reduction is commonly interpreted as a readout of metabolic activity that often correlates with viable cell number, but it should not be treated as a direct cell-counting method unless the assay is optimized for the cell type and experimental condition. Studies show that MTT reduction can involve mitochondrial and non-mitochondrial reducing systems, and formazan may accumulate in intracellular lipid droplets rather than simply marking mitochondria.
-
Cell-Exclusion Zone Migration Assay
The Cell-Exclusion Zone (CEZ) migration assay is an in vitro 2D cell migration method in which a defined cell-free area is created using removable physical barriers such as silicone stoppers, allowing cells to be seeded around the barrier and subsequently migrate into the cleared zone after barrier removal. This approach enables quantification of collective cell migration by monitoring repopulation of the initially cell-free region over time using microscopy-based imaging. Compared with scratch-based wound healing assays, barrier-based exclusion methods are designed to avoid mechanical damage to the extracellular matrix and reduce injury-induced effects on boundary cells, thereby improving interpretability of migration behavior in vitro. The assay readout is typically the progressive reduction in the cell-free area or the number of cells invading the exclusion zone, reflecting coordinated cell motility relevant to physiological processes such as wound healing, epithelial repair, and ca
-
Chemotaxis Gradient Chamber Assay 2
Chemotaxis gradient chamber assays measure directional cell migration in response to a soluble chemical gradient by imaging cells as they move across a defined observation region; the readout is generated from time-lapse cell trajectories, displacement toward the gradient, forward migration index, trajectory plots, rose/polar plots, and statistical tests of non-random directionality. The Dunn chamber is a direct-viewing glass chamber in which cells migrate across a bridge between control and chemoattractant wells, allowing observation of cells in a linear concentration gradient; related direct-viewing formats include the Insall chamber, which supports defined unidirectional gradients and high numerical-aperture microscopy, and the μ-Slide Chemotaxis chamber, which supports long-term live-cell imaging and gradient characterization with fluorescent dye.
-
Genotoxicity/Mutagenicity Study
The bacterial reverse mutation assay detects point mutations that restore amino-acid prototrophy in auxotrophic Salmonella typhimurium or Escherichia coli tester strains; after exposure to a test article, mutagenic activity is read out as an increased number of revertant colonies on minimal agar compared with the vehicle control. The assay uses tester strains with different mutation targets so that base-substitution and frameshift mutagens can be detected, and testing is performed with and without exogenous mammalian metabolic activation because some chemicals require biotransformation to become mutagenic.
-
Scratch/Wound-Healing Migration Assay
The scratch/wound-healing migration assay measures collective migration of adherent cells into an experimentally created cell-free gap in a confluent monolayer. The readout is generated by imaging the gap immediately after scratching and at later time points, then quantifying reduction in wound area, wound width, or percentage closure as cells move into the denuded region. Gap closure reflects cell migration but may also include cell proliferation, so interpretation should distinguish migration-focused conditions from proliferation-driven closure when possible, such as by using short assay windows, serum-controlled conditions, cell counting, or proliferation controls reported in published protocols.
-
Annexin V plus membrane-impermeant dye apoptosis staining
Annexin V-based apoptosis assays rely on the detection of phosphatidylserine (PS) externalization from the inner leaflet of the plasma membrane to the outer leaflet, an early biochemical hallmark of apoptosis. Fluorescently labeled Annexin V binds PS in a calcium-dependent manner, enabling identification of early apoptotic cells by flow cytometry or fluorescence microscopy. When combined with a membrane-impermeant DNA-binding dye (e. g. , propidium iodide), this approach allows discrimination between viable (Annexin V−/dye−), early apoptotic (Annexin V+/dye−), and late apoptotic or necrotic (Annexin V+/dye+) cell populations by assessing membrane integrity and PS exposure.
-
BrdU Incorporation Assay
Bromodeoxyuridine (BrdU) incorporation assay is based on the principle that BrdU, a thymidine analog, is incorporated into newly synthesized DNA during the S phase of the cell cycle, thereby serving as a marker of DNA replication and cellular proliferation. Incorporated BrdU can be detected using anti-BrdU antibodies following DNA denaturation, enabling visualization or quantification of proliferating cells through immunochemical detection methods such as immunofluorescence or immunohistochemistry.
-
ROS/oxidative-stress fluorescent staining
ROS/oxidative-stress fluorescent staining uses cell-permeant fluorogenic probes that become fluorescent after oxidation inside cells or tissues; commonly used examples include DCFH-DA/DCFDA for broad cellular oxidant detection, DHE for superoxide-related signal detection, MitoSOX for mitochondrial superoxide-related signal detection, and CellROX probes for oxidative-stress-associated fluorescence readouts. The assay detects probe oxidation rather than a single ROS species unless the probe and analysis method have been chemically validated for that species. DCFH-DA enters cells, is deacetylated by intracellular esterases to DCFH, and produces fluorescent DCF after oxidation, so the readout is used as an operational measure of total cellular oxidative stress rather than a species-specific ROS measurement. DHE and MitoSOX can report superoxide-related oxidation, but red fluorescence alone can include non-specific ethidium-like oxidation products; HPLC or optimized spectral approaches are
-
Neural Crest/Neuronal Cell Migration Explant Assay
Neural crest (NC) and neuronal cell migration explant assays are in vitro systems in which neural tube-derived tissues are cultured to allow premigratory or newly emigrated neural crest cells to undergo epithelial-to-mesenchymal transition (EMT), migrate away from the explant, and form a measurable radial outgrowth that reflects migratory capacity and environmental responsiveness. These assays typically quantify migration by measuring the expansion of cell outgrowth from neural tube or neural plate border explants over time, often comparing early and later timepoints to derive a migration index such as a radius ratio, which reflects net cell dispersal from the explant core. Neural tube explant cultures preserve key aspects of neural crest behavior, including EMT, migration, and early differentiation, making them suitable for assessing intrinsic migratory ability and extrinsic cue dependence. However, studies emphasize that migratory outgrowth from neural tube explants may include non-n
-
CFSE Dye Dilution Proliferation Assay
The CFSE (carboxyfluorescein diacetate succinimidyl ester) dye dilution proliferation assay is based on the covalent labeling of intracellular proteins by a cell-permeant fluorescent dye that becomes fluorescent upon intracellular ester cleavage and then is stably retained within cells. As labeled cells divide, the dye is partitioned equally between daughter cells, resulting in a stepwise halving of fluorescence intensity that can be quantified by flow cytometry to determine the number of cell divisions undergone by each cell population. This fluorescence dilution approach enables quantitative tracking of lymphocyte proliferation at the single-cell level over multiple rounds of division. CFSE-based proliferation analysis has been widely applied to measure antigen-driven lymphocyte expansion in vitro, where discrete fluorescence peaks correspond to successive cell divisions and allow reconstruction of proliferative history within heterogeneous populations.
-
Dye-dilution cell tracking and proliferation staining
Dye-dilution cell tracking assays quantify cell proliferation by covalently labeling intracellular proteins with a stable fluorescent dye that is equally partitioned between daughter cells during mitosis, resulting in stepwise halving of fluorescence intensity with each cell division as measured by flow cytometry histograms. Carboxyfluorescein diacetate succinimidyl ester (CFSE) is a prototypical dye that diffuses into cells, is enzymatically converted into a fluorescent compound, and then covalently binds intracellular amine groups, producing long-lived fluorescence suitable for tracking multiple rounds of division in vitro and in vivo. Successive generations of dividing cells form discrete peaks of decreasing fluorescence intensity, enabling estimation of proliferation history, precursor frequency, and division index within heterogeneous populations. Alternative dyes such as CellTrace Violet (CTV) and far-red membrane dyes (e. g. , PKH26) follow the same dilution principle but differ
-
Protocol for Cell Cycle
Cell-cycle analysis by flow cytometry measures DNA content in single cells to estimate the fraction of cells in G0/G1, S, and G2/M phases. Propidium iodide intercalates into DNA, and after RNA removal with RNase, fluorescence intensity reflects cellular DNA content: 2N cells are assigned to G0/G1, cells between 2N and 4N to S phase, and 4N cells to G2/M. DNA-content analysis alone cannot reliably separate G0 from G1 or G2 from M. Ki-67 can distinguish quiescent G0 cells from cycling cells, EdU or BrdU incorporation marks active DNA synthesis in S phase, and phospho-histone H3 staining identifies mitotic cells within the 4N population.
-
CCK-8/WST-8 Cell Proliferation Assay
The CCK-8/WST-8 assay is based on the reduction of the water-soluble tetrazolium salt WST-8 to a water-soluble formazan product by cellular dehydrogenases in metabolically active cells, where the generated formazan amount is proportional to the number of living cells and is quantified by measuring absorbance in the visible range, providing a colorimetric readout for cell viability and proliferation assessment. This class of tetrazolium-based assays improves upon earlier MTT-based systems by producing a water-soluble formazan, eliminating the need for organic solubilization steps and enabling direct spectrophotometric measurement in culture medium.
-
Cell Counting-Based Growth Curve Assay
Cell counting-based growth curve assays quantify cell proliferation by directly measuring changes in viable cell number over time using manual or automated counting methods such as hemocytometer-based counting or instrument-assisted cell enumeration, enabling construction of growth curves that reflect population expansion dynamics in response to culture conditions. A widely used approach is trypan blue exclusion with hemocytometer counting, where membrane-compromised (non-viable) cells take up the dye, allowing discrimination between viable and non-viable cells while simultaneously enabling total cell number quantification. Repeated sampling across time points allows estimation of proliferation rate, growth phases, and comparative growth kinetics between experimental conditions.
-
Colony Formation (Clonogenic) Assay
The clonogenic (colony formation) assay measures the ability of a single cell to retain reproductive viability and form a macroscopic colony, typically defined as a cluster derived from one progenitor cell after a defined growth period. This assay is widely used to evaluate cell survival after exposure to ionizing radiation or cytotoxic treatments and is considered a standard method in radiation biology for generating dose-response relationships of reproductive cell death. Colony formation reflects long-term proliferative capacity rather than short-term metabolic activity, and survival is quantified by comparing treated versus untreated conditions based on colony number and derived survival fractions.
-
Cell Viability Determination by MTT Colorimetric Assay
The following protocol uses the MTT colorimetric assay as a classic literature-established method for assessing cell viability/metabolic activity in cultured mammalian cells. MTT[3-(4,5-dimethylthiazol-2-yl)-2,5-diphenyltetrazolium bromide] is reduced by metabolically active cells to a colored formazan product; the amount of formazan is quantified spectrophotometrically and provides an indirect measure of metabolically active viable cells. Importantly, MTT reduction reflects cellular oxidoreductase/metabolic activity rather than an absolute direct count of living cells, so changes in cellular metabolism can alter the signal independently of cell number.
-
EdU Incorporation Assay (Click Chemistry-Based DNA Synthesis Measurement)
The EdU incorporation assay measures DNA synthesis by adding the thymidine analog 5-ethynyl-2′-deoxyuridine to cells or tissues, where it is incorporated into newly synthesized DNA during S phase. Incorporated EdU is detected by copper-catalyzed azide-alkyne cycloaddition, in which a fluorescent azide covalently reacts with the ethynyl group on EdU, allowing S-phase cells to be detected by fluorescence microscopy, flow cytometry, or high-content imaging. EdU detection does not require DNA denaturation or anti-BrdU antibody access, which preserves sample structure and improves compatibility with immunostaining and multiparameter cytometry compared with BrdU-based detection. EdU can be cytotoxic in a cell-type- and exposure-dependent manner, so pulse duration, concentration, and continuous-labeling designs should be validated for each cell type.
-
Ki-67 Immunostaining Proliferation Assay
Ki-67 immunostaining measures the growth fraction of a cell population by detecting Ki-67, a nuclear antigen present in proliferating cells and absent in quiescent G0 cells. The readout is the percentage of Ki-67-positive nuclei among total counted cells, commonly called the Ki-67 labeling index or proliferation index.
-
PCNA Immunodetection Proliferation Assay
PCNA immunodetection measures proliferative activity by detecting proliferating cell nuclear antigen, a nuclear protein associated with DNA polymerase δ function and DNA replication. The assay readout is the proportion of PCNA-positive nuclei among total counted cells, but PCNA labeling is not identical to BrdU labeling because PCNA can mark late G1/early S-associated replication competence and may persist beyond active DNA synthesis depending on fixation and extraction conditions.
-
Protocol for Cell Counting and Cell Density Analysis
Cell counting and cell-density analysis estimate the number of cells in a known volume or field area. Manual hemocytometer counting uses a chamber of defined geometry to convert counted cells into cells/mL, while automated counters and image-analysis workflows detect cell objects from optical, brightfield, fluorescence, impedance, or digital-image features. Trypan blue viability counting is based on dye exclusion: viable cells with intact membranes exclude dye, while non-viable cells with compromised membranes stain blue. The readout is total cell density, viable-cell density, dead-cell density, and percent viability. Cell density can also be estimated from microscopy images by counting objects per image area, from flow cytometry using calibrated volume or reference particles, or from in situ microscopy in bioreactors after calibration against reference methods such as hemocytometer or flow cytometry.


Purity & Documentation
-
Data Sheet (305 KB)
-
SDS (393 KB)
- English - EN (393 KB)
- Français - FR (393 KB)
- Deutsch - DE (393 KB)
- Norwegian - NO (393 KB)
- Español - ES (393 KB)
- Swedish - SV (393 KB)
- Italian - IT (393 KB)
- Korean - KR (393 KB)
- Portuguese - PT (393 KB)
-
Handling Instructions (2659 KB)
References


Complete Stock Solution Preparation Table
Please refer to the solubility information to select the appropriate solvent. Once prepared, please aliquot and store the solution to prevent product inactivation from repeated freeze-thaw cycles.
Storage method and period of stock solution: -80°C, 1 year; -20°C, 6 months. When stored at -80°C, please use it within 1 year. When stored at -20°C, please use it within 6 months.
| Optional Solvent | Concentration Solvent Mass | 1 mg | 5 mg | 10 mg | 25 mg |
|---|---|---|---|---|---|
| DMSO | 1 mM | 1.0829 mL | 5.4146 mL | 10.8292 mL | 27.0730 mL |
| 5 mM | 0.2166 mL | 1.0829 mL | 2.1658 mL | 5.4146 mL | |
| 10 mM | 0.1083 mL | 0.5415 mL | 1.0829 mL | 2.7073 mL | |
| 15 mM | 0.0722 mL | 0.3610 mL | 0.7219 mL | 1.8049 mL | |
| 20 mM | 0.0541 mL | 0.2707 mL | 0.5415 mL | 1.3536 mL | |
| 25 mM | 0.0433 mL | 0.2166 mL | 0.4332 mL | 1.0829 mL | |
| 30 mM | 0.0361 mL | 0.1805 mL | 0.3610 mL | 0.9024 mL | |
| 40 mM | 0.0271 mL | 0.1354 mL | 0.2707 mL | 0.6768 mL | |
| 50 mM | 0.0217 mL | 0.1083 mL | 0.2166 mL | 0.5415 mL |


ARV-825 Related Classifications
HY-16954 Related Classifications
 Powered by Bioz
Keywords
- ARV-825
- 1818885-28-7
- ARV825
- ARV 825
- PROTACs
- Epigenetic Reader Domain
- c-Myc
- Polo-like Kinase (PLK)
- CDK
- JAK
- STAT
- Pim
- Bcl-2 Family
- PAK
- Wnt
- β-catenin
- Caspase
- PARP
- Apoptosis
- Reactive Oxygen Species (ROS)
- gastric cancer
- BRD4
- acute myeloid leukemia
- T-cell acute lymphoblastic leukemia
- cereblon
- cholangiocarcinoma
- BRD2
- c-MYC
- neuroblastoma
- BRD3
- Inhibitor
- inhibitor
- inhibit