



Santamarine

Based on 1 Customer Validation
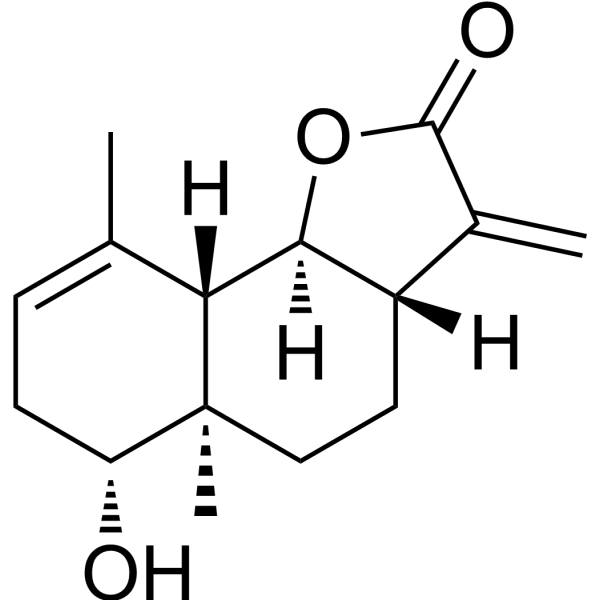
Santamarine (Santamarin; Balchanin) is a sesquiterpene lactone found in Artemisia scoparia. Santamarine shows anti-inflammatory, antioxidant, anticancer and anti-photoaging activities. Santamarine suppresses UVA-induced phosphorylation of JNK and p38 MAPK, nuclear translocation of phosphorylated c-Fos and c-Jun, and AP-1-mediated MMP-1 transcription and secretion. Santamarine suppresses NF-κB signaling, iNOS, COX-2, TNF-α, and IL-1β production. Santamarine inhibits thioredoxin reductase activity, induces ROS production, mitochondrial apoptosis, G2/M cell cycle arrest, and DNA damage, and reduces cancer cell growth. Santamarine can be used for the photoaging, inflammatory diseases and cancer.
For research use only. We do not sell to patients.
- Purity : 98.85%
- CAS No.: 4290-13-5
- Formula: C15H20O3
- Molecular Weight:248.32
-
Storage:Powder -20°C, 3 years ; In solvent -80°C, 6 months , -20°C, 1 month

To place orders, for customer services and technical support, please contact: MedChemExpress USA
Tel: 609-228-6898 E-mail: [email protected] [email protected]


-
 Biological Activity
-
Chemical Information
- Protocols
- Purity & Documentation
- References
-
 Help & FAQs


-
HY-N0643
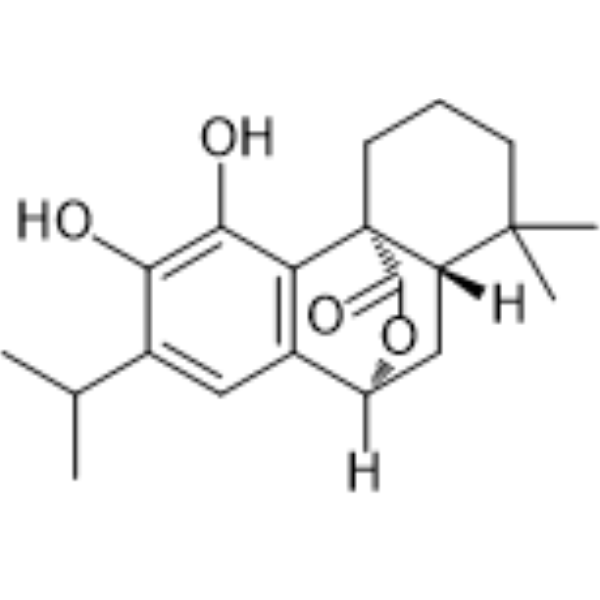
CarnosolEndogenous Metabolite -
HY-14909
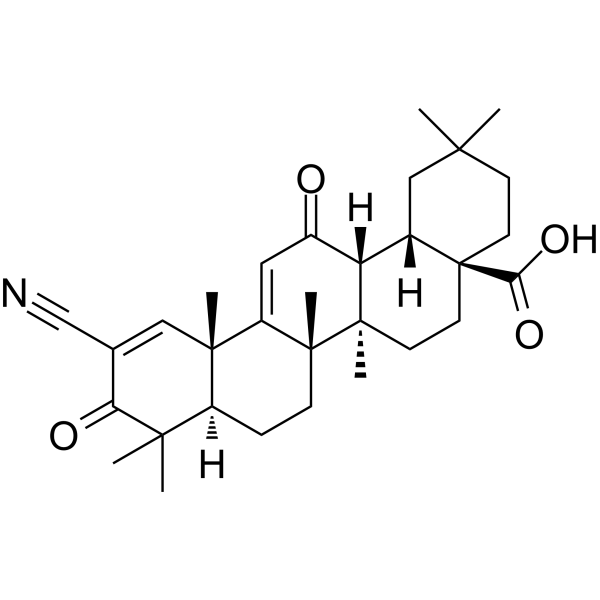
BardoxoloneNrf2 Activator -
HY-N0818
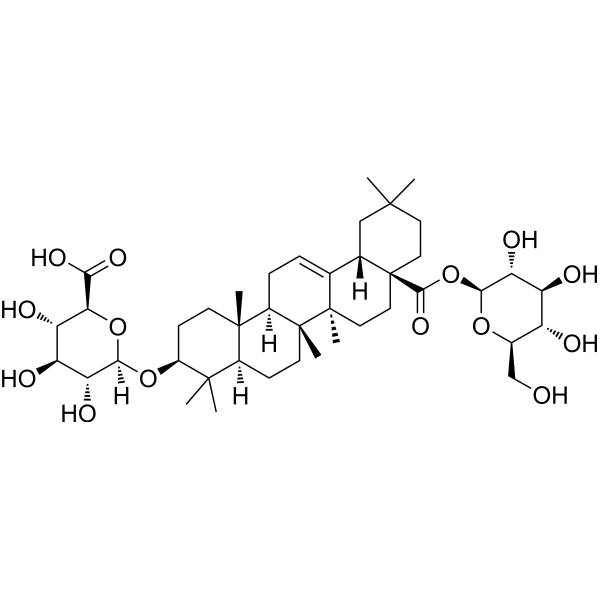
Chikusetsusaponin IvaAnti-inflammatory Agent -
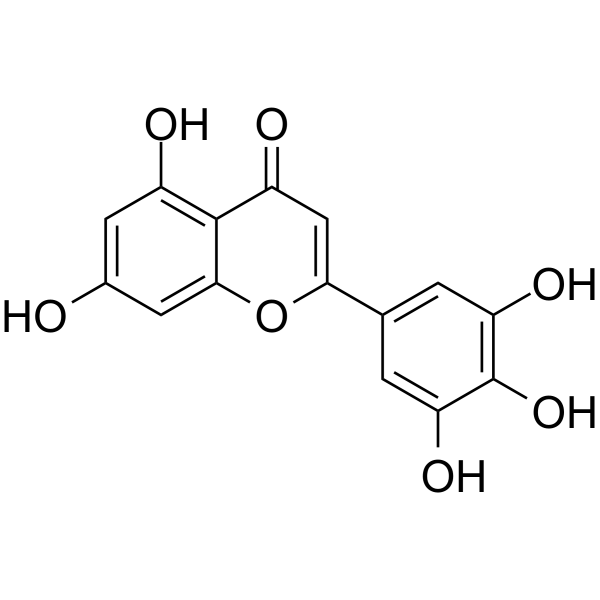
HY-131592
TricetinKeap1-Nrf2 PPI Inhibitor -
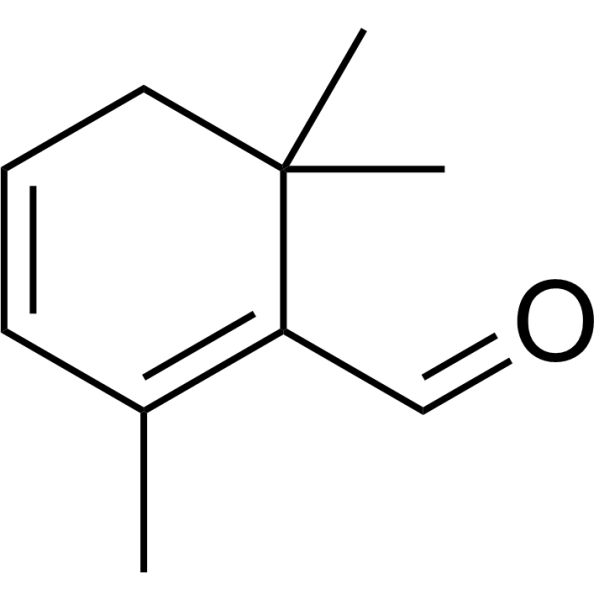
HY-N7560
SafranalPerfume Analogue -
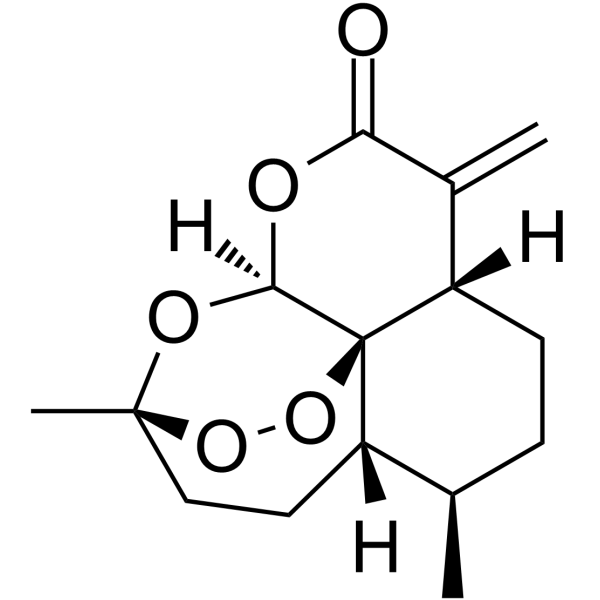
HY-122550
ArtemisiteneNrf2 Activator -
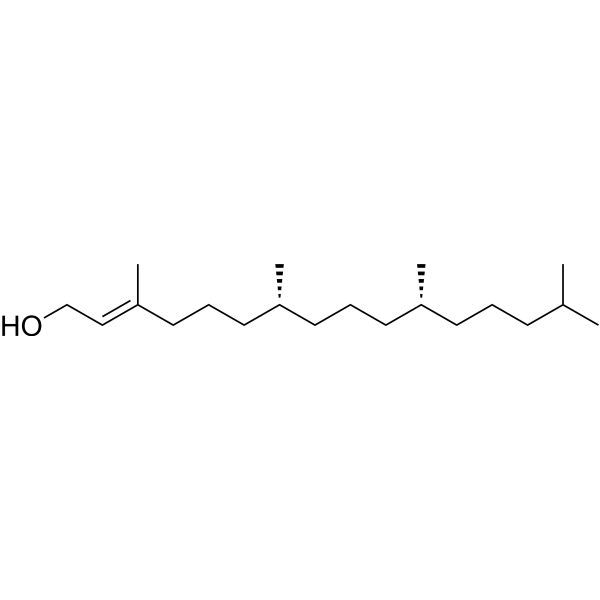
HY-N3075
PhytolDiterpene Alcohol -

HY-N3075R
Phytol (Standard)Diterpene Alcohol -
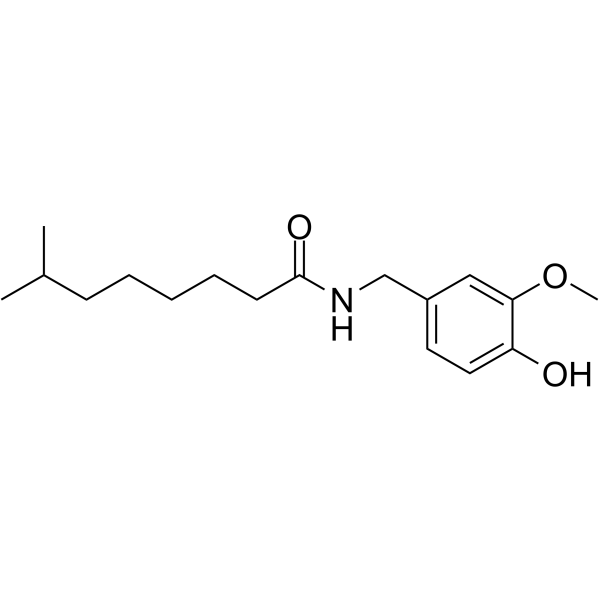
HY-N0449
NordihydrocapsaicinCapsaicinoid Analog -
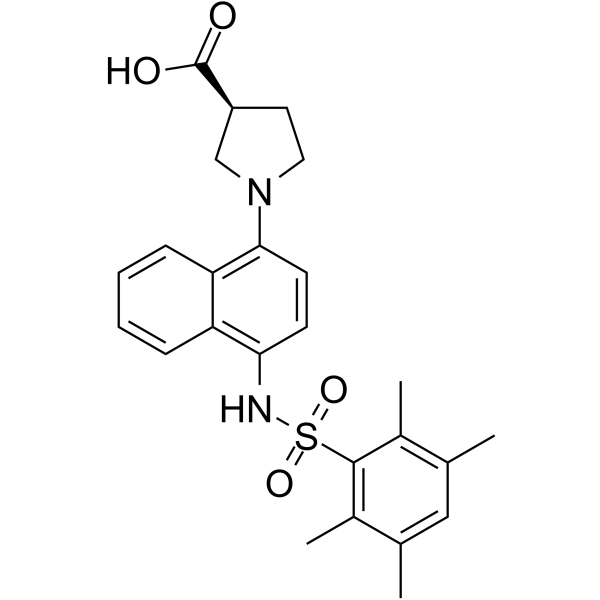
HY-110275
RA839Nrf2 Activator -
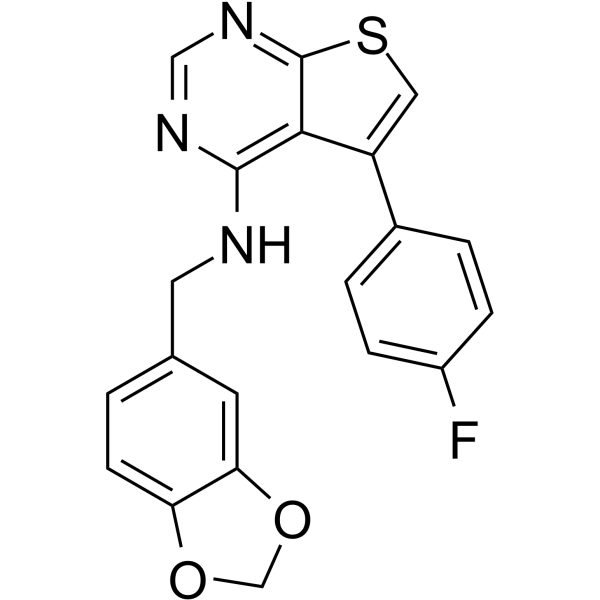
HY-113848
AEM1Keap1-Nrf2 Inhibitor -
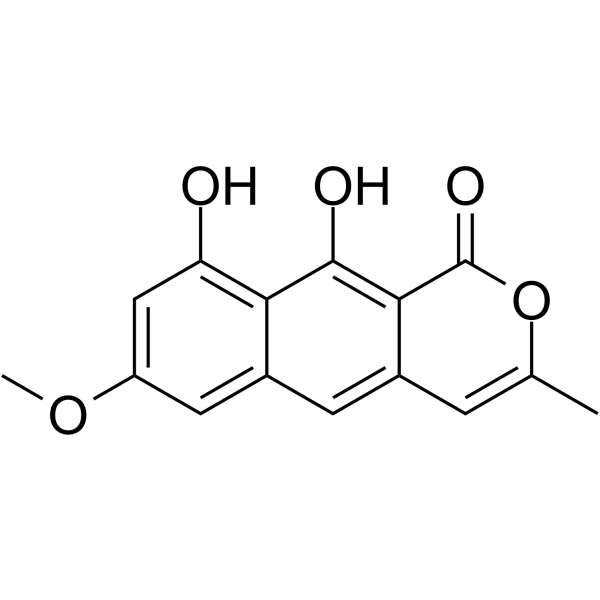
HY-N7617
ToralactoneKeap1-Nrf2 Inhibitor


Biological Activity
Description
IC50 & Target
[1]|
MMP-1 |
COX-2 |
IL-1β |
Bax |
Bcl-2 |
Caspase 3 |
Caspase 8 |
Caspase 9 |
Cellular Effect
|
Cell Line

|
Type | Value | Description | References |
|---|---|---|---|---|
| CCRF-CEM | IC50 |
0.16 μg/mL
Compound: 1; STM
|
Growth inhibition of human CCRF-CEM cells incubated for 24 to 48 hrs by trypan blue exclusion assay
Growth inhibition of human CCRF-CEM cells incubated for 24 to 48 hrs by trypan blue exclusion assay
|
[PMID: 33775837] |
| KB | IC50 |
0.16 μg/mL
Compound: 1; STM
|
Growth inhibition of human KB cells incubated for 72 hrs by methylene blue staining based assay
Growth inhibition of human KB cells incubated for 72 hrs by methylene blue staining based assay
|
[PMID: 33775837] |
| L1210 | IC50 |
0.16 μg/mL
Compound: 1; STM
|
Growth inhibition of mouse L1210 cells incubated for 24 to 48 hrs by trypan blue exclusion assay
Growth inhibition of mouse L1210 cells incubated for 24 to 48 hrs by trypan blue exclusion assay
|
[PMID: 33775837] |
| LS174T | IC50 |
0.16 μg/mL
Compound: 1; STM
|
Growth inhibition of human LS174T cells incubated for 72 hrs by methylene blue staining based assay
Growth inhibition of human LS174T cells incubated for 72 hrs by methylene blue staining based assay
|
[PMID: 33775837] |
| LX-2 | IC50 |
>60 μM
Compound: 1; STM
|
Inhibition of hyaluronic acid deposition in human LX2 cells incubated for 72 hrs by ELISA
Inhibition of hyaluronic acid deposition in human LX2 cells incubated for 72 hrs by ELISA
|
[PMID: 33775837] |
| LX-2 | IC50 |
16.5 μM
Compound: 1; STM
|
Cytotoxicity against human LX2 cells assessed as reduction in cell viability incubated for 48 hrs by MTT assay
Cytotoxicity against human LX2 cells assessed as reduction in cell viability incubated for 48 hrs by MTT assay
|
[PMID: 33775837] |
| LX-2 | IC50 |
18.6 μM
Compound: 1; STM
|
Inhibition of laminin deposition in human LX2 cells incubated for 72 hrs by ELISA
Inhibition of laminin deposition in human LX2 cells incubated for 72 hrs by ELISA
|
[PMID: 33775837] |
| LX-2 | IC50 |
7.3 μM
Compound: 1; STM
|
Inhibition of collagen type 1 deposition in human LX2 cells incubated for 72 hrs by ELISA
Inhibition of collagen type 1 deposition in human LX2 cells incubated for 72 hrs by ELISA
|
[PMID: 33775837] |
| MCF7 | IC50 |
0.16 μg/mL
Compound: 1; STM
|
Growth inhibition of human MCF7 cells incubated for 72 hrs by methylene blue staining based assay
Growth inhibition of human MCF7 cells incubated for 72 hrs by methylene blue staining based assay
|
[PMID: 33775837] |
| Platelet | IC50 |
84.93 μM
Compound: Santamarin
|
Antimigraine activity in bovine citreated platelet assessed as inhibition of [14C]serotonin release after 6 mins by scintillation counting
Antimigraine activity in bovine citreated platelet assessed as inhibition of [14C]serotonin release after 6 mins by scintillation counting
|
[PMID: 1431933] |
| Platelet | IC50 |
84.93 μM
Compound: 23
|
Inhibition of serotonin release in bovine platelets
Inhibition of serotonin release in bovine platelets
|
[PMID: 18271521] |
| T-cell | IC50 |
19.6 μM
Compound: 7
|
Immunosuppressant activity in human T lymphocytes assessed as inhibition of anti-human CD3 and anti-human CD28 monoclonal antibody-induced T lymphocyte proliferation incubated for 72 hrs by FACS analysis
Immunosuppressant activity in human T lymphocytes assessed as inhibition of anti-human CD3 and anti-human CD28 monoclonal antibody-induced T lymphocyte proliferation incubated for 72 hrs by FACS analysis
|
[PMID: 31181920] |
| T-cell | IC50 |
5.56 μM
Compound: E1
|
Immunomodulatory activity in C57BL/6 mouse mesenteric lymph node T cells assessed as inhibition of concanavalin A stimulated T-cell proliferation incubated for 68 hrs by CCK-8 assay
Immunomodulatory activity in C57BL/6 mouse mesenteric lymph node T cells assessed as inhibition of concanavalin A stimulated T-cell proliferation incubated for 68 hrs by CCK-8 assay
|
[PMID: 37017305] |
In Vitro
Santamarine (1-10 μM; 1 h) scavenges intracellular ROS in HDFs with an IC50 of 4.04 μM[1].
Santamarine (1-10 μM; 24 h) dose-dependently reduces UVA-induced MMP-1 secretion in HDFs, with a significant reduction to 33.00 ng/mL at 10 μM[1].
Santamarine (1-10 μM; 24 h) dose-dependently downregulates UVA-induced MMP-1, -3, -9 mRNA and protein expression in HDFs[1].
Santamarine (1-10 μM; 24 h) dose-dependently stimulates type I procollagen mRNA and protein expression in UVA-irradiated HDFs[1].
Santamarine (10 μM; 24 h) suppresses UVA-induced activation of the p38/JNK MAPK pathway and nuclear translocation of AP-1 complex components p-c-Fos and p-c-Jun in HDFs[1].
Santamarine (10 μM; 24 h) activates the TGF-β/Smad pathway in UVA-irradiated HDFs by restoring TGF-β levels, increasing Smad2/3 phosphorylation, reducing Smad7 levels, and elevating nuclear p-Smad2/3 and Smad4 levels[1].
Santamarine (1-10 μM; 24 h) dose-dependently stimulates Nrf2-dependent expression of antioxidant enzymes SOD-1 and HO-1 in UVA-irradiated HDF[1].
Santamarin (5-80 μM; 24 h) does not significantly reduce RAW264.7 cell viability at concentrations up to 40 μM[2].
Santamarin (5-40 μM; 12 h) concentration-dependently reduces iNOS and COX-2 protein expression in LPS (HY-D1056)-stimulated RAW264.7 cells[2].
Santamarin (5-40 μM; 12 h) concentration-dependently reduces nitrite, PGE2, TNF-α, and IL-1β production in LPS-stimulated RAW264.7 cells[2].
Santamarin (5-40 μM; 12 h) concentration-dependently inhibits LPS-induced IκB-α phosphorylation/degradation, p65 nuclear translocation, and NF-κB DNA binding activity in RAW264.7 cells[2].
Santamarin (5-40 μM; 12 h) concentration-dependently increases HO-1 mRNA and protein expression, and HO enzyme activity in RAW264.7 cells[2].
Santamarin (40 μM; 0.5-1.5 h) induces a time-dependent nuclear translocation of Nrf2 in RAW264.7 cells over 0.5 to 1.5 h of incubation[2].
Santamarine (10-100 μM; 24 h) dose-dependently inhibits the growth of A549 and NCI-H1650 lung adenocarcinoma cells (IC50 = 45 μM and 43 μM, respectively) and is far less toxic to NL-20 normal lung cells (IC50 = 85 μM)[3].
Santamarine (40-60 μM; 24 h) induces dose-dependent cell death, apoptosis and associated morphological changes in A549 and NCI-H1650 lung adenocarcinoma cells and these changes are reversed by the ROS scavenger NAC (HY-B0215)[3].
Santamarine (40-60 μM; 1-24 h) induces ROS generation (maximal at 4 h) in A549 lung adenocarcinoma cells, with no detectable change in ROS levels after 24 h treatment[3].
Santamarine (40-60 μM; 24 h) dose-dependently reduces the intracellular GSH/GSSG ratio in A549 lung adenocarcinoma cells and this effect is reversed by the ROS scavenger NAC[3].
Santamarine (40-60 μM; 24 h) dose-dependently inhibits thioredoxin reductase activity in A549 lung adenocarcinoma cells and this effect is reversed by the ROS scavenger NAC[3].
Santamarine (40-60 μM; 24 h) dose-dependently induces oxidative stress-mediated mitochondrial apoptosis in A549 lung adenocarcinoma cells via modulation of Bcl-2 family proteins, dissipation of mitochondrial membrane potential, and activation of caspase-3 and PARP cleavage, with all effects reversed by the ROS scavenger NAC[3].
Santamarine (40-60 μM; 24 h) dose-dependently inhibits constitutive and TNF-α-induced NF-κBp65 nuclear translocation and IκB-α phosphorylation in A549 lung adenocarcinoma cells via an oxidative stress-dependent mechanism[3].
Santamarine (0-25 μg/mL; 24 h) selectively inhibits viability of OC-2 and HSC-3 oral cancer cells, with IC50 values of 15.7 μg/mL and 18.49 μg/mL after 24 h treatment, while having minimal effect on normal S-G cells, and this selective activity is oxidative stress-dependent[4].
Santamarine (15-25 μg/mL; 24 h) induces G2/M cell cycle arrest in OC-2 and HSC-3 oral cancer cells after 24 h treatment at 15 and 25 μg/mL, while causing only minor changes in normal S-G cells[4].
Santamarine (15-25 μg/mL; 12-24 h) dose-dependently and time-dependently induces apoptosis and activates caspase 3, 8, 9 in OC-2 and HSC-3 oral cancer cells, while having minimal effect on normal S-G cells[4].
Santamarine (15-25 μg/mL; 12-24 h) dose-dependently and time-dependently induces ROS, mitochondrial superoxide generation and MMP, GSH depletion in OC-2 and HSC-3 oral cancer cells, while having minimal effect on normal S-G cells[4].
Santamarine (15-25 μg/mL; 12-24 h) dose-dependently and time-dependently induces γH2AX- and 8-OHdG-mediated DNA damage in OC-2 and HSC-3 oral cancer cells, while having minimal effect on normal S-G cells[4].
MedChemExpress (MCE) has not independently confirmed the accuracy of these methods. They are for reference only.
-
Cell Line:UVA-irradiated human dermal fibroblasts (HDFs)
-
Concentration:1, 5, 10 μM
-
Incubation Time:24 h
-
Result:Decreased UVA-induced MMP-1 secretion in a dose-dependent manner.
Reduced MMP-1 secretion from 40.74 ng/mL (UVA-only group) to 33.00 ng/mL at 10 μM.
-
Cell Line:UVA-irradiated human dermal fibroblasts (HDFs)
-
Concentration:1, 5, 10 μM
-
Incubation Time:24 h
-
Result:Markedly suppressed UVA-induced MMP-1, -3, -9 protein expression.
-
Cell Line:UVA-irradiated human dermal fibroblasts (HDFs)
-
Concentration:10 μM
-
Incubation Time:24 h
-
Result:Suppressed UVA-induced phosphorylation of p38 and JNK.
Upregulated ERK phosphorylation.
Significantly reduced UVA-induced increases in total p-c-Fos and p-c-Jun levels.
Reduced nuclear translocation of p-c-Fos and p-c-Jun.\nReversed UVA-induced suppression of TGF-β protein levels and Smad2/3 phosphorylation.
Reduced UVA-induced upregulation of Smad7 levels.
Reverted UVA-induced decreases in nuclear p-Smad2/3 and Smad4 levels.
-
Cell Line:RAW264.7 murine macrophage cells
-
Concentration:5, 10, 20, 40, 80 μM
-
Incubation Time:24 h
-
Result:Did not significantly decrease cell viability at concentrations up to 40 μM.
Caused a significant reduction in viability at 80 μM.
-
Cell Line:LPS-stimulated RAW264.7 murine macrophage cells
-
Concentration:5, 10, 20, 40 μM
-
Incubation Time:12 h (pre-incubation); 18 h (LPS stimulation)
-
Result:Reduced LPS-induced iNOS protein expression in a concentration-dependent manner.
Suppressed LPS-induced COX-2 protein expression in a concentration-dependent manner.
-
Cell Line:A549, NCI-H1650, NL-20
-
Concentration:10, 20, 40, 80, 100 μM
-
Incubation Time:24 h
-
Result:Inhibited growth of A549 and NCI-H1650 cells in a dose-dependent manner, with IC50 values of 45 μM and 43 μM, respectively.
Exerted a significantly lower growth inhibitory effect on NL-20 cells, with an IC50 value of 85 μM.
-
Cell Line:A549
-
Concentration:40, 60 μM
-
Incubation Time:24 h
-
Result:Induced dose-dependent apoptotic cell death in A549 cells.
Reversed this apoptotic effect when cells were pretreated with 3 mM NAC.
-
Cell Line:A549
-
Concentration:40, 60 μM
-
Incubation Time:24 h
-
Result:Increased Bax, Cl-Casp-3, Cl-PARP levels and reduced Bcl-2 levles.
Dose-dependently inhibited constitutive NF-κBp65 translocation into the nucleus.
Inhibited TNF-α-induced NF-κBp65 translocation into the nucleus.
Dose-dependently inhibited IκB-α phosphorylation without altering IκB-α expression.
Reversed the inhibitory effect on NF-κBp65 translocation when cells were pretreated with 3 mM NAC.
-
Cell Line:oral squamous cell carcinoma OC-2 cells, oral squamous cell carcinoma HSC-3 cells, normal gingival epithelial S-G cells
-
Concentration:15, 25 μg/mL
-
Incubation Time:24 h
-
Result:Decreased G1 and S phase populations and increased G2/M phase populations in OC-2 and HSC-3 cells, inducing G2/M arrest, with a marginal elevation of subG1 phase.
Caused only minor changes in G1, S, and G2/M phase populations of S-G cells.
Suppressed differential cell cycle disturbance was observed with pre-treatment with NAC.
-
Cell Line:oral squamous cell carcinoma OC-2 cells, oral squamous cell carcinoma HSC-3 cells, normal gingival epithelial S-G cells
-
Concentration:15, 25 μg/mL
-
Incubation Time:12, 24 h
-
Result:Increased the percentage of Annexin V-positive apoptotic OC-2 and HSC-3 cells in a dose-dependent manner after 24 h treatment.
Increased the percentage of Annexin V-positive apoptotic OC-2 and HSC-3 cells in a time-dependent manner over 0, 12, 24 h at 25 μg/mL.
Caused only weak changes in the percentage of apoptotic S-G cells.
Suppressed differential apoptosis induction was observed with pre-treatment with NAC.
- Western Blot
- Mitochondrial membrane-potential fluorescent assay
- Annexin V plus membrane-impermeant dye apoptosis staining
- ROS/oxidative-stress fluorescent staining
- BrdU Incorporation Assay
- Somatic Cell Culture
- Protocol for Cell Cycle
- CCK-8/WST-8 Cell Proliferation Assay
- Research Protocol for Inflammation-related Diseases
- Cell Counting-Based Growth Curve Assay
- Cell Viability Determination by MTT Colorimetric Assay
- Kinase activity and phosphorylation assays
- Cytoplasmic-Nuclear Fractionated Protein Extraction
- Detection of Apoptosis
- TUNEL staining for apoptotic DNA fragmentation
- Flow cytometric DNA-content cell-cycle staining
- Protocol for Cell Counting and Cell Density Analysis
- Mitochondrial membrane-potential and mitochondrial mass staining
- Apoptosis Solutions
- Protocol for Kinase activity and phosphorylation assays
- MTT Cell Proliferation Assay
- Genotoxicity/Mutagenicity Study
- Pyroptosis Solutions


Chemical Information
-
CAS No. 4290-13-5
-
Appearance Solid
-
Molecular Weight 248.32
-
Formula C15H20O3
-
Color White to off-white
-
SMILES
O=C(O[C@@]1([H])[C@@]2([H])CC[C@@]3(C)[C@H](O)CC=C(C)[C@@]31[H])C2=C
-
Synonyms
Santamarin; Balchanin
-
Structure Classification
-
Initial Source
-
Shipping
Room temperature in continental US; may vary elsewhere.
-
Storage
Powder -20°C 3 years In solvent -80°C 6 months -20°C 1 month


Purity & Documentation
-
Data Sheet (295 KB)
-
SDS (251 KB)
- English - EN (251 KB)
- Français - FR (251 KB)
- Deutsch - DE (251 KB)
- Norwegian - NO (251 KB)
- Español - ES (251 KB)
- Swedish - SV (251 KB)
- Italian - IT (251 KB)
- Korean - KR (251 KB)
- Portuguese - PT (251 KB)
-
Handling Instructions (2659 KB)
References
[1]. Oh JH, et al. Santamarine Shows Anti-Photoaging Properties via Inhibition of MAPK/AP-1 and Stimulation of TGF-β/Smad Signaling in UVA-Irradiated HDFs. Molecules. 2021;26(12):3585. Published 2021 Jun 11. [Content Brief]
[2]. Choi HG, et al. Santamarin, a sesquiterpene lactone isolated from Saussurea lappa, represses LPS-induced inflammatory responses via expression of heme oxygenase-1 in murine macrophage cells. Int Immunopharmacol. 2012;13(3):271-279. [Content Brief]
[3]. Wu X, et al. Santamarine Inhibits NF-κB Activation and Induces Mitochondrial Apoptosis in A549 Lung Adenocarcinoma Cells via Oxidative Stress. Biomed Res Int. 2017;2017:4734127. [Content Brief]
[4]. Lu H I, et al. Michelia compressa-derived santamarine inhibits oral cancer cell proliferation via oxidative stress-mediated apoptosis and DNA damage[J]. Pharmaceuticals, 2024, 17(2): 230. [Content Brief]

Calculators
Concentration (start) × Volume (start) = Concentration (final) × Volume (final)


Santamarine Related Classifications
HY-N1326 Related Classifications
 Powered by Bioz
Keywords
- Santamarine
- 4290-13-5
- Santamarin
- Balchanin
- JNK
- p38 MAPK
- MMP
- NF-κB
- COX
- TNF Receptor
- Interleukin Related
- Reactive Oxygen Species (ROS)
- Apoptosis
- Mitochondrial Metabolism
- DNA/RNA Synthesis
- Keap1-Nrf2
- Bcl-2 Family
- Caspase
- PARP
- TGF-beta/Smad
- Mycobacterium tuberculosis
- HSC-3 cells
- Nrf2
- SOD-1
- NCI-H1650 cells
- HO-1
- HDFs
- RAW264.7 cells
- OC-2 cells
- A549 cells
- Inhibitor
- inhibitor
- inhibit